Pitch Deck Teardown: Mint House’s $35M Series B deck
Mint House has bubbled to the top of the hospitality industry with a series of tech-forward apartments. Here’s the deck it used to land a $35 million Series…
Life has been pretty brutal in hospitality over the past couple of years, but that hasn’t stopped Mint House from bubbling to the top with a series of tech-forward apartments.
Under the slogan of “The comfort of home. The luxury of a hotel. Tech-enabled and tailored to you,” the company is trying to make being away from home a bit less crappy. Targeting high-end business and leisure travelers, Mint House recently raised a $35 million Series B from Mohari Hospitality, with participation from Revolution Ventures, Allegion Ventures and Ingleside Investors. In this teardown, we’ll take a closer look at the deck the company used to land its Series B.
We’re looking for more unique pitch decks to tear down, so if you want to submit your own, here’s how you can do that.
Slides in this deck
Cover slide
Summary slide
Business model slide
Consumer product slide
Competitor comparison slide
Key metrics slide
Value proposition for real estate slide
Results slide
Corporate partnerships slide
Team slide
Appendices cover slide
Case Study appendix slide
Three things to love
I’m curious how they raised this round, especially given that the deck has a Texas-sized red flag.
Raising $35 million in the hotel space at the tail end of a pandemic? Good heavens, I’m curious how they pulled that one off. That is doubly true given that the deck has a Texas-sized red flag on what is universally accepted to be one of the most important slides of any deck (more about that in the “things that could be better” section below.
But hey! That’s what we’re here to examine! Let’s start with the big wins:
Excellent 1-page summary slide
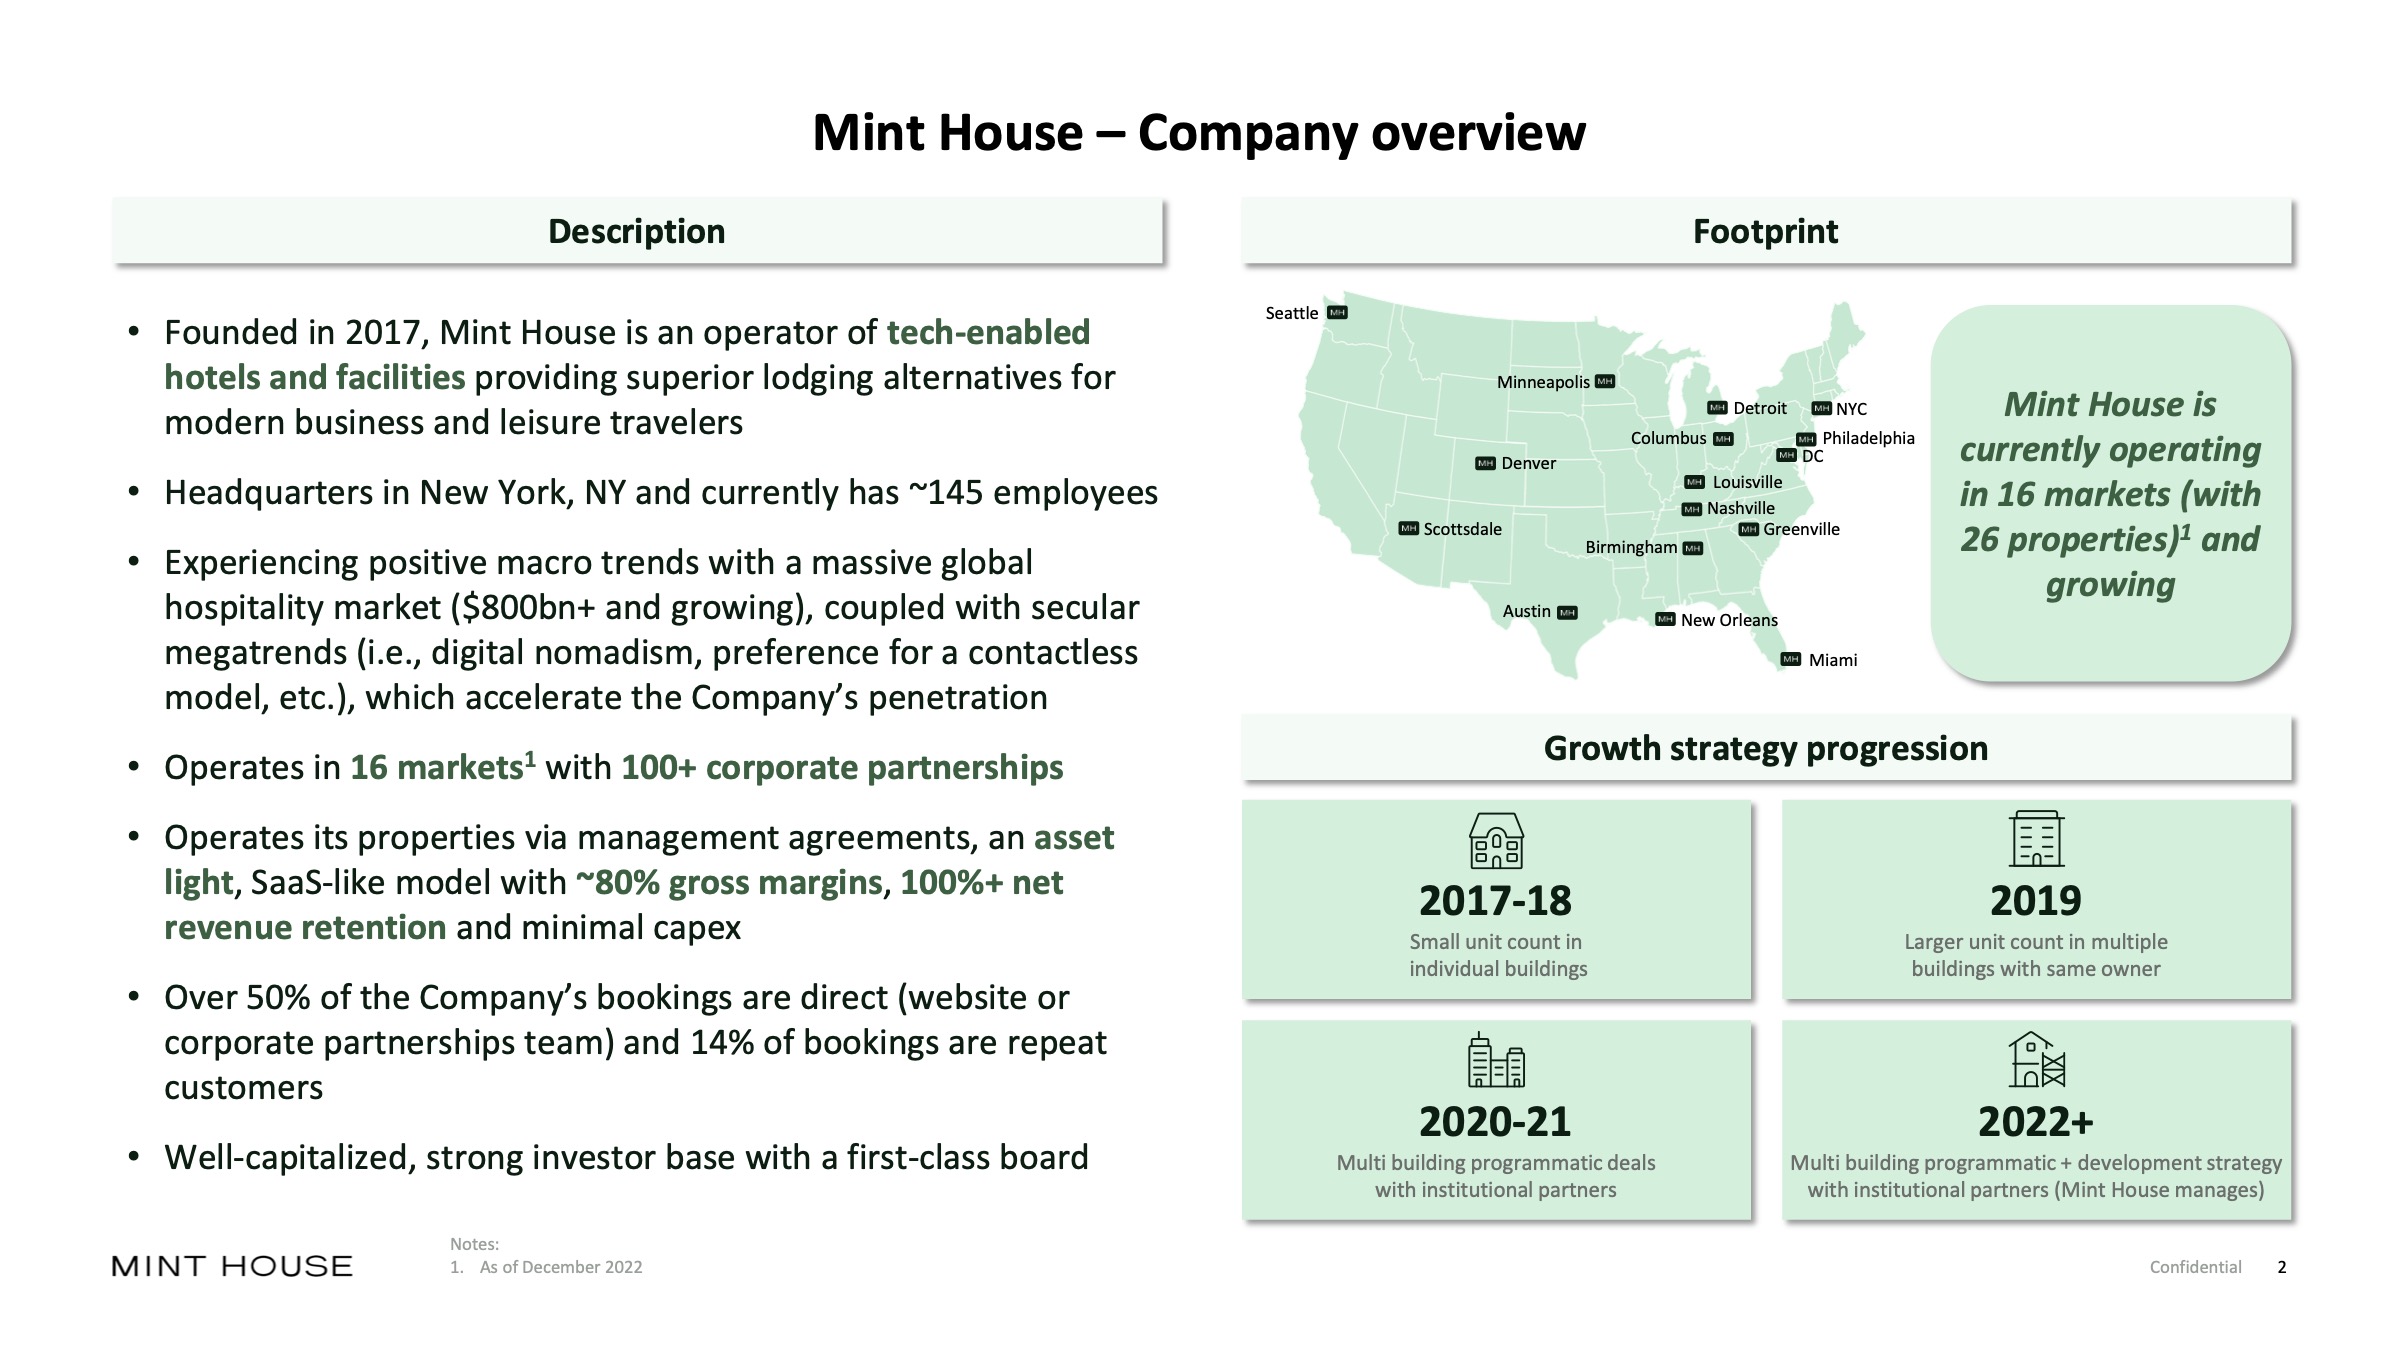
[Slide 2] Ugh, I love a good summary slide. Image Credits: Mint House (opens in a new window)
I’ve made no secret of loving a good summary slide — it can really set the tone and pace of a presentation. This cover slide isn’t great to be used in a pitch setting; for presentations, I would probably recommend simplifying it further. But for a send-ahead deck, this gets investors up to speed very quickly and explains the macroeconomics of what the company is doing and its traction and progress to date and offers a brief summary of what the company is doing and whom they do it for.
I wish it also mentioned how much money it was raising, either here or on the cover slide — but apart from that, this slide is a beacon of perfection.
As a startup founder, the thing you can learn from this slide is how to get an investor filled in on the context for the company and the round at hyperspeed so you can focus the bulk of your pitch on the things that really matter: What you’re raising, what your plans are and where the market is going. This is particularly important for later rounds — dwelling on the past is important only to prove that you know what you’re doing. Investors are investing in what’s going to happen next, after all.
Front-load the longest pole in the tent
As a startup founder, you can probably predict what the biggest challenges are for the company you are about to pitch. In the case of Mint House, the third slide says something about what the company has been pushing against when it comes to investment. Hotels can be a lucrative business, but the business model is well-trodden ground. The company is promising to innovate on that model, and to investors, that’s both the biggest risk and the biggest opportunity.
[Slide 3] Digging into the business model. Image Credits: Mint House
In the cutthroat world of hospitality, it’s fantastically hard to stand out, and nonspecialist investors often don’t even look at the vertical. Finding a way of telling the story well and clearly differentiating yourself from the status quo is a crucial part of telling the story. Mint House does that beautifully here, touching essentially every part of the business model on a single slide. Is the slide itself good? Not exactly — the text is so small it’s practically unreadable. But it does the job of summarizing the key differentiators really well.
As a startup, what you can learn here is how to differentiate yourself from a wall of incumbents. If you cannot, well, you essentially don’t have a business at all.
Show me the numbers!
[Slide 6] Metrics for days. Image Credits: Mint House
Businesses that are in operating and scale-up mode have metrics. Not showing them in your pitch deck is very silly indeed and just as important as the numbers themselves are the numbers you select to represent your business to your potential investors.
The fact that this slide is here is great and encouraging — but investors are going to be looking very closely. Operating profit margin, revenue per available room and occupancy numbers are crucial for the operating side of the business. In other words: If you are in charge of growing and developing Mint House for the next three months, those metrics are crucially important.
However, those aren’t necessarily the metrics investors care about. I’d have expected to see graphs here, including revenue, occupancy over time and perhaps customer acquisition costs and other metrics that show what’s happening under the hood. Operational efficiency and cash flow might be another set of metrics worth a closer look.
The kind of metrics an investor would care about are directly linked to the fundraise itself. You’re raising $35 million? Great. Show what you’re going to do with the money and what the major milestones are for the next six to 18 months in the form of an operating plan.
There’s a deep orange, if perhaps not red, flag here, too, though: The net promoter score is represented as a percentage, which is incorrect. NPS is an absolute number ranging from -100 to 100, calculated using a formula you can find on every growth-hacking blog that ever existed. The fact that the founders (and everyone who looked at this deck) didn’t catch that — along with the strangely not-quite-right selection of metrics above — makes me wonder about the quality of the overall team.
Where my mind goes here is whether the team is made up of tech startup founders or hotel operators. Nothing wrong with being the latter, but Airbnb is able to run with much better profit margins than someone who is operating a suite of dozens of brick-and-mortar buildings. I’m not saying that this wouldn’t be a good investment, but I question whether it makes sense as a VC investment.
In the rest of this teardown, we’ll take a look at three things Mint House could have improved or done differently, along with its full pitch deck — and that big red flag I mentioned earlier.
Three things that could be improved
As good as Mint House’s pitch deck is, there are a few things that made me scratch my head — some mistakes that are serious enough that I was kinda curious how the company was successful in raising at all, if I’m being honest. Let’s take a look.
BUFFALO, NY- March 11, 2024 – Impact Journals publishes scholarly journals in the biomedical sciences with a focus on all areas of cancer and aging research. Aging is one of the most prominent journals published by Impact Journals.
Credit: Impact Journals
BUFFALO, NY- March 11, 2024 – Impact Journals publishes scholarly journals in the biomedical sciences with a focus on all areas of cancer and aging research. Aging is one of the most prominent journals published by Impact Journals.
Impact Journals will be participating as an exhibitor at the American Association for Cancer Research (AACR) Annual Meeting 2024 from April 5-10 at the San Diego Convention Center in San Diego, California. This year, the AACR meeting theme is “Inspiring Science • Fueling Progress • Revolutionizing Care.”
Visit booth #4159 at the AACR Annual Meeting 2024 to connect with members of the Agingteam.
About Aging-US:
Agingpublishes research papers in all fields of aging research including but not limited, aging from yeast to mammals, cellular senescence, age-related diseases such as cancer and Alzheimer’s diseases and their prevention and treatment, anti-aging strategies and drug development and especially the role of signal transduction pathways such as mTOR in aging and potential approaches to modulate these signaling pathways to extend lifespan. The journal aims to promote treatment of age-related diseases by slowing down aging, validation of anti-aging drugs by treating age-related diseases, prevention of cancer by inhibiting aging. Cancer and COVID-19 are age-related diseases.
Agingis indexed and archived byPubMed/Medline (abbreviated as “Aging (Albany NY)”), PubMed Central, Web of Science: Science Citation Index Expanded (abbreviated as “Aging‐US” and listed in the Cell Biology and Geriatrics & Gerontology categories), Scopus (abbreviated as “Aging” and listed in the Cell Biology and Aging categories), Biological Abstracts, BIOSIS Previews, EMBASE, META (Chan Zuckerberg Initiative) (2018-2022), and Dimensions (Digital Science).
Please visit our website at www.Aging-US.com and connect with us:
NY Fed Finds Medium, Long-Term Inflation Expectations Jump Amid Surge In Stock Market Optimism
One month after the inflation outlook tracked by the NY Fed Consumer Survey extended their late 2023 slide, with 3Y inflation expectations in January sliding to a record low 2.4% (from 2.6% in December), even as 1 and 5Y inflation forecasts remained flat, moments ago the NY Fed reported that in February there was a sharp rebound in longer-term inflation expectations, rising to 2.7% from 2.4% at the three-year ahead horizon, and jumping to 2.9% from 2.5% at the five-year ahead horizon, while the 1Y inflation outlook was flat for the 3rd month in a row, stuck at 3.0%.
The increases in both the three-year ahead and five-year ahead measures were most pronounced for respondents with at most high school degrees (in other words, the "really smart folks" are expecting deflation soon). The survey’s measure of disagreement across respondents (the difference between the 75th and 25th percentile of inflation expectations) decreased at all horizons, while the median inflation uncertainty—or the uncertainty expressed regarding future inflation outcomes—declined at the one- and three-year ahead horizons and remained unchanged at the five-year ahead horizon.
Going down the survey, we find that the median year-ahead expected price changes increased by 0.1 percentage point to 4.3% for gas; decreased by 1.8 percentage points to 6.8% for the cost of medical care (its lowest reading since September 2020); decreased by 0.1 percentage point to 5.8% for the cost of a college education; and surprisingly decreased by 0.3 percentage point for rent to 6.1% (its lowest reading since December 2020), and remained flat for food at 4.9%.
We find the rent expectations surprising because it is happening just asking rents are rising across the country.
At the same time as consumers erroneously saw sharply lower rents, median home price growth expectations remained unchanged for the fifth consecutive month at 3.0%.
Turning to the labor market, the survey found that the average perceived likelihood of voluntary and involuntary job separations increased, while the perceived likelihood of finding a job (in the event of a job loss) declined. "The mean probability of leaving one’s job voluntarily in the next 12 months also increased, by 1.8 percentage points to 19.5%."
Mean unemployment expectations - or the mean probability that the U.S. unemployment rate will be higher one year from now - decreased by 1.1 percentage points to 36.1%, the lowest reading since February 2022. Additionally, the median one-year-ahead expected earnings growth was unchanged at 2.8%, remaining slightly below its 12-month trailing average of 2.9%.
Turning to household finance, we find the following:
The median expected growth in household income remained unchanged at 3.1%. The series has been moving within a narrow range of 2.9% to 3.3% since January 2023, and remains above the February 2020 pre-pandemic level of 2.7%.
Median household spending growth expectations increased by 0.2 percentage point to 5.2%. The increase was driven by respondents with a high school degree or less.
Median year-ahead expected growth in government debt increased to 9.3% from 8.9%.
The mean perceived probability that the average interest rate on saving accounts will be higher in 12 months increased by 0.6 percentage point to 26.1%, remaining below its 12-month trailing average of 30%.
Perceptions about households’ current financial situations deteriorated somewhat with fewer respondents reporting being better off than a year ago. Year-ahead expectations also deteriorated marginally with a smaller share of respondents expecting to be better off and a slightly larger share of respondents expecting to be worse off a year from now.
The mean perceived probability that U.S. stock prices will be higher 12 months from now increased by 1.4 percentage point to 38.9%.
At the same time, perceptions and expectations about credit access turned less optimistic: "Perceptions of credit access compared to a year ago deteriorated with a larger share of respondents reporting tighter conditions and a smaller share reporting looser conditions compared to a year ago."
Also, a smaller percentage of consumers, 11.45% vs 12.14% in prior month, expect to not be able to make minimum debt payment over the next three months
Last, and perhaps most humorous, is the now traditional cognitive dissonance one observes with these polls, because at a time when long-term inflation expectations jumped, which clearly suggests that financial conditions will need to be tightened, the number of respondents expecting higher stock prices one year from today jumped to the highest since November 2021... which incidentally is just when the market topped out during the last cycle before suffering a painful bear market.
Homes listed for sale in early June sell for $7,700 more
New Zillow research suggests the spring home shopping season may see a second wave this summer if mortgage rates fall
The post Homes listed for sale in…
A Zillow analysis of 2023 home sales finds homes listed in the first two weeks of June sold for 2.3% more.
The best time to list a home for sale is a month later than it was in 2019, likely driven by mortgage rates.
The best time to list can be as early as the second half of February in San Francisco, and as late as the first half of July in New York and Philadelphia.
Spring home sellers looking to maximize their sale price may want to wait it out and list their home for sale in the first half of June. A new Zillow® analysis of 2023 sales found that homes listed in the first two weeks of June sold for 2.3% more, a $7,700 boost on a typical U.S. home.
The best time to list consistently had been early May in the years leading up to the pandemic. The shift to June suggests mortgage rates are strongly influencing demand on top of the usual seasonality that brings buyers to the market in the spring. This home-shopping season is poised to follow a similar pattern as that in 2023, with the potential for a second wave if the Federal Reserve lowers interest rates midyear or later.
The 2.3% sale price premium registered last June followed the first spring in more than 15 years with mortgage rates over 6% on a 30-year fixed-rate loan. The high rates put home buyers on the back foot, and as rates continued upward through May, they were still reassessing and less likely to bid boldly. In June, however, rates pulled back a little from 6.79% to 6.67%, which likely presented an opportunity for determined buyers heading into summer. More buyers understood their market position and could afford to transact, boosting competition and sale prices.
The old logic was that sellers could earn a premium by listing in late spring, when search activity hit its peak. Now, with persistently low inventory, mortgage rate fluctuations make their own seasonality. First-time home buyers who are on the edge of qualifying for a home loan may dip in and out of the market, depending on what’s happening with rates. It is almost certain the Federal Reserve will push back any interest-rate cuts to mid-2024 at the earliest. If mortgage rates follow, that could bring another surge of buyers later this year.
Mortgage rates have been impacting affordability and sale prices since they began rising rapidly two years ago. In 2022, sellers nationwide saw the highest sale premium when they listed their home in late March, right before rates barreled past 5% and continued climbing.
Zillow’s research finds the best time to list can vary widely by metropolitan area. In 2023, it was as early as the second half of February in San Francisco, and as late as the first half of July in New York. Thirty of the top 35 largest metro areas saw for-sale listings command the highest sale prices between May and early July last year.
Zillow also found a wide range in the sale price premiums associated with homes listed during those peak periods. At the hottest time of the year in San Jose, homes sold for 5.5% more, a $88,000 boost on a typical home. Meanwhile, homes in San Antonio sold for 1.9% more during that same time period.
We use cookies on our website to give you the most relevant experience by remembering your preferences and repeat visits. By clicking “Accept”, you consent to the use of ALL the cookies.
This website uses cookies to improve your experience while you navigate through the website. Out of these, the cookies that are categorized as necessary are stored on your browser as they are essential for the working of basic functionalities of the website. We also use third-party cookies that help us analyze and understand how you use this website. These cookies will be stored in your browser only with your consent. You also have the option to opt-out of these cookies. But opting out of some of these cookies may affect your browsing experience.
Necessary cookies are absolutely essential for the website to function properly. These cookies ensure basic functionalities and security features of the website, anonymously.
Cookie
Duration
Description
cookielawinfo-checbox-analytics
11 months
This cookie is set by GDPR Cookie Consent plugin. The cookie is used to store the user consent for the cookies in the category "Analytics".
cookielawinfo-checbox-functional
11 months
The cookie is set by GDPR cookie consent to record the user consent for the cookies in the category "Functional".
cookielawinfo-checbox-others
11 months
This cookie is set by GDPR Cookie Consent plugin. The cookie is used to store the user consent for the cookies in the category "Other.
cookielawinfo-checkbox-necessary
11 months
This cookie is set by GDPR Cookie Consent plugin. The cookies is used to store the user consent for the cookies in the category "Necessary".
cookielawinfo-checkbox-performance
11 months
This cookie is set by GDPR Cookie Consent plugin. The cookie is used to store the user consent for the cookies in the category "Performance".
viewed_cookie_policy
11 months
The cookie is set by the GDPR Cookie Consent plugin and is used to store whether or not user has consented to the use of cookies. It does not store any personal data.
Functional cookies help to perform certain functionalities like sharing the content of the website on social media platforms, collect feedbacks, and other third-party features.
Performance cookies are used to understand and analyze the key performance indexes of the website which helps in delivering a better user experience for the visitors.
Analytical cookies are used to understand how visitors interact with the website. These cookies help provide information on metrics the number of visitors, bounce rate, traffic source, etc.
Advertisement cookies are used to provide visitors with relevant ads and marketing campaigns. These cookies track visitors across websites and collect information to provide customized ads.


