Uncategorized
Opinion: Buy or Sell Facebook (FB) Before Earnings?
Opinion: Buy or Sell Facebook (FB) Before Earnings?
Share this:


The impact of the global pandemic on social media has been more nuanced than on other sectors. On the one hand, engagement has increased on platforms on account of the shelter in place measures. But the uptick in engagement has been offset by reduced flow from the platforms’ main revenue source – advertising. Ad budgets have been slashed amid the economic uncertainty. But if any company can withstand the impact, argues Wedbush analyst Michael Pachter, it is the king of social media Facebook (FB).
Yet, ahead of the release of Facebook’s anticipated quarterly statement this evening, the analyst concedes the drop in ad spending across the board will impact Facebook, too.
Pachter lowered estimates for Q1 revenue from $18.539 billion to $17.750 billion to reflect year-over-year growth of 18%, compared to his previous call for growth of 23%. EPS also gets a reduction – from $1.98 to $1.94, along with a haircut to Q1 estimates for EBITDA, down from $8.194 billion to $8.05 billion.
Behind the lowered estimates are some alarming facts concerning the advertising industry. In Q2, digital ad spending in the U.S. is forecast to drop by 33%, according to a March study of U.S. media planners by the Interactive Advertising Bureau. Additionally, spending plans for 2H20 have yet to be formalized by approximately two thirds of the survey’s participants. This spells uncertainty. But despite assuming Facebook’s revenue growth rate for the year will be reduced by half from 22% to 11%, Pachter maintains Facebook has the ammunition to weather the ad headwinds.
The analyst opined, “Facebook has consistently executed on its core business model and we expect the company to capture market share in a declining advertising spend environment, given its scale and robust suite of tools to help advertisers manage costs and maximize budget efficiency.”
To this end, Pachter reiterated an Outperform along with a $250 price target. Investors will be pocketing gains of 37%, should Pachter’s thesis play out in the coming months. (To watch Pachter’s track record, click here)
The rest of the Street maintains a bullish stance, too. Facebook’s Strong Buy consensus rating is based on 36 buys and a Hold and Sell, each. The average price target is $222.41, and implies potential upside of 22%. (See Facebook stock analysis on TipRanks)

To find good ideas for stocks trading at attractive valuations, visit TipRanks’ Best Stocks to Buy, a newly launched tool that unites all of TipRanks’ equity insights.
The post Opinion: Buy or Sell Facebook (FB) Before Earnings? appeared first on TipRanks Financial Blog.
Uncategorized
Airline, travel companies face Chapter 11 bankruptcy, default risk
New data from Creditsafe shows that three big-name brands face significant cash issues.
Share this:


It's actually fairly rare that a company files for Chapter 11 bankruptcy without throwing off signs that it's in deep financial trouble. Observant customers sometimes see the signs.
You might notice lower staffing levels or poor inventory in a retail setting. Restaurants facing financial troubles might drop the quality of their ingredients, cut portion sizes, or find other ways to cut corners.
Related: Fast-food chain closes restaurants after Chapter 11 bankruptcy
It's generally impossible to cut your way to a good financial position unless you were making huge mistakes in the first place. A company might find some savings by examining its operations and focuing on waste in areas customers don't see, but giving people less almost never works.
In many businesses, especially when companies are publicly traded, signs of upcoming financial trouble are obvious.
Public companies have to report their financial results and when there's more money going out than coming in, and cash balances get low, observant analysts can see a company likely to default on its bills that may be headed for bankruptcy well before it happens.
CreditSafe Head of Brand Ragini Bhalla recently shared her company's Financial & Bankruptcy Outlook: Transportation Report and some comments on it with TheStreet.
The report shows that three big-name companies in the travel/transportation space are facing significant financial risk, which is reflected in their stock prices. Bhalla gave some color as to why companies in those markets are struggling.
Image source: Shutterstock
The transportation industry faces a crisis
Bhalla shared her thoughts on what Creditsafe found.
"We are reflecting on the current challenges faced by transportation companies and the total industry outlook. During the pandemic, M&A activity in the industry soared, as transportation players and investors made deals to extend capabilities and acquire high-performing assets. To that end, deal values soared from $51 billion in 2020 to more than $150 billion in 2021, before it dipped to $95 billion in 2022," she said in an email to TheStreet.
Bhalla said she sees a different pattern in 2024.
"While M&A activity in the transportation industry cooled down in 2023, industry insiders are projecting that 2024 will be the year of consolidation. If that’s the case, then it will be more important than ever for both sides (sellers and buyers) to do their due diligence," she wrote.
Not every company that would benefit from being acquired will survive the M&A scrutiny.
"This should include various elements, such as running business credit checks on potential acquisitions to make sure they would be a good investment and aren’t in dire financial straits. It should also include running comprehensive compliance checks to make sure potential acquisitions aren’t violating sanctions, haven’t been convicted of regulatory violations, and aren’t involved in unethical practices like bribery, corruption, fraud, and the use of child/forced labor," she added.
One airline, two rental cars are at risk
Spirit Airlines (SAVE) has been on unofficial bankruptcy watch since the company's merger with JetBlue (JBLU) fell apart. There are real questions as to whether the super-low-cost airline model works, and Creditsafe sees a real risk of the airline ending up filing for Chapter 11 bankruptcy.
"Earlier this year, Spirit Airlines said it was looking to refinance its debt and hopes to refinance $1.1 billion of debt due in 2025," according to Creditsafe. "To make matters worse, the airline doesn’t have a stable track record of paying bills on time."
Not paying bills on time is often a sign that a company is running out of cash.
"Late payments increased over several months in 2023. For example, the number of late payments (1-30 days) rose from 7.00% in September 2023 to 30.87% in October 2023. A similar pattern occurred soon after when the number of late payments (1-30 days) rose from 6.37% in November 2023 to 30.54% in December 2023 and then again to 51.08% in January 2024," Creditsafe data showed.
Investors are shying from the stock. Shares were at $4.29 down 73.8% on the year as of Friday.
Two rental car companies, Avis Budget Group (CAR) and Hertz (HTZ) are facing similar woes.
"Avis Budget Group's long-term debt has consistently increased for the last three years, and how late the company paid its bills spiked drastically from 8 days late in March to 31 days in April and remained high until September 2023," Creditsafe shared.
Hertz has been following a similar path.
"The company’s number of delinquent payments (91+ days) increased consistently during the second half of 2023. For instance, the number of delinquent payments (91+ days) rose from 4.64% in August to 6.90% in September, then rose again to 10.73% in October 2023, indicating it is having trouble paying its bills," according to Creditsafe.
Avis Budget closed Friday at $107.70 and are down 39.2% this year. Hertz finished Friday at $7.58, down 25.7% on the year.
bankruptcy default pandemicUncategorized
Default: San Francisco Four Seasons Hotel Investors $3 Million Late On Loan As Foreclosure Looms
Default: San Francisco Four Seasons Hotel Investors $3 Million Late On Loan As Foreclosure Looms
Westbrook Partners, which acquired the San…
Share this:

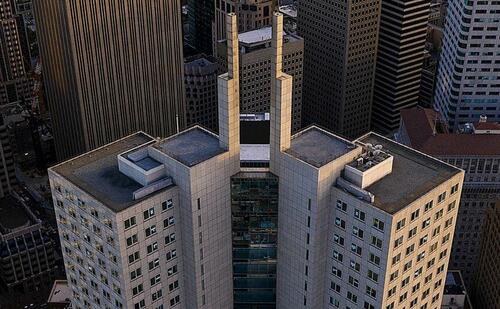
Westbrook Partners, which acquired the San Francisco Four Seasons luxury hotel building, has been served a notice of default, as the developer has failed to make its monthly loan payment since December, and is currently behind by more than $3 million, the San Francisco Business Times reports.
Westbrook, which acquired the property at 345 California Center in 2019, has 90 days to bring their account current with its lender or face foreclosure.
Related
- Fed Fears "Notable" Financial System Vulnerability As Renowned CRE Investor Tells Team 'Stop All NYC Underwriting'
- The State Of Commercial Real Estate, In Charts
- "Who Could Be Next": Top Canadian Pension Fund Sells Manhattan Office Tower For $1, Sparking Firesale Panic
- "Heightened Risks": Goldman Points To Leading CRE Indicator That Shows Pain Train Not Over
As SF Gate notes, downtown San Francisco hotel investors have had a terrible few years - with interest rates higher than their pre-pandemic levels, and local tourism continuing to suffer thanks to the city's legendary mismanagement that has resulted in overlapping drug, crime, and homelessness crises (which SF Gate characterizes as "a negative media narrative).
Last summer, the owner of San Francisco’s Hilton Union Square and Parc 55 hotels abandoned its loan in the first major default. Industry insiders speculate that loan defaults like this may become more common given the difficult period for investors.
At a visitor impact summit in August, a senior director of hospitality analytics for the CoStar Group reported that there are 22 active commercial mortgage-backed securities loans for hotels in San Francisco maturing in the next two years. Of these hotel loans, 17 are on CoStar’s “watchlist,” as they are at a higher risk of default, the analyst said. -SF Gate
The 155-room Four Seasons San Francisco at Embarcadero currenly occupies the top 11 floors of the iconic skyscrper. After slow renovations, the hotel officially reopened in the summer of 2021.
"Regarding the landscape of the hotel community in San Francisco, the short term is a challenging situation due to high interest rates, fewer guests compared to pre-pandemic and the relatively high costs attached with doing business here," Alex Bastian, President and CEO of the Hotel Council of San Francisco, told SFGATE.
Heightened Risks
In January, the owner of the Hilton Financial District at 750 Kearny St. - Portsmouth Square's affiliate Justice Operating Company - defaulted on the property, which had a $97 million loan on the 544-room hotel taken out in 2013. The company says it proposed a loan modification agreement which was under review by the servicer, LNR Partners.
Meanwhile last year Park Hotels & Resorts gave up ownership of two properties, Parc 55 and Hilton Union Square - which were transferred to a receiver that assumed management.
In the third quarter of 2023, the most recent data available, the Hilton Financial District reported $11.1 million in revenue, down from $12.3 million from the third quarter of 2022. The hotel had a net operating loss of $1.56 million in the most recent third quarter.
Occupancy fell to 88% with an average daily rate of $218 in the third quarter compared with 94% and $230 in the same period of 2022. -SF Chronicle
According to the Chronicle, San Francisco's 2024 convention calendar is lighter than it was last year - in part due to key events leaving the city for cheaper, less crime-ridden places like Las Vegas.
Uncategorized
Correcting the Washington Post’s 11 Charts That Are Supposed to Tell Us How the Economy Changed Since Covid
The Washington Post made some serious errors or omissions in its 11 charts that are supposed to tell us how Covid changed the economy. Wages Starting with…
Share this:

The Washington Post made some serious errors or omissions in its 11 charts that are supposed to tell us how Covid changed the economy.
Wages
Starting with its second chart, the article gives us an index of average weekly wages since 2019. The index shows a big jump in 2020, which then falls off in 2021 and 2022, before rising again in 2023.
It tells readers:
“Many Americans got large pay increases after the pandemic, when employers were having to one-up each other to find and keep workers. For a while, those wage gains were wiped out by decade-high inflation: Workers were getting larger paychecks, but it wasn’t enough to keep up with rising prices.”
That actually is not what its chart shows. The big rise in average weekly wages at the start of the pandemic was not the result of workers getting pay increases, it was the result of low-paid workers in sectors like hotels and restaurants losing their jobs.
The number of people employed in the low-paying leisure and hospitality sector fell by more than 8 million at the start of the pandemic. Even at the start of 2021 it was still down by over 4 million.
Laying off low-paid workers raises average wages in the same way that getting the short people to leave raises the average height of the people in the room. The Washington Post might try to tell us that the remaining people grew taller, but that is not what happened.
The other problem with this chart is that it is giving us weekly wages. The length of the average workweek jumped at the start of the pandemic as employers decided to work the workers they had longer hours rather than hire more workers. In January of 2021 the average workweek was 34.9 hours, compared to 34.4 hours in 2019 and 34.3 hours in February.
This increase in hours, by itself, would raise weekly pay by 2.0 percent. As hours returned to normal in 2022, this measure would misleadingly imply that wages were falling.
It is also worth noting that the fastest wage gains since the pandemic have been at the bottom end of the wage distribution and the Black/white wage gap has fallen to its lowest level on record.
Saving Rates
The third chart shows the saving rate since 2019. It shows a big spike at the start of the pandemic, as people stopped spending on things like restaurants and travel and they got pandemic checks from the government. It then falls sharply in 2022 and is lower in the most recent quarters than in 2019.
The piece tells readers:
“But as the world reopened — and people resumed spending on dining out, travel, concerts and other things that were previously off-limits — savings rates have leveled off. Americans are also increasingly dip into rainy-day funds to pay more for necessities, including groceries, housing, education and health care. In fact, Americans are now generally saving less of their incomes than they were before the pandemic.
This is an incomplete picture due to a somewhat technical issue. As I explained in a blogpost a few months ago, there is an unusually large gap between GDP as measured on the output side and GDP measured on the income side. In principle, these two numbers should be the same, but they never come out exactly equal.
In recent quarters, the gap has been 2.5 percent of GDP. This is extraordinarily large, but it also is unusual in that the output side is higher than the income side, the opposite of the standard pattern over the last quarter century.
It is standard for economists to assume that the true number for GDP is somewhere between the two measures. If we make that assumption about the data for 2023, it would imply that income is somewhat higher than the data now show and consumption somewhat lower.
In that story, as I showed in the blogpost, the saving rate for 2023 would be 6.8 percent of disposable income, roughly the same as the average for the three years before the pandemic. This would mean that people are not dipping into their rainy-day funds as the Post tells us. They are spending pretty much as they did before the pandemic.
Credit Card Debt
The next graph shows that credit card debt is rising again, after sinking in the pandemic. The piece tells readers:
“But now, debt loads are swinging higher again as families try to keep up with rising prices. Total household debt reached a record $17.5 trillion at the end of 2023, according to the Federal Reserve Bank of New York. And, in a worrisome sign for the economy, delinquency rates on mortgages, car loans and credit cards are all rising, too.”
There are several points worth noting here. Credit card debt is rising, but measured relative to income it is still below where it was before the pandemic. It was 6.7 percent of disposable income at the end of 2019, compared to 6.5 percent at the end of last year.
The second point is that a major reason for the recent surge in credit card debt is that people are no longer refinancing mortgages. There was a massive surge in mortgage refinancing with the low interest rates in 2020-2021.
Many of the people who refinanced took additional money out, taking advantage of the increased equity in their home. This channel of credit was cut off when mortgage rates jumped in 2022 and virtually ended mortgage refinancing. This means that to a large extent the surge in credit card borrowing is simply a shift from mortgage debt to credit card debt.
The point about total household debt hitting a record can be said in most months. Except in the period immediately following the collapse of the housing bubble, total debt is almost always rising.
And the rise in delinquencies simply reflects the fact that they had been at very low levels in 2021 and 2022. For the most part, delinquency rates are just getting back to their pre-pandemic levels, which were historically low.
Grocery Prices and Gas Prices
The next two charts show the patterns in grocery prices and gas prices since the pandemic. It would have been worth mentioning that every major economy in the world saw similar run-ups in prices in these two areas. In other words, there was nothing specific to U.S. policy that led to a surge in inflation here.
The Missing Charts
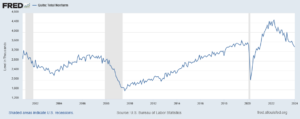
There are several areas where it would have been interesting to see charts which the Post did not include. It would have been useful to have a chart on job quitters, the number of people who voluntarily quit their jobs during the pandemic. In the tight labor markets of 2021 and 2022 the number of workers who left jobs they didn’t like soared to record levels, as shown below.
The vast majority of these workers took other jobs that they liked better. This likely explains another item that could appear as a graph, the record level of job satisfaction.
In a similar vein there has been an explosion in the number of people who work from home at least part-time. This has increased by more than 17 million during the pandemic. These workers are saving themselves thousands of dollars a year on commuting costs and related expenses, as well as hundreds of hours spent commuting.
Finally, there has been an explosion in the use of telemedicine since the pandemic. At the peak, nearly one in four visits with a health care professional was a remote consultation. This saved many people with serious health issues the time and inconvenience associated with a trip to a hospital or doctor’s office. The increased use of telemedicine is likely to be a lasting gain from the pandemic.
The World Has Changed
The pandemic will likely have a lasting impact on the economy and society. The Washington Post’s charts captured part of this story, but in some cases misrepr
The post Correcting the Washington Post’s 11 Charts That Are Supposed to Tell Us How the Economy Changed Since Covid appeared first on Center for Economic and Policy Research.
federal reserve pandemic mortgage rates gdp interest rates

Women’s basketball is gaining ground, but is March Madness ready to rival the men’s game?


Default: San Francisco Four Seasons Hotel Investors $3 Million Late On Loan As Foreclosure Looms


Correcting the Washington Post’s 11 Charts That Are Supposed to Tell Us How the Economy Changed Since Covid


Airline, travel companies face Chapter 11 bankruptcy, default risk
-

 Uncategorized4 weeks ago
All Of The Elements Are In Place For An Economic Crisis Of Staggering Proportions
-

 International1 week ago
EyePoint poaches medical chief from Apellis; Sandoz CFO, longtime BioNTech exec to retire
-

 Spread & Containment5 days ago
IFM’s Hat Trick and Reflections On Option-To-Buy M&A
-

 Uncategorized1 month ago
California Counties Could Be Forced To Pay $300 Million To Cover COVID-Era Program
-

 Uncategorized3 weeks ago
Apparel Retailer Express Moving Toward Bankruptcy
-

 Uncategorized1 month ago
Industrial Production Decreased 0.1% in January
-

 International1 week ago
Walmart launches clever answer to Target’s new membership program
-

 Uncategorized1 month ago
RFK Jr: The Wuhan Cover-Up & The Rise Of The Biowarfare-Industrial Complex