Connect with us

Uncategorized

New technique reveals changing shapes of magnetic noise in space and time

Electromagnetic noise poses a major problem for communications, prompting wireless carriers to invest heavily in technologies to overcome it. But for a…

Published

on

Electromagnetic noise poses a major problem for communications, prompting wireless carriers to invest heavily in technologies to overcome it. But for a team of scientists exploring the atomic realm, measuring tiny fluctuations in noise could hold the key to discovery.

Credit: David Kelly Crow

Electromagnetic noise poses a major problem for communications, prompting wireless carriers to invest heavily in technologies to overcome it. But for a team of scientists exploring the atomic realm, measuring tiny fluctuations in noise could hold the key to discovery.

“Noise is usually thought of as a nuisance, but physicists can learn many things by studying noise,” said Nathalie de Leon, an associate professor of electrical and computer engineering at Princeton University. “By measuring the noise in a material, they can learn its composition, its temperature, how electrons flow and interact with one another, and how spins order to form magnets. It is generally difficult to measure anything about how the noise changes in space or time.”

Using specially designed diamonds, a team of researchers at Princeton and the University of Wisconsin-Madison have developed a technique to measure noise in a material by studying correlations, and they can use this information to learn the spatial structure and time-varying nature of the noise. This technique, which relies on tracking tiny fluctuations in magnetic fields, represents a stark improvement over previous methods that averaged many separate measurements.

De Leon is a leader in the fabrication and use of highly controlled diamond structures called nitrogen-vacancy (NV) centers. These NV centers are modifications to a diamond’s lattice of carbon atoms in which a carbon is replaced by a nitrogen atom, and adjacent to it is an empty space, or vacancy, in the molecular structure. Diamonds with NV centers are one of the few tools that can measure changes in magnetic fields at the scale and speed needed for critical experiments in quantum technology and condensed matter physics.

While a single NV center allowed scientists to take detailed readings of magnetic fields, it was only when de Leon’s team worked out a method to harness multiple NV centers simultaneously that they were able to measure the spatial structure of noise in a material. This opens the door to understanding the properties of materials with bizarre quantum behaviors that until now have been analyzed only theoretically, said de Leon, the senior author of a paper describing the technique published online Dec. 22 in the journal Science.

“It’s a fundamentally new technique,” said de Leon. “It’s been clear from a theoretical perspective that it would be very powerful to be able to do this. The audience that I think is most excited about this work is condensed matter theorists, now that there’s this whole world of phenomena they might be able to characterize in a different way.”

One of these phenomena is a quantum spin liquid, a material first explored in theories nearly 50 years ago that has been difficult to characterize experimentally. In a quantum spin liquid, electrons are constantly in flux, in contrast to the solid-state stability that characterizes a typical magnetic material when cooled to a certain temperature.

“The challenging thing about a quantum spin liquid is that by definition there’s no static magnetic ordering, so you can’t just map out a magnetic field” the way you would with another type of material, said de Leon. “Until now there’s been essentially no way to directly measure these two-point magnetic field correlators, and what people have instead been doing is trying to find complicated proxies for that measurement.”

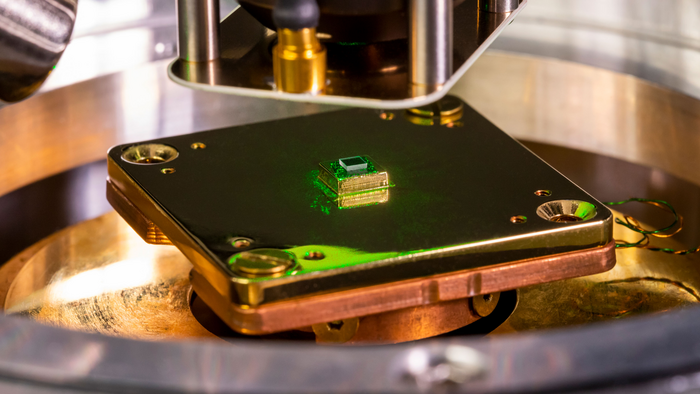
By simultaneously measuring magnetic fields at multiple points with diamond sensors, researchers can detect how electrons and their spins are moving across space and time in a material. In developing the new method, the team applied calibrated laser pulses to a diamond containing NV centers, and then detected two spikes of photon counts from a pair of NV centers — a readout of the electron spins at each center at the same point in time. Previous techniques would have taken an average of these measurements, discarding valuable information and making it impossible to distinguish the intrinsic noise of the diamond and its environment from the magnetic field signals generated by a material of interest.

“One of those two spikes is a signal we’re applying, the other is a spike from the local environment, and there’s no way to tell the difference,” said study coauthor Shimon Kolkowitz, an associate professor of physics at the University of Wisconsin-Madison. “But when we look at the correlations, the one that is correlated is from the signal we’re applying and the other is not. And we can measure that, which is something people couldn’t measure before.”

Kolkowitz and de Leon met as Ph.D. students at Harvard University, and have been in touch frequently since then. Their research collaboration arose early in the COVID-19 pandemic, when laboratory research slowed, but long-distance collaboration became more attractive as most interactions took place over Zoom, said de Leon.

Jared Rovny, the study’s lead author and a postdoctoral research associate in de Leon’s group, led both the theoretical and experimental work on the new method. Contributions by Kolkowitz and his team were critical to designing the experiments and understanding the data, said de Leon. The paper’s coauthors also included Ahmed Abdalla and Laura Futamura, who conducted summer research with de Leon’s team in 2021 and 2022, respectively, as interns in the Quantum Undergraduate Research at IBM and Princeton (QURIP) program, which de Leon cofounded in 2019.

The article, Nanoscale covariance magnetometry with diamond quantum sensors, was published online Dec. 22 in Science. Other coauthors were Zhiyang Yuan, a Ph.D. student at Princeton; Mattias Fitzpatrick, who earned a Ph.D. at Princeton in 2019 and was a postdoctoral research fellow in de Leon’s group (now an assistant professor at Dartmouth’s Thayer School of Engineering); and Carter Fox and Matthew Carl Cambria of the University of Wisconsin-Madison. Support for the research was provided in part by the U.S. National Science Foundation, the U.S. Department of Energy, the Princeton Catalysis Initiative and the Princeton Quantum Initiative.

The University of Wisconsin-Madison’s Department of Physics contributed to this article.


Read More

Continue Reading

Uncategorized

Airline, travel companies face Chapter 11 bankruptcy, default risk

New data from Creditsafe shows that three big-name brands face significant cash issues.

Published

on

It's actually fairly rare that a company files for Chapter 11 bankruptcy without throwing off signs that it's in deep financial trouble. Observant customers sometimes see the signs.

You might notice lower staffing levels or poor inventory in a retail setting. Restaurants facing financial troubles might drop the quality of their ingredients, cut portion sizes, or find other ways to cut corners.

Related: Fast-food chain closes restaurants after Chapter 11 bankruptcy

It's generally impossible to cut your way to a good financial position unless you were making huge mistakes in the first place. A company might find some savings by examining its operations and focuing on waste in areas customers don't see, but giving people less almost never works.

In many businesses, especially when companies are publicly traded, signs of upcoming financial trouble are obvious. 

Public companies have to report their financial results and when there's more money going out than coming in, and cash balances get low, observant analysts can see a company likely to default on its bills that may be headed for bankruptcy well before it happens.

CreditSafe Head of Brand Ragini Bhalla recently shared her company's Financial & Bankruptcy Outlook: Transportation Report and some comments on it with TheStreet. 

The report shows that three big-name companies in the travel/transportation space are facing significant financial risk, which is reflected in their stock prices. Bhalla gave some color as to why companies in those markets are struggling.

Air travel has bounced back from the covid pandemic.

Image source: Shutterstock

The transportation industry faces a crisis  

Bhalla shared her thoughts on what Creditsafe found.

"We are reflecting on the current challenges faced by transportation companies and the total industry outlook. During the pandemic, M&A activity in the industry soared, as transportation players and investors made deals to extend capabilities and acquire high-performing assets. To that end, deal values soared from $51 billion in 2020 to more than $150 billion in 2021, before it dipped to $95 billion in 2022," she said in an email to TheStreet.

Bhalla said she sees a different pattern in 2024.

"While M&A activity in the transportation industry cooled down in 2023, industry insiders are projecting that 2024 will be the year of consolidation. If that’s the case, then it will be more important than ever for both sides (sellers and buyers) to do their due diligence," she wrote.

Not every company that would benefit from being acquired will survive the M&A scrutiny.

"This should include various elements, such as running business credit checks on potential acquisitions to make sure they would be a good investment and aren’t in dire financial straits. It should also include running comprehensive compliance checks to make sure potential acquisitions aren’t violating sanctions, haven’t been convicted of regulatory violations, and aren’t involved in unethical practices like bribery, corruption, fraud, and the use of child/forced labor," she added.

One airline, two rental cars are at risk

Spirit Airlines  (SAVE) has been on unofficial bankruptcy watch since the company's merger with JetBlue  (JBLU)  fell apart. There are real questions as to whether the super-low-cost airline model works, and Creditsafe sees a real risk of the airline ending up filing for Chapter 11 bankruptcy.

"Earlier this year, Spirit Airlines said it was looking to refinance its debt and hopes to refinance $1.1 billion of debt due in 2025," according to Creditsafe. "To make matters worse, the airline doesn’t have a stable track record of paying bills on time."

Not paying bills on time is often a sign that a company is running out of cash.

"Late payments increased over several months in 2023. For example, the number of late payments (1-30 days) rose from 7.00% in September 2023 to 30.87% in October 2023. A similar pattern occurred soon after when the number of late payments (1-30 days) rose from 6.37% in November 2023 to 30.54% in December 2023 and then again to 51.08% in January 2024," Creditsafe data showed.

Investors are shying from the stock. Shares were at $4.29 down 73.8% on the year as of Friday.

Two rental car companies, Avis Budget Group  (CAR) and Hertz (HTZ) are facing similar woes.

"Avis Budget Group's long-term debt has consistently increased for the last three years, and how late the company paid its bills spiked drastically from 8 days late in March to 31 days in April and remained high until September 2023," Creditsafe shared.

Hertz has been following a similar path.

"The company’s number of delinquent payments (91+ days) increased consistently during the second half of 2023. For instance, the number of delinquent payments (91+ days) rose from 4.64% in August to 6.90% in September, then rose again to 10.73% in October 2023, indicating it is having trouble paying its bills," according to Creditsafe.

Avis Budget closed Friday at $107.70 and are down 39.2% this year. Hertz finished Friday at $7.58, down 25.7% on the year.

Read More

Continue Reading

Uncategorized

Default: San Francisco Four Seasons Hotel Investors $3 Million Late On Loan As Foreclosure Looms

Default: San Francisco Four Seasons Hotel Investors $3 Million Late On Loan As Foreclosure Looms

Westbrook Partners, which acquired the San…

Published

on

Default: San Francisco Four Seasons Hotel Investors $3 Million Late On Loan As Foreclosure Looms

Westbrook Partners, which acquired the San Francisco Four Seasons luxury hotel building, has been served a notice of default, as the developer has failed to make its monthly loan payment since December, and is currently behind by more than $3 million, the San Francisco Business Times reports.

Westbrook, which acquired the property at 345 California Center in 2019, has 90 days to bring their account current with its lender or face foreclosure.

Related

As SF Gate notes, downtown San Francisco hotel investors have had a terrible few years - with interest rates higher than their pre-pandemic levels, and local tourism continuing to suffer thanks to the city's legendary mismanagement that has resulted in overlapping drug, crime, and homelessness crises (which SF Gate characterizes as "a negative media narrative).

Last summer, the owner of San Francisco’s Hilton Union Square and Parc 55 hotels abandoned its loan in the first major default. Industry insiders speculate that loan defaults like this may become more common given the difficult period for investors.

At a visitor impact summit in August, a senior director of hospitality analytics for the CoStar Group reported that there are 22 active commercial mortgage-backed securities loans for hotels in San Francisco maturing in the next two years. Of these hotel loans, 17 are on CoStar’s “watchlist,” as they are at a higher risk of default, the analyst said. -SF Gate

The 155-room Four Seasons San Francisco at Embarcadero currenly occupies the top 11 floors of the iconic skyscrper. After slow renovations, the hotel officially reopened in the summer of 2021.

"Regarding the landscape of the hotel community in San Francisco, the short term is a challenging situation due to high interest rates, fewer guests compared to pre-pandemic and the relatively high costs attached with doing business here," Alex Bastian, President and CEO of the Hotel Council of San Francisco, told SFGATE.

Heightened Risks

In January, the owner of the Hilton Financial District at 750 Kearny St. - Portsmouth Square's affiliate Justice Operating Company - defaulted on the property, which had a $97 million loan on the 544-room hotel taken out in 2013. The company says it proposed a loan modification agreement which was under review by the servicer, LNR Partners.

Meanwhile last year Park Hotels & Resorts gave up ownership of two properties, Parc 55 and Hilton Union Square - which were transferred to a receiver that assumed management.

In the third quarter of 2023, the most recent data available, the Hilton Financial District reported $11.1 million in revenue, down from $12.3 million from the third quarter of 2022. The hotel had a net operating loss of $1.56 million in the most recent third quarter.

Occupancy fell to 88% with an average daily rate of $218 in the third quarter compared with 94% and $230 in the same period of 2022. -SF Chronicle

According to the Chronicle, San Francisco's 2024 convention calendar is lighter than it was last year - in part due to key events leaving the city for cheaper, less crime-ridden places like Las Vegas

Tyler Durden Sun, 03/17/2024 - 18:05

Read More

Continue Reading

Uncategorized

Correcting the Washington Post’s 11 Charts That Are Supposed to Tell Us How the Economy Changed Since Covid

The Washington Post made some serious errors or omissions in its 11 charts that are supposed to tell us how Covid changed the economy. Wages Starting with…

Published

on

The Washington Post made some serious errors or omissions in its 11 charts that are supposed to tell us how Covid changed the economy.

Wages

Starting with its second chart, the article gives us an index of average weekly wages since 2019. The index shows a big jump in 2020, which then falls off in 2021 and 2022, before rising again in 2023.

It tells readers:

“Many Americans got large pay increases after the pandemic, when employers were having to one-up each other to find and keep workers. For a while, those wage gains were wiped out by decade-high inflation: Workers were getting larger paychecks, but it wasn’t enough to keep up with rising prices.”

That actually is not what its chart shows. The big rise in average weekly wages at the start of the pandemic was not the result of workers getting pay increases, it was the result of low-paid workers in sectors like hotels and restaurants losing their jobs.

The number of people employed in the low-paying leisure and hospitality sector fell by more than 8 million at the start of the pandemic. Even at the start of 2021 it was still down by over 4 million.

Laying off low-paid workers raises average wages in the same way that getting the short people to leave raises the average height of the people in the room. The Washington Post might try to tell us that the remaining people grew taller, but that is not what happened.

The other problem with this chart is that it is giving us weekly wages. The length of the average workweek jumped at the start of the pandemic as employers decided to work the workers they had longer hours rather than hire more workers. In January of 2021 the average workweek was 34.9 hours, compared to 34.4 hours in 2019 and 34.3 hours in February.

This increase in hours, by itself, would raise weekly pay by 2.0 percent. As hours returned to normal in 2022, this measure would misleadingly imply that wages were falling.

It is also worth noting that the fastest wage gains since the pandemic have been at the bottom end of the wage distribution and the Black/white wage gap has fallen to its lowest level on record.

Saving Rates

The third chart shows the saving rate since 2019. It shows a big spike at the start of the pandemic, as people stopped spending on things like restaurants and travel and they got pandemic checks from the government. It then falls sharply in 2022 and is lower in the most recent quarters than in 2019.

The piece tells readers:

“But as the world reopened — and people resumed spending on dining out, travel, concerts and other things that were previously off-limits — savings rates have leveled off. Americans are also increasingly dip into rainy-day funds to pay more for necessities, including groceries, housing, education and health care. In fact, Americans are now generally saving less of their incomes than they were before the pandemic.

This is an incomplete picture due to a somewhat technical issue. As I explained in a blogpost a few months ago, there is an unusually large gap between GDP as measured on the output side and GDP measured on the income side. In principle, these two numbers should be the same, but they never come out exactly equal.

In recent quarters, the gap has been 2.5 percent of GDP. This is extraordinarily large, but it also is unusual in that the output side is higher than the income side, the opposite of the standard pattern over the last quarter century.

It is standard for economists to assume that the true number for GDP is somewhere between the two measures. If we make that assumption about the data for 2023, it would imply that income is somewhat higher than the data now show and consumption somewhat lower.

In that story, as I showed in the blogpost, the saving rate for 2023 would be 6.8 percent of disposable income, roughly the same as the average for the three years before the pandemic. This would mean that people are not dipping into their rainy-day funds as the Post tells us. They are spending pretty much as they did before the pandemic.


Credit Card Debt

The next graph shows that credit card debt is rising again, after sinking in the pandemic. The piece tells readers:

“But now, debt loads are swinging higher again as families try to keep up with rising prices. Total household debt reached a record $17.5 trillion at the end of 2023, according to the Federal Reserve Bank of New York. And, in a worrisome sign for the economy, delinquency rates on mortgages, car loans and credit cards are all rising, too.”

There are several points worth noting here. Credit card debt is rising, but measured relative to income it is still below where it was before the pandemic. It was 6.7 percent of disposable income at the end of 2019, compared to 6.5 percent at the end of last year.

The second point is that a major reason for the recent surge in credit card debt is that people are no longer refinancing mortgages. There was a massive surge in mortgage refinancing with the low interest rates in 2020-2021.

Many of the people who refinanced took additional money out, taking advantage of the increased equity in their home. This channel of credit was cut off when mortgage rates jumped in 2022 and virtually ended mortgage refinancing. This means that to a large extent the surge in credit card borrowing is simply a shift from mortgage debt to credit card debt.

The point about total household debt hitting a record can be said in most months. Except in the period immediately following the collapse of the housing bubble, total debt is almost always rising.

And the rise in delinquencies simply reflects the fact that they had been at very low levels in 2021 and 2022. For the most part, delinquency rates are just getting back to their pre-pandemic levels, which were historically low.  


Grocery Prices and Gas Prices

The next two charts show the patterns in grocery prices and gas prices since the pandemic. It would have been worth mentioning that every major economy in the world saw similar run-ups in prices in these two areas. In other words, there was nothing specific to U.S. policy that led to a surge in inflation here.


The Missing Charts

There are several areas where it would have been interesting to see charts which the Post did not include. It would have been useful to have a chart on job quitters, the number of people who voluntarily quit their jobs during the pandemic. In the tight labor markets of 2021 and 2022 the number of workers who left jobs they didn’t like soared to record levels, as shown below.


The vast majority of these workers took other jobs that they liked better. This likely explains another item that could appear as a graph, the record level of job satisfaction.

In a similar vein there has been an explosion in the number of people who work from home at least part-time. This has increased by more than 17 million during the pandemic. These workers are saving themselves thousands of dollars a year on commuting costs and related expenses, as well as hundreds of hours spent commuting.

Finally, there has been an explosion in the use of telemedicine since the pandemic. At the peak, nearly one in four visits with a health care professional was a remote consultation. This saved many people with serious health issues the time and inconvenience associated with a trip to a hospital or doctor’s office. The increased use of telemedicine is likely to be a lasting gain from the pandemic.


The World Has Changed

The pandemic will likely have a lasting impact on the economy and society. The Washington Post’s charts captured part of this story, but in some cases misrepr

The post Correcting the Washington Post’s 11 Charts That Are Supposed to Tell Us How the Economy Changed Since Covid appeared first on Center for Economic and Policy Research.

Read More

Continue Reading

Trending