Uncategorized
New Pacific Intersects 505 Metres Grading 1.22 Grams Per Tonne Gold at the Carangas Project, Bolivia
New Pacific Intersects 505 Metres Grading 1.22 Grams Per Tonne Gold at the Carangas Project, Bolivia
PR Newswire
VANCOUVER, BC, Jan. 24, 2023
VANCOUVER, BC, Jan. 24, 2023 /PRNewswire/ – New Pacific Metals Corp. (“New Pacific” or the “Company”) (TS…
Share this:

New Pacific Intersects 505 Metres Grading 1.22 Grams Per Tonne Gold at the Carangas Project, Bolivia
PR Newswire
VANCOUVER, BC, Jan. 24, 2023
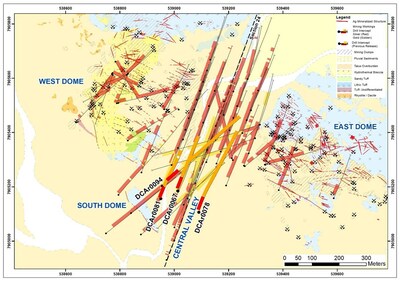
VANCOUVER, BC, Jan. 24, 2023 /PRNewswire/ - New Pacific Metals Corp. ("New Pacific" or the "Company") (TSX: NUAG) (NYSE: NEWP), together with its local Bolivian partner, report assay results for four deep drill holes at its Carangas Silver-Gold Project, Oruro Department, Bolivia (the "Carangas Project" or the "Project"). These deep step-out holes were drilled south of the previous gold intercepts. At Carangas, thick gold mineralization occurs beneath a shallow silver horizon measuring approximately 1,000 metres ("m") long, 800 m wide and up to 200 m thick. Detailed results and drill hole specifications are provided in Tables 1 and 2, as well as Figure 1.
A total of 50,368 m was drilled in 115 holes at the Carangas Project in 2022. Assay results from 43 of these holes have been received and released to date, while the results of the remaining 72 drill holes are pending. Since June 2021, a total of 63,578 m in 150 holes has been drilled at the Carangas Project.
Hole DCAr0094 intersected, from 228.5 m to 733.12 m, a 504.62 m gold interval grading 1.22 grams per tonne ("g/t") gold ("Au") and 13 g/t silver ("Ag"), including a 124.69 m higher grade interval (from 479.46 m to 604.15 m) grading 2.77 g/t Au, 14 g/t Ag and 0.11% copper ("Cu"), including a 44.73 m sub-interval (from 559.42 m to 604.15 m) grading 5.03 g/t Au, 19 g/t Ag and 0.16% Cu. The hole also intersected, from 47.65 m to 149.23 m, a 101.58 m silver interval grading 64 g/t silver equivalent ("AgEq"), comprising 18 g/t Ag, 0.2%Pb, and 0.85% Zn.
Hole DCAr0067 intersected, from 24.27 m to 166.0 m, a 141.73 m silver interval grading 119 g/t AgEq, comprising 67 g/t Ag, 0.43% Pb and 1.03% Zn, including a 24.38 m interval (from 62.15 m to 86.53 m) grading 331 g/t AgEq, comprising 251 g/t Ag, 0.69% Pb and 1.66 Zn%. From 171.34 m to 685.0 m, the hole intersected a 513.66 m gold interval grading 0.72 g/t Au and 7 g/t Ag, including a 112.11 m interval (from 450.42 m to 562.53) grading 1.82 g/t Au and 9 g/t Ag. This hole was terminated in gold mineralization at 688 m depth due to down hole drill difficulties.
Hole DCAr0078 intersected, from 24.2 m to 174.4 m, a 150.20 m silver interval grading 45 g/t AgEq, comprising 12 g/t Ag, 0.22% Pb and 0.69% Zn, and, from 179.3 m to 848 m, a 668.7 m gold interval grading 0.48 g/t Au, 5 g/t Ag and 0.22% Zn. This hole is collared in the southern portion of the Central Valley, about 110 m to the southeast of hole DCAr0067.
Hole DCAr0081 intersected, from 4.93 m to 136.72 m, a 131.79 m silver interval grading 93 g/t AgEq, comprising 42 g/t Ag, 0.51% Pb and 0.95% Zn, and, from 141.5 m to 545.75 m, a 404.25 m gold interval grading 0.42 g/t Au, 7 g/t Ag, 0.18% Pb and 0.45% Zn, and, from 579.2 m to 664.74 m, a second gold interval of 85.54 m grading 0.65 g/t Au, 6 g/t Ag and 0.1% Cu.
The Company plans to drill 15,000 m during the first quarter of 2023 at Carangas to test the eastern extension of gold mineralization beneath the East Dome and expand parts of the shallow silver horizon. Following this drill program, an inaugural resource estimate is planned in the second quarter of 2023.
Table 1 Summary of Drill Intercepts | ||||||||||
Hole_ID | Depth_from | Depth_to | Interval_m | Ag_g/t | Au_g/t | Pb_% | Zn_% | Cu_% | AgEq_g/t | |
DCAr0067 | 24.27 | 166.00 | 141.73 | 67 | 0.03 | 0.43 | 1.03 | 0.03 | 119 | |
incl. | 62.15 | 86.53 | 24.38 | 251 | 0.02 | 0.69 | 1.66 | 0.03 | 331 | |
171.34 | 685.00 | 513.66 | 7 | 0.72 | 0.07 | 0.07 | 0.05 | 68 | ||
incl. | 450.42 | 562.53 | 112.11 | 9 | 1.82 | 0.04 | 0.03 | 0.07 | 148 | |
DCAr0078 | 24.20 | 174.40 | 150.20 | 12 | 0.02 | 0.22 | 0.69 | 0.02 | 45 | |
179.30 | 848.00 | 668.70 | 5 | 0.48 | 0.09 | 0.22 | 0.05 | 54 | ||
DCAr0081 | 4.93 | 136.72 | 131.79 | 42 | 0.02 | 0.51 | 0.95 | 0.02 | 93 | |
141.50 | 545.75 | 404.25 | 7 | 0.42 | 0.18 | 0.45 | 0.03 | 60 | ||
579.20 | 664.74 | 85.54 | 6 | 0.65 | 0.01 | 0.05 | 0.10 | 64 | ||
DCAr0094 | 47.65 | 149.23 | 101.58 | 18 | 0.07 | 0.20 | 0.85 | 0.06 | 64 | |
228.50 | 733.12 | 504.62 | 13 | 1.22 | 0.08 | 0.07 | 0.06 | 110 | ||
incl. | 479.46 | 604.15 | 124.69 | 14 | 2.77 | 0.05 | 0.01 | 0.11 | 224 | |
incl. | 559.42 | 604.15 | 44.73 | 19 | 5.03 | 0.03 | 0.01 | 0.16 | 395 | |
Notes: | |
Figure 1 Simplified Geology and Drill Plan Map of Carangas
Table 2 Summary of Drill Holes of Carangas Project | ||||||||
Hole_ID | Easting | Northing | Altitude | Depth_m | Azimuth (°) | Dip (°) | Date_completion | Target |
DCAr0067 | 539013.65 | 7905184.23 | 3905.17 | 688.00 | 20 | -70 | 8/5/2022 | CV |
DCAr0078 | 539093.76 | 7905104.69 | 3905.74 | 848.00 | 20 | -70 | 8/28/2022 | CV |
DCAr0081 | 538950.83 | 7905156.27 | 3904.67 | 1004.00 | 20 | -70 | 8/29/2022 | CV |
DCAr0094 | 538957.18 | 7905202.16 | 3905.03 | 800.00 | 49 | -55 | 9/20/2022 | CV |
Note: | 1. Drill collar coordinate system is WGS1984 UTM Zone 19S | |||||||
2. Coordinate of drill collar is picked with Real Time Kinematics (RTK) GPS | ||||||||
3. CV - Central Valley; WD - West Dome; ED - East Dome | ||||||||
The Company maintains tight sample security and QA/QC for all aspects of its exploration program at the Carangas Project. Drill core is logged, photographed and split on-site by the company and stored under secure conditions until being shipped in security-sealed bags by New Pacific staff in Company vehicles, directly from the project to ALS Global in Oruro, Bolivia for preparation, and ALS Global in Lima, Peru for geochemical analysis. ALS Global is an ISO 17025 accredited laboratory independent from New Pacific. All samples are first analyzed by a multi-element ICP package (ALS code ME-MS41) with ore grade specified limits for silver, lead, and zinc, further analyzed using ALS code OG46. Further silver samples over specified limits are analyzed by gravimetric analysis (ALS code of GRA21). Gold is assayed first by ICP and then by fire assay with AAS finish (ALS code of Au-AA25). Certified reference materials, various types of blank samples and duplicate samples are inserted into normal drill core sample sequences prior to delivery to the laboratory for preparation and analysis. The overall ratio of quality control samples in sample sequences is around twenty percent.
The scientific and technical information contained in this news release has been reviewed and approved by Alex Zhang, P. Geo., Vice President of Exploration, who is a Qualified Person for the purposes of National Instrument 43-101 — Standards of Disclosure for Mineral Projects ("NI 43-101"). The Qualified Person has verified the information disclosed herein using standard verification processes, including the sampling, preparation, security and analytical procedures underlying such information, and is not aware of any significant risks and uncertainties or any limitations on the verification process that could be expected to affect the reliability or confidence in the information discussed herein.
New Pacific is a Canadian exploration and development company with precious metal projects in Bolivia. The Company's flagship Project, the Silver Sand Silver Project, has released its inaugural PEA study in January 2023. The PEA study shows a post-tax NPV (5% discount) of US$726 millions and IRR 39%, underpinned by a total silver production of 171 million ounces in 14 years of mine life. At the recently discovered Carangas Silver-Gold Project, a resource drilling program of more than 50,000 meters was completed in 2022. The third project, the Silverstrike Silver-Gold Project, had a 6,000 m discovery drill program ongoing since June 2022.
For further information, please contact:
New Pacific Metals Corp.
Phone: (604) 633-1368 Ext. 222
U.S. & Canada toll-free: 1-877-631-0593
E-mail: invest@newpacificmetals.com
For additional information and to receive company news by e-mail, please register using New Pacific's website at www.newpacificmetals.com.
Certain of the statements and information in this news release constitute "forward-looking statements" within the meaning of the United States Private Securities Litigation Reform Act of 1995 and "forward-looking information" within the meaning of applicable Canadian provincial securities laws. Any statements or information that express or involve discussions with respect to predictions, expectations, beliefs, plans, projections, objectives, assumptions, or future events or performance (often, but not always, using words or phrases such as "expects", "is expected", "anticipates", "believes", "plans", "projects", "estimates", "assumes", "intends", "strategies", "targets", "goals", "forecasts", "objectives", "budgets", "schedules", "potential" or variations thereof or stating that certain actions, events or results "may", "could", "would", "might" or "will" be taken, occur or be achieved, or the negative of any of these terms and similar expressions) are not statements of historical fact and may be forward-looking statements or information. Such statements include, but are not limited to: statements regarding anticipated exploration, drilling, development, construction, and other activities or achievements of the Company; timing of receipt of permits and regulatory approvals; timing and content of the PEA, and estimates of the Company's revenues and capital expenditures; and other future plans, objectives or expectations of the Company.
The PEA study results of Silver Sand Project are preliminary in nature and are intended to provide an initial assessment of the project's economic potential and development options. The PEA mine schedule and economic assessment includes numerous assumptions and is based on both Indicated and Inferred mineral resources. Inferred resources are considered too speculative geologically to have the economic considerations applied to them that would enable them to be categorized as mineral reserves, and there is no certainty that the project economic assessments described herein will be achieved or that the PEA results will be realized. The estimate of mineral resources may be materially affected by geology, environmental, permitting, legal, title, socio-political, marketing or other relevant issues. Mineral Resources are not Mineral Reserves and do not have demonstrated economic viability. Additional exploration will be required to potentially upgrade the classification of the Inferred Mineral Resources to be considered in future advanced studies. AMC Mining Consultants (Canada) Ltd. (mineral resource, mining, infrastructure and financial analysis) was contracted to conduct the PEA in cooperation with Halyard Inc. (metallurgy and processing), and NewFields Canada Mining & Environment ULC (tailings, water and waste management). The Qualified Persons for the PEA are Mr. Wayne Rogers P.Eng and Mr. Mo Molavi P.Eng both Principal Mining Engineers with AMC Mining Consultants (Canada) Ltd, Mr. Andy Holloway P.Eng, Process Director with Halyard Inc., and Mr. Leon Botham P.Eng., Principal Engineer with NewFields Canada Mining & Environment ULC. This is in addition to Ms. Dinara Nussipakynova, P.Geo., Principal Geologist with AMC Consultants (Canada) Ltd. who estimated the Mineral Resources. All QPs have reviewed the technical content of the January 9, 2023, news release for the Silver Sand deposit and have approved its dissemination. The Silver Sand PEA is based on the updated Mineral Resource Estimate which was reported on November 28, 2022. The effective date of the 2022 Mineral Resource Estimate for Silver Sand is 31 October 2022. The cut-off applied for reporting the pit-constrained Mineral Resources is 30 g/t silver. Assumptions made to derive a cut-off grade included mining costs, processing costs and recoveries and were obtained from comparable industry situations. The model is depleted for historical mining activities. Mineral Resources are constrained by optimized pit shells at a silver price of US$22.50 per ounce, silver metallurgical recovery of 91%, silver payability of 99%, open pit mining cost of US$2.6/t, processing cost of US$16/t, G&A cost of US$2/t, and slope angle of 44-47 degrees. Key assumptions used for pit optimization for the PEA mining pit include silver price of US$22.50 per ounce, silver metallurgical recovery of 91%, silver payability of 99%, open pit mining cost of US$2.6/t, incremental mining cost of US$0.04/t (per 10 m bench), processing cost of US$16/t, tailing storage facility operating cost of US$0.7/t, G&A cost of US$2/t, royalty of 6.00%, mining recovery of 92%, dilution of 8%, and cut-off grade of 30 g/t silver.
Forward-looking statements or information are subject to a variety of known and unknown risks, uncertainties and other factors that could cause actual events or results to differ from those reflected in the forward-looking statements or information, including, without limitation, risks relating to: global economic and social impact of COVID-19; fluctuating equity prices, bond prices, commodity prices; calculation of resources, reserves and mineralization, general economic conditions, foreign exchange risks, interest rate risk, foreign investment risk; loss of key personnel; conflicts of interest; dependence on management, uncertainties relating to the availability and costs of financing needed in the future, environmental risks, operations and political conditions, the regulatory environment in Bolivia and Canada; risks associated with community relations and corporate social responsibility, and other factors described under the heading "Risk Factors" in the Company's Annual Information Form for the year ended June 30, 2022 and its other public filings.
This list is not exhaustive of the factors that may affect any of the Company's forward-looking statements or information.
The forward-looking statements are necessarily based on a number of estimates, assumptions, beliefs, expectations and opinions of management as of the date of this news release that, while considered reasonable by management, are inherently subject to significant business, economic and competitive uncertainties and contingencies. These estimates, assumptions, beliefs, expectations and options include, but are not limited to, those related to the Company's ability to carry on current and future operations, including: the duration and effects of COVID-19 on our operations and workforce; development and exploration activities; the timing, extent, duration and economic viability of such operations; the accuracy and reliability of estimates, projections, forecasts, studies and assessments; the Company's ability to meet or achieve estimates, projections and forecasts; the stabilization of the political climate in Bolivia; the Company's ability to obtain and maintain social license at its mineral properties; the availability and cost of inputs; the price and market for outputs; foreign exchange rates; taxation levels; the timely receipt of necessary approvals or permits, including the ratification and approval of the Mining Production Contract with COMIBOL by the Plurinational Legislative Assembly of Bolivia; the ability of the Company's Bolivian partner to convert the exploration licenses at the Carangas Project to AMC; the ability to meet current and future obligations; the ability to obtain timely financing on reasonable terms when required; the current and future social, economic and political conditions; and other assumptions and factors generally associated with the mining industry.
Although the forward-looking statements contained in this news release are based upon what management believes are reasonable assumptions, there can be no assurance that actual results will be consistent with these forward-looking statements. All forward-looking statements in this news release are qualified by these cautionary statements. Accordingly, readers should not place undue reliance on such statements. Other than specifically required by applicable laws, the Company is under no obligation and expressly disclaims any such obligation to update or alter the forward-looking statements whether as a result of new information, future events or otherwise except as may be required by law. These forward-looking statements are made as of the date of this news release.
This news release has been prepared in accordance with the requirements of the securities laws in effect in Canada which differ from the requirements of United States securities laws. The technical and scientific information contained herein has been prepared in accordance with NI 43-101, which differs from the standards adopted by the U.S. Securities and Exchange Commission (the "SEC"). Accordingly, the technical and scientific information contained herein, including any estimates of mineral reserves and mineral resources, may not be comparable to similar information disclosed by U.S. companies subject to the disclosure requirements of the SEC.
Additional information relating to the Company, including the Company's Annual Information Form, can be obtained under the Company's profile on SEDAR at www.sedar.com, on EDGAR at www.sec.gov, and on the Company's website at www.newpacificmetals.com.
View original content to download multimedia:https://www.prnewswire.com/news-releases/new-pacific-intersects-505-metres-grading-1-22-grams-per-tonne-gold-at-the-carangas-project-bolivia-301729127.html
SOURCE New Pacific Metals Corp.
Uncategorized
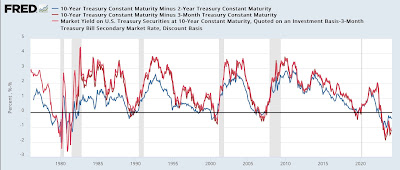
Manufacturing and construction vs. the still-inverted yield curve
– by New Deal democratProf. Menzie Chinn at Econbrowser makes the point that the yield curve is still inverted, and has not yet eclipsed the longest…
Share this:

- by New Deal democrat
Prof. Menzie Chinn at Econbrowser makes the point that the yield curve is still inverted, and has not yet eclipsed the longest previous time between onset of such an inversion and a recession. So he believes the threat of recession is still on the table.


Uncategorized
Half Of Downtown Pittsburgh Office Space Could Be Empty In 4 Years
Half Of Downtown Pittsburgh Office Space Could Be Empty In 4 Years
Authored by Mike Shedlock via MishTalk.com,
The CRE implosion is picking…
Share this:


Authored by Mike Shedlock via MishTalk.com,
The CRE implosion is picking up steam.
Check out the grim stats on Pittsburgh.
Unions are also a problem in Pittsburgh as they are in Illinois and California.
Downtown Pittsburgh Implosion
The Post Gazette reports nearly half of Downtown Pittsburgh office space could be empty in 4 years.
Confidential real estate information obtained by the Pittsburgh Post-Gazette estimates that 17 buildings are in “significant distress” and another nine are in “pending distress,” meaning they are either approaching foreclosure or at risk of foreclosure. Those properties represent 63% of the Downtown office stock and account for $30.5 million in real estate taxes, according to the data.
It also calculates the current office vacancy rate at 27% when subleases are factored in — one of the highest in the country.
And with an additional three million square feet of unoccupied leased space becoming available over the next five years, the vacancy rate could soar to 46% by 2028, based on the data.
Property assessments on 10 buildings, including U.S. Steel Tower, PPG Place, and the Tower at PNC Plaza, have been slashed by $364.4 million for the 2023 tax year, as high vacancies drive down their income.
Another factor has been the steep drop — to 63.5% from 87.5% — in the common level ratio, the number used to compute taxable value in county assessment appeal hearings.
The assessment cuts have the potential to cost the city, the county, and the Pittsburgh schools nearly $8.4 million in tax refunds for that year alone. Downtown represents nearly 25% of the city’s overall tax base.
In response Pittsburgh City Councilman Bobby Wilson wants to remove a $250,000 limit on the amount of tax relief available to a building owner or developer as long as a project creates at least 50 full-time equivalent jobs.
It’s unclear if the proposal will be enough. Annual interest costs to borrow $1 million have soared from $32,500 at the start of the pandemic in 2020 to $85,000 on March 1. Local construction costs have increased by about 30% since 2019.
But the city is doomed if it does nothing. Aaron Stauber, president of Rugby Realty said it will probably empty out Gulf Tower and mothball it once all existing leases expire.
“It’s cheaper to just shut the lights off,” he said. “At some point, we would move on to greener pastures.”
Where’s There’s Smoke There’s Unions
In addition to the commercial real estate woes, the city is also wrestling with union contracts.
Please consider Sounding the alarm: Pittsburgh Controller’s letter should kick off fiscal soul-searching
It’s only March, and Pittsburgh’s 2024 house-of-cards operating budget is already falling down. That’s the clear implication of a letter sent by new City Controller Rachael Heisler to Mayor Ed Gainey and members of City Council on Wednesday afternoon.
The letter is a rare and welcome expression of urgency in a city government that has fallen in complacency — and is close to falling into fiscal disaster.
The approaching crisis was thrown into sharp relief this week, when City Council approved amendments to the operating budget accounting for a pricey new contract with the firefighters union. The Post-Gazette Editorial Board had predicted that this contract — plus two others yet to be announced and approved — would demonstrate the dishonesty of Mayor Ed Gainey’s budget, and that’s exactly what’s happening: The new contract is adding $11 million to the administration’s artificially low 5-year spending projections, bringing expected 2028 reserves to just barely the legal limit.
But there’s still two big contracts to go, with the EMS union and the Pittsburgh Joint Collective Bargaining Committee, which covers Public Works workers. Worse, there are tens — possibly hundreds — of millions in unrealistic revenues still on the books. On this, Ms. Heisler’s letter only scratched the surface.
Similarly, as we have observed, the budget’s real estate tax revenue projections are radically inconsistent with reality. Due to high vacancies and a sharp reduction in the common level ratio, a significant drop in revenues was predictable — but not reflected in the budget. Ms. Heisler’s estimate of a 20% drop in revenues from Downtown property, or $5.3 million a year, may even be optimistic: Other estimates peg the loss at twice that, or more.
Left unmentioned in the letter are massive property tax refunds the city will owe, as well as fanciful projections of interest income that are inconsistent with the dwindling reserves, and drawing-down of federal COVID relief funds, predicted in the budget itself. That’s another unrealistic $80 million over five years.
Pittsburgh exited Act 47 state oversight after nearly 15 years on Feb. 12, 2018, with a clean bill of fiscal health.
It has already ruined that bill of health.
Act 47 in Pittsburgh
Flashback February 21, 2018: Act 47 in Pittsburgh: What Was Accomplished?
Pittsburgh’s tax structure was a much-complained-about topic leading up to the Act 47 declaration. The year following Pittsburgh’s designation as financially distressed under Act 47 it levied taxes on real estate, real estate transfers, parking, earned income, business gross receipts (business privilege and mercantile), occupational privilege and amusements. The General Assembly enacted tax reforms in 2004 giving the city authority to levy a payroll preparation tax in exchange for the immediate elimination of the mercantile tax and the phase out of the business privilege tax. The tax reforms increased the amount of the occupational privilege tax from $10 to $52 (this is today known as the local services tax and all municipalities outside of Philadelphia levy it and could raise it thanks to the change for Pittsburgh).
The coordinators recommended an increase in the deed transfer tax, which occurred in late 2004 (it was just increased again by City Council) and in the real estate tax, which increased in 2015.
Legacy costs, principally debt and underfunded pensions, were the primary focus of the 2009 amended recovery plan. The city’s pension funded ratio has increased significantly from where it stood a decade ago, rising from the mid-30 percent range to over 60 percent at last measurement.
The obvious question? Will the city stick to the steps taken to improve financially and avoid slipping back into distressed status? If Pittsburgh once stood “on the precipice of full-blown crisis,” as described in the first recovery plan, hopefully it won’t return to that position.
The Obvious Question
I could have answered the 2018 obvious question with the obvious answer. Hell no.
No matter how much you raise taxes, it will never be enough because public unions will suck every penny and want more.
On top of union graft, and insanely woke policies in California, we have an additional huge problem.
Hybrid Work Leaves Offices Empty and Building Owners Reeling
Hybrid work has put office building owners in a bind and could pose a risk to banks. Landlords are now confronting the fact that some of their office buildings have become obsolete, if not worthless.
Meanwhile, in Illinois …
Chicago Teachers’ Union Seeks $50 Billion Despite $700 Million City Deficit
Please note the Chicago Teachers’ Union Seeks $50 Billion Despite $700 Million City Deficit
The CTU wants to raise taxes across the board, especially targeting real estate.
My suggestion, get the hell out...
Uncategorized
Profits over patients: For-profit nursing home chains are draining resources from care while shifting huge sums to owners’ pockets
Owners of midsize nursing home chains harm the elderly and drain huge sums of money from facilities using opaque accounting practices while government…
Share this:


The care at Landmark of Louisville Rehabilitation and Nursing was abysmal when state inspectors filed their survey report of the Kentucky facility on July 3, 2021.
Residents wandered the halls in a facility that can house up to 250 people, yelling at each other and stealing blankets. One resident beat a roommate with a stick, causing bruising and skin tears. Another was found in bed with a broken finger and a bloody forehead gash. That person was allowed to roam and enter the beds of other residents. In another case, there was sexual touching in the dayroom between residents, according to the report.
Meals were served from filthy meal carts on plastic foam trays, and residents struggled to cut their food with dull plastic cutlery. Broken tiles lined showers, and a mysterious black gunk marred the floors. The director of housekeeping reported that the dining room was unsanitary. Overall, there was a critical lack of training, staff and supervision.
The inspectors tagged Landmark as deficient in 29 areas, including six that put residents in immediate jeopardy of serious harm and three where actual harm was found. The issues were so severe that the government slapped Landmark with a fine of over US$319,000 − more than 29 times the average for a nursing home in 2021 − and suspended payments to the home from federal Medicaid and Medicare funds.
But problems persisted. Five months later, inspectors levied six additional deficiencies of immediate jeopardy − the highest level.
Landmark is just one of the 58 facilities run by parent company Infinity Healthcare Management across five states. The government issued penalties to the company almost 4½ times the national average, according to bimonthly data that the Centers for Medicare & Medicaid Services first started to make available in late 2022. All told, Infinity paid nearly $10 million in fines since 2021, the highest among nursing home chains with fewer than 100 facilities.
Infinity Healthcare Management and its executives did not respond to multiple requests for comment.
Race to the bottom
Such sanctions are nothing new for Infinity or other for-profit nursing home chains that have dominated an industry long known for cutting corners in pursuit of profits for private owners. But this race to the bottom to extract profits is accelerating, despite demands by government officials, health care experts and advocacy groups to protect the nation’s most vulnerable citizens.
To uncover the reasons why, The Conversation delved into the nursing home industry, where for-profit facilities make up more than 72% of the nation’s nearly 14,900 facilities. The probe, which paired an academic expert with an investigative reporter, used the most recent government data on ownership, facility information and penalties, combined with CMS data on affiliated entities for nursing homes.
The investigation revealed an industry that places a premium on cost cutting and big profits, with low staffing and poor quality, often to the detriment of patient well-being. Operating under weak and poorly enforced regulations with financially insignificant penalties, the for-profit sector fosters an environment where corners are frequently cut, compromising the quality of care and endangering patient health.
Meanwhile, owners make the facilities look less profitable by siphoning money from the homes through byzantine networks of interconnected corporations. Federal regulators have neglected the problem as each year likely billions of dollars are funneled out of nursing homes through related parties and into owners’ pockets.
More trouble at midsize
Analyzing newly released government data, our investigation found that these problems are most pronounced in nursing homes like Infinity − midsize chains that operate between 11 and 100 facilities. This subsection of the industry has higher average fines per home, lower overall quality ratings, and are more likely to be tagged with resident abuse compared with both the larger and smaller networks. Indeed, while such chains account for about 39% of all facilities, they operate 11 of the 15 most-fined facilities.
With few impediments, private investors who own the midsize chains have swooped in to purchase underperforming homes, expanding their holdings even as larger chains divest and close facilities.
“They are really bad, but the names − we don’t know these names,” said Toby Edelman, senior policy attorney with the Center for Medicare Advocacy, a nonprofit law organization.
In response to The Conversation’s findings on nursing homes and request for an interview, a CMS spokesperson emailed a statement that said the CMS is “unwavering in its commitment to improve safety and quality of care for the more than 1.2 million residents receiving care in Medicare- and Medicaid-certified nursing homes.”
“We support transparency and accountability,” the American Health Care Association/National Center for Assisted Living, a trade organization representing the nursing home industry, wrote in response to The Conversation‘s request for comment. “But neither ownership nor line items on a budget sheet prove whether a nursing home is committed to its residents.”
Ripe for abuse
It often takes years to improve a poor nursing home − or run one into the ground. The analysis of midsize chains shows that most owners have been associated with their current facilities for less than eight years, making it difficult to separate operators who have taken long-term investments in resident care from those who are looking to quickly extract money and resources before closing them down or moving on. These chains control roughly 41% of nursing home beds in the U.S., according to CMS’s provider data, making the lack of transparency especially ripe for abuse.
A churn of nursing home purchases even during the pandemic shows that investors view the sector as highly profitable, especially when staffing costs are kept low and fines for poor care can easily be covered by the money extracted from residents, their families and taxpayers.
A March 2024 study from Lehigh University and the University of California, Los Angeles also shows that costs were inflated when nursing home owners switched to contractors they controlled directly or indirectly. Overall, spending on real estate increased 20.4% and spending on management increased 24.6% when the businesses were affiliated, the research showed.
“This is the model of their care: They come in, they understaff and they make their money,” said Sam Brooks, director of public policy at the Consumer Voice, a national resident advocacy organization. “Then they multiply it over a series of different facilities.”
This is a condensed version of an article from The Conversation’s investigative unit. To find out more about the rise of for-profit nursing homes, financial trickery and what could make the nation’s most vulnerable citizens safer, read the complete version.
Campbell is an adjunct assistant professor at Columbia University and a contributing writer at the Garrison Project, an independent news organization that focuses on mass incarceration and criminal justice.
Harrington is an advisory board member of the nonprofit Veteran's Health Policy Institute and a board member of the nonprofit Center for Health Information and Policy. Harrington served as an expert witness on nursing home litigation cases by residents against facilities owned or operated by Brius and Shlomo Rechnitz in the past and in 2022. She also served as an expert witness in a case against The Citadel Salisbury in North Carolina in 2021.
real estate pandemic

Manufacturing and construction vs. the still-inverted yield curve


Default: San Francisco Four Seasons Hotel Investors $3 Million Late On Loan As Foreclosure Looms


Half Of Downtown Pittsburgh Office Space Could Be Empty In 4 Years


Airline, travel companies face Chapter 11 bankruptcy, default risk


Profits over patients: For-profit nursing home chains are draining resources from care while shifting huge sums to owners’ pockets
-

 Uncategorized4 weeks ago
All Of The Elements Are In Place For An Economic Crisis Of Staggering Proportions
-

 Spread & Containment6 days ago
IFM’s Hat Trick and Reflections On Option-To-Buy M&A
-

 International2 weeks ago
EyePoint poaches medical chief from Apellis; Sandoz CFO, longtime BioNTech exec to retire
-

 Uncategorized1 month ago
California Counties Could Be Forced To Pay $300 Million To Cover COVID-Era Program
-

 Uncategorized3 weeks ago
Apparel Retailer Express Moving Toward Bankruptcy
-

 Uncategorized1 month ago
Industrial Production Decreased 0.1% in January
-

 International1 week ago
Walmart launches clever answer to Target’s new membership program
-

 Uncategorized1 month ago
RFK Jr: The Wuhan Cover-Up & The Rise Of The Biowarfare-Industrial Complex