Neptune Reports Fiscal Fourth Quarter and Full Year 2022 Financial Results
Neptune Reports Fiscal Fourth Quarter and Full Year 2022 Financial Results
PR Newswire
LAVAL, QC, July 8, 2022
Fiscal year 2022 revenue totaled $48.8 million, an increase of 37.8% year-over-year
Previously announced planned divestiture of cannabis …
Share this:

Neptune Reports Fiscal Fourth Quarter and Full Year 2022 Financial Results
PR Newswire
LAVAL, QC, July 8, 2022
Fiscal year 2022 revenue totaled $48.8 million, an increase of 37.8% year-over-year
Previously announced planned divestiture of cannabis business expected to realize annualized payroll cost savings of $4.4 million USD
Company will host a conference call at 11:00 a.m. (Eastern Time) on Monday, July 11, 2022, to discuss these results
LAVAL, QC, July 8, 2022 /PRNewswire/ - Neptune Wellness Solutions Inc. ("Neptune" or the "Company") (NASDAQ: NEPT) (TSX: NEPT), a diversified and fully integrated health and wellness company focused on plant-based, sustainable and purpose-driven lifestyle brands, today announced its financial and operating results for the three-month and twelve-month periods ending March 31, 2022.
"Neptune made significant progress on our path to become a pure play CPG company, with growth year-over-year and positive momentum in our key focus areas of Sprout and Biodroga during the fourth quarter. We expect this trend to continue into our fiscal 2023, with both Sprout and Biodroga continuing to expand their existing popular product offerings, as well as releasing new product lines that cater to different customer groups."
"Neptune's management and Board have made several strategic decisions recently that we believe are in the best interest of the company and its shareholders. In particular, significant cost saving initiatives, the planned divestiture of our cannabis business, and a refocusing of resources on our renewed mission of becoming a leading CPG company. In addition, we have continued our strategic review to help identify further synergies and cost savings. We are looking forward to the next phase for Neptune as we seek to capitalize on our large target addressable markets of personal care & beauty and organic food & beverages, which we believe have the most exciting growth potential. We remain steadfast in our goal to deliver on profitability and shareholder value."
- Fiscal fourth quarter revenue totaled $11.5 million, an increase of 147% as compared to $4.7 million for the same period the year prior.
- Fiscal year 2022 revenue totaled $48.8 million, an increase of 37.8% as compared to $35.4 million for the same period the year prior.
- Reported fiscal year 2022 gross profit loss of $7.5 million compared to a gross profit loss of $27.4 million for the fiscal year 2021. Gross margin of (15.4%) compares to (77.3%) in the year-ago period.
- Reported fourth quarter net loss of $36.2 million compared to a reported net loss of $43.5 million in the comparable period in fiscal 2021 and reported fiscal year 2022 net loss of $84.4 million compared to a net loss of $124.3 million for the fiscal year 2021.
- Adjusted EBITDA (non-GAAP)1 loss for fiscal year 2022 was $43.8 million compared to an Adjusted EBITDA (non-GAAP)1 loss of $39.4 million for the fiscal year 2021.
- Announced further reductions of corporate overheads by expanding in-house legal capabilities.
- Announced the appointment of Julie Phillips as Chair of Neptune's Board of Directors.
- Launched and expanded a first of its kind co-branded product line with "CoComelon" across North America.
- Received a 180 calendar day extension from Nasdaq's Listing Qualification Department to meet Nasdaq's minimum bid requirement.
- Launched Forest Remedies Multi-Omega 3-6-9 Supplements in 340+ Sprouts Farmers Market stores across the U.S.
- Announced a US$8,000,000 Registered Direct Offering.
- Launched new CPG-focused strategic plan to profitability.
- Announced appointment of Raymond Silcock as Chief Financial Officer.
- Announced the appointment of Philip Sanford as Audit Chair of Neptune's Board of Directors.
- Launched new line of CoComelon co-branded organic snack bars.
- Announced completion of share consolidation from approximately 198 million Common Shares to approximately 5.7 million.
- Announced a US$5,000,000 Registered Direct Offering Priced At-the-Market Under Nasdaq Rules.
The Company will host a conference call at 11:00 a.m. (Eastern Time) on Monday, July 11, 2022, to discuss these results. The conference call will be webcast live and can be accessed by registering on the Events and Presentations portion of Neptune's Investor Relations website at www.investors.neptunewellness.com. The webcast will be archived for approximately 90 days.
Consolidated Balance Sheets
(in U.S. dollars)
As at | As at | ||||
March 31, | March 31, | ||||
Assets | |||||
Current assets: | |||||
Cash and cash equivalents | $8,726,341 | $59,836,889 | |||
Short-term investment | 19,255 | 19,145 | |||
Trade and other receivables | 7,599,584 | 8,667,209 | |||
Prepaid expenses | 3,983,427 | 3,686,851 | |||
Inventories | 17,059,406 | 17,317,423 | |||
Total current assets | 37,388,013 | 89,527,517 | |||
Property, plant and equipment | 21,448,123 | 37,345,716 | |||
Operating lease right-of-use assets | 2,295,263 | 2,899,199 | |||
Intangible assets | 21,655,035 | 25,956,830 | |||
Goodwill | 22,168,288 | 25,453,372 | |||
Marketable securities | — | 150,000 | |||
Other financial assets | — | 5,615,167 | |||
Total assets | $104,954,722 | $186,947,801 | |||
Liabilities and Equity | |||||
Current liabilities: | |||||
Trade and other payables | $22,700,849 | $19,881,995 | |||
Current portion of operating lease liabilities | 641,698 | 230,016 | |||
Deferred revenues | 285,004 | 1,989,632 | |||
Provisions | 1,118,613 | 2,245,658 | |||
Liability related to warrants | 5,570,530 | 10,462,137 | |||
Total current liabilities | 30,316,694 | 34,809,438 | |||
Operating lease liabilities | 2,063,421 | 2,886,940 | |||
Loans and borrowings | 11,648,320 | 11,312,959 | |||
Other liability | 88,688 | 393,155 | |||
Total liabilities | 44,117,123 | 49,402,492 | |||
Shareholders' Equity: | |||||
Share capital - without par value (5,554,456 shares issued and outstanding as of March 31, 2022; | 317,051,125 | 306,618,482 | |||
Warrants | 6,079,890 | 5,900,973 | |||
Additional paid-in capital | 55,980,367 | 59,625,356 | |||
Accumulated other comprehensive loss | (7,814,163) | (8,567,106) | |||
Deficit | (323,181,697) | (248,209,952) | |||
Total equity attributable to equity holders of the Corporation | 48,115,522 | 115,367,753 | |||
Non-controlling interest | 12,722,077 | 22,177,556 | |||
Total shareholders' equity | 60,837,599 | 137,545,309 | |||
Commitments and contingencies | |||||
Subsequent events | |||||
Total liabilities and shareholders' equity | $104,954,722 | $186,947,801 |
See accompanying notes to the consolidated financial statements. |
Consolidated Statements of Loss and Comprehensive Loss
(in U.S. dollars)
Years ended | ||||||
March 31, | March 31, | |||||
Revenue from sales and services, net of excise taxes of $1,877,543 (2021 - $38,056) | $47,695,828 | $34,261,647 | ||||
Royalty revenues | 1,019,861 | 1,109,678 | ||||
Other revenues | 81,435 | 28,994 | ||||
Total revenues | 48,797,124 | 35,400,319 | ||||
Cost of sales other than loss on inventories, net of subsidies | (52,561,404) | (30,964,709) | ||||
Cost of services | — | (12,846,937) | ||||
Impairment loss on inventories | (3,772,066) | (18,962,254) | ||||
Total Cost of sales and services | (56,333,470) | (62,773,900) | ||||
Gross profit (loss) | (7,536,346) | (27,373,581) | ||||
Research and development expenses, net of tax credits and grants | (880,151) | (1,922,195) | ||||
Selling, general and administrative expenses, net of subsidies | (60,538,424) | (63,824,118) | ||||
Impairment loss related to intangible assets | (1,527,000) | — | ||||
Impairment loss related to property, plant and equipment | (14,765,582) | (10,747,692) | ||||
Impairment loss related to right-of-use assets | — | (107,650) | ||||
Impairment loss related to goodwill | (3,288,847) | (26,898,016) | ||||
Net gain on sale of assets | 6,469 | — | ||||
Loss from operating activities | (88,529,881) | (130,873,252) | ||||
Finance income | 7,123 | 825,745 | ||||
Finance costs | (2,143,978) | (1,786,781) | ||||
Foreign exchange loss | (685,708) | (4,051,418) | ||||
Change in revaluation of marketable securities | (107,203) | 169,216 | ||||
Gain on revaluation of derivatives | 7,035,118 | 7,974,549 | ||||
4,105,352 | 3,131,311 | |||||
Loss before income taxes | (84,424,529) | (127,741,941) | ||||
Income tax recovery | — | 3,477,711 | ||||
Net loss | (84,424,529) | (124,264,230) | ||||
Other comprehensive income | ||||||
Net change in unrealized foreign currency gains on translation of | 750,248 | 6,737,947 | ||||
Total other comprehensive income | 750,248 | 6,737,947 | ||||
Total comprehensive loss | $(83,674,281) | $(117,526,283) | ||||
Net loss attributable to: | ||||||
Equity holders of the Corporation | $(74,971,745) | $(123,170,020) | ||||
Non-controlling interest | (9,452,784) | (1,094,210) | ||||
Net loss | $(84,424,529) | $(124,264,230) | ||||
Total comprehensive loss attributable to: | ||||||
Equity holders of the Corporation | $(74,218,802) | $(116,206,145) | ||||
Non-controlling interest | (9,455,479) | (1,320,138) | ||||
Total comprehensive loss | $(83,674,281) | $(117,526,283) | ||||
Basic and diluted loss per share attributable to: | ||||||
Equity holders of the Corporation | $(15.54) | $(35.55) | ||||
Non-controlling interest | $(1.96) | $(0.32) | ||||
Total loss per share | $(17.50) | $(35.86) | ||||
Basic and diluted weighted average number of common shares | 4,824,336 | 3,465,059 | ||||
See accompanying notes to the consolidated financial statements.
The following table sets out selected consolidated financial information and are prepared in accordance with US GAAP.
Twelve-month periods ended | ||||||||
March 31, | March 31, | |||||||
$ | $ | |||||||
Total revenues | 48.797 | 35.400 | ||||||
Adjusted EBITDA1 | (43.811) | (39.444) | ||||||
Net loss | (84.425) | (124.264) | ||||||
Net loss attributable to equity holders of the | (74.972) | (123.170) | ||||||
Net loss attributable to non-controlling interest | (9.453) | (1.094) | ||||||
Basic and diluted loss per share | (17.50) | (35.86) | ||||||
Basic and diluted loss per share attributable | (15.54) | (35.55) | ||||||
Basic and diluted loss per share attributable | (1.96) | (0.32) | ||||||
As at | As at | As at | ||||
$ | $ | $ | ||||
Total assets | 104.955 | 186.948 | 120.060 | |||
Working capital2 | 7.071 | 54.718 | 15.346 | |||
Non-current financial liabilities | 13.800 | 14.593 | 4.854 | |||
Equity attributable to equity holders of the Corporation | 48.116 | 115.368 | 102.962 | |||
Equity attributable to non-controlling interest | 12.722 | 22.178 | — | |||
1 The Adjusted EBITDA is a non-GAAP measure. It is not a standard measure endorsed by US GAAP requirements. A reconciliation | ||||||
2 Working capital is calculated by subtracting current liabilities from current assets. Because there is no standard method endorsed by | ||||||
Although the concept of Adjusted EBITDA is not a financial or accounting measure defined under US GAAP and it may not be comparable to other issuers, it is widely used by companies. Neptune obtains its Adjusted EBITDA measurement by adding to net loss, net finance costs (income) and depreciation and amortization, and income tax expense (recovery). Other items such as stock-based compensation, non-employee compensation related to warrants, litigation provisions, business acquisition and integration costs, signing bonuses, severances and related costs, impairment losses on non-financial assets, write-downs of non-financial assets, costs related to a cybersecurity incident, revaluations of derivatives, system migration, conversion and implementation, CEO directors and officers insurance, costs related to conversion from IFRS to US GAAP and other changes in fair values are also added back. The exclusion of net finance costs (income) eliminates the impact on earnings derived from non-operational activities. The exclusion of depreciation and amortization, stock-based compensation, non-employee compensation related to warrants, litigation provisions, impairment losses, write-downs revaluations of derivatives and other changes in fair values eliminates the non-cash impact, and the exclusion of acquisition costs, integration costs, signing bonuses, severance and related costs, costs related to cybersecurity and costs related to conversion from IFRS to US GAAP present the results of the on-going business. From time to time, the Company may exclude additional items if it believes doing so would result in a more effective analysis of underlying operating performance. In Q4 2022, the Company added the costs related to the conversion from IFRS to US GAAP as an adjustment to the definition of Adjusted EBITDA. Adjusting for these items does not imply they are non-recurring. For purposes of this analysis, the Net finance costs (income) caption in the reconciliation below includes the impact of the revaluation of foreign exchange rates.
Adjusted EBITDA1 reconciliation, in millions of dollars
Twelve-month periods ended | ||||||||
March 31, | March 31, | |||||||
Net income (loss) for the period | $(84.425) | $(124.264) | ||||||
Add (deduct): | ||||||||
Depreciation and amortization | 6.791 | 8.830 | ||||||
Acceleration of amortization of long-lived non-financial assets | — | 10.552 | ||||||
Revaluation of derivatives | (7.035) | (7.975) | ||||||
Net finance costs | 2.823 | 5.012 | ||||||
Equity classified stock-based compensation | 7.817 | 9.885 | ||||||
Non-employee compensation related to warrants | 0.179 | 1.904 | ||||||
Litigation provisions | 0.627 | 1.290 | ||||||
Business acquisition and integration costs | 1.027 | 0.300 | ||||||
System migration, conversion, implementation | 0.327 | — | ||||||
CEO D&O insurance | 4.697 | — | ||||||
Signing bonuses, severances and related costs | 0.851 | 0.454 | ||||||
Costs related to cybersecurity incident | — | 1.500 | ||||||
Write-down of inventories and deposits | 3.772 | 18.962 | ||||||
Impairment loss on long-lived assets | 18.054 | 37.753 | ||||||
Costs related to conversion from IFRS to US GAAP | 0.577 | — | ||||||
Change in revaluation of marketable securities | 0.107 | (0.169) | ||||||
Income tax expense (recovery) | — | (3.478) | ||||||
Adjusted EBITDA1 | $(43.811) | $(39.444) | ||||||
1 The Adjusted EBITDA is not a standard measure endorsed by US GAAP requirements. |
The audited consolidated financial statements of Neptune Wellness Solutions Inc. were prepared in accordance with U.S. generally accepted accounting principles. The audited consolidated financial statements and management's discussion and analysis of financial condition and result of operations have been filed on SEDAR at www.sedar.com and on EDGAR at www.sec.gov/edgar.shtml, and may also be found on our investor relations website at www.investors.neptunewellness.com. All amounts are in United States dollars except if specified otherwise.
This news release contains a non-GAAP measure, specifically Adjusted EBITDA. We use Adjusted EBITDA to provide investors with a supplemental measure of our operating performance and thus highlight trends in our core business that may not otherwise be apparent when relying solely on GAAP financial measures. We believe that securities analysts, investors and other interested parties frequently use non-GAAP measures in the evaluation of issuers. Management also uses this non-GAAP measure in order to facilitate operating performance comparisons from period to period, prepare annual operating budgets and assess our ability to meet our capital expenditure and working capital requirements. Adjusted EBITDA is not recognized, defined or standardized measures under GAAP. Our definition of Adjusted EBITDA will likely differ from that used by other companies (including our peers) and therefore comparability may be limited. Non-GAAP measures should not be considered a substitute for or in isolation from measures prepared in accordance with GAAP. Investors are encouraged to review our financial statements and disclosures in their entirety and are cautioned not to put undue reliance on non-GAAP measures and view them in conjunction with the most comparable GAAP financial measures. We obtain our Adjusted EBITDA measurement by adding net loss, net finance costs (income) and depreciation and amortization, and income tax expense (recovery). Other items such as stock-based compensation, non-employee compensation related to warrants, litigation provisions, business acquisition and integration costs, signing bonuses, severances and related costs, impairment losses on non-financial assets, write-downs of non-financial assets, costs related to a cybersecurity incident, revaluations of derivatives, system migration, conversion and implementation, CEO directors and officers insurance, costs related to conversion from IFRS to US GAAP and other changes in fair values are also added back. For more information on our Adjusted EBITDA, please refer to our Management Discussion and Analysis for the quarter.
Pursuant to National Instrument 51-102 – Continuous Disclosure Obligations ("NI 51-102"), namely Part 4 of NI 51-102, as an "SEC Issuer", given that Neptune has filed its full year 2022 audited financial statements (the "2022 Annual Financial Statements") which have, for the first time, been prepared in accordance with U.S. GAAP, the Company is required to re-file its previously filed interim financial reports that have been filed since its last filing of annual financial statements for its fiscal year ended March 31, 2021, which include: (i) the three-month periods ended June 30, 2021 and 2020, (ii) the three and six-month periods ended September 30, 2021 and 2020; and (iii) the three and nine-month periods ended December 31, 2021 and 2020 (collectively, the "Restated Filings"), with such Restated Filings to be prepared and refiled in accordance with U.S. GAAP. The Restated Filings are required to be refiled at the same time as the filing of the 2022 Annual Financial Statements. Despite substantial efforts, the Company is currently not in a position to file the Restated Filings as a result of heavy workloads by the relevant working groups, including time and dedication spent by the relevant parties for the preparation of the 2022 Annual Financial Statements, and the longer than anticipated time required to restate the Restated Filings under U.S. GAAP. As a result of the foregoing, the Company has obtained a temporary management cease trade order ("MCTO") from the applicable Canadian securities regulatory authorities. The Company intends to satisfy the provisions of the alternative information guidelines in accordance with National Policy 12-203 – Management Cease Trade Orders by issuing bi-weekly status reports in the form of news releases. The applicable Canadian securities regulatory authorities may issue a general cease trade order against the Company if the Company fails to file its status reports during the prescribed time limits.
The Company, along with its board of directors and external auditors, are working expeditiously to meet the Company's filing obligations in the near term and no later than July 22, 2022. Other than the conversion of the Restated Filings into U.S. GAAP, the Company does not expect any other changes to be made to the previously filed interim financial reports, which were previously prepared in accordance with IFRS and are all currently available under the Company's SEDAR and EDGAR profiles at www.sedar.com and www.sec.gov, respectively.
Headquartered in Laval, Quebec, Neptune is a diversified health and wellness company with a mission to redefine health and wellness. Neptune is focused on building a portfolio of high quality, affordable consumer products in response to long-term secular trends and market demand for natural, plant-based, sustainable and purpose-driven lifestyle brands. The Company utilizes a highly flexible, cost-efficient manufacturing and supply chain infrastructure that can be scaled to quickly adapt to consumer demand and bring new products to market through its mass retail partners and e-commerce channels. For additional information, please visit: https://neptunewellness.com/.
This news release contains "forward-looking information" and "forward-looking statements" (collectively, "forward-looking statements") within the meaning of applicable securities laws. All statements, other than statements of historical fact, are forward-looking statements and are based on expectations, estimates, and projections as at the date of this news release. Any statement that involves discussions with respect to predictions, expectations, beliefs, plans, projections, objectives, assumptions, future events or performance (often but not always using phrases such as "expects", or "does not expect", "is expected", "anticipates" or "does not anticipate", "plans", "budget", "scheduled", "forecasts", "estimates", "believes" or "intends" or variations of such words and phrases or stating that certain actions, events or results "may" or "could", "would", "might" or "will" be taken to occur or be achieved) are not statements of historical fact and may be forward-looking statements. In this news release, forward-looking statements include, among other things, statements with respect to the Company's strategic review, expected cost savings, projected growth of Sprout and Biodroga, the success of the Company's action plan, including the divestiture of the Company's cannabis business, future increased revenues, expectations regarding expenses, cash needs, cash flow, liquidity and sources of funding, future expansion plans, initiatives and strategies of the Company, and the Company's performance, growth initiatives, profitability, future product launches and plans and gain in market share, as well as the timing for the filing of the Restated Filings.
These forward-looking statements are based on assumptions and estimates of management of the Company at the time such statements were made. Actual future results may differ materially as forward-looking statements involve known and unknown risks, uncertainties, and other factors which may cause the actual results, performance, or achievements of the Company to materially differ from any future results, performance, or achievements expressed or implied by such forward-looking statements. Such factors, among other things, include: the ability of the Company to successfully implement its strategic initiatives; implications of the COVID-19 pandemic on the Company's operations; fluctuations in general macroeconomic conditions; fluctuations in securities markets; changing consumer habits; the ability of the Company to successfully achieve its business objectives and cost cutting plans; plans for expansion; political and social uncertainties; inability to obtain adequate insurance to cover risks and hazards; the ability of the Company to obtain financing on acceptable terms, the adequacy of our capital resources and liquidity, including but not limited to, availability of sufficient cash flow to execute our business plan (either within the expected timeframe or at all); the ability of the Company to obtain financing on acceptable terms, expectations regarding the resolution of litigation and other legal and regulatory proceedings, reviews and investigations; employee relations; and the presence of laws and regulations that may impose restrictions in the markets where the Company operates. Although the forward-looking statements contained in this news release are based upon what management of the Company believes, or believed at the time, to be reasonable assumptions, the Company cannot assure shareholders that actual results will be consistent with such forward-looking statements, as there may be other factors that cause results not to be as anticipated, estimated or intended. Readers should not place undue reliance on the forward-looking statements and information contained in this news release. The Company assumes no obligation to update the forward-looking statements of beliefs, opinions, projections, or other factors, should they change, except as required by law.
Additional information regarding these and other risks and uncertainties relating to the Company's business are contained under the heading "Risk Factors" in the Company's Annual Report on Form 10-K dated July 7, 2022, for the year ended March 31, 2022.
Neither NASDAQ nor the Toronto Stock Exchange accepts responsibility for the adequacy or accuracy of this release.
1This is a non-GAAP measure. For further information on non-GAAP measures, please refer to the "Non-GAAP Measures" section of this news release. Please also refer to the tables in this news release for a reconciliation of this Non-GAAP measure to the most directly comparable GAAP measure. |
View original content to download multimedia:https://www.prnewswire.com/news-releases/neptune-reports-fiscal-fourth-quarter-and-full-year-2022-financial-results-301582961.html
SOURCE Neptune Wellness Solutions Inc.
Government
Young People Aren’t Nearly Angry Enough About Government Debt
Young People Aren’t Nearly Angry Enough About Government Debt
Authored by The American Institute for Economic Research,
Young people sometimes…
Share this:


Authored by The American Institute for Economic Research,
Young people sometimes seem to wake up in the morning in search of something to be outraged about. We are among the wealthiest and most educated humans in history. But we’re increasingly convinced that we’re worse off than our parents were, that the planet is in crisis, and that it’s probably not worth having kids.
I’ll generalize here about my own cohort (people born after 1981 but before 2010), commonly referred to as Millennials and Gen Z, as that shorthand corresponds to survey and demographic data. Millennials and Gen Z have valid economic complaints, and the conditions of our young adulthood perceptibly weakened traditional bridges to economic independence. We graduated with record amounts of student debt after President Obama nationalized that lending. Housing prices doubled during our household formation years due to zoning impediments and chronic underbuilding. Young Americans say economic issues are important to us, and candidates are courting our votes by promising student debt relief and cheaper housing (which they will never be able to deliver).
Young people, in our idealism and our rational ignorance of the actual appropriations process, typically support more government intervention, more spending programs, and more of every other burden that has landed us in such untenable economic circumstances to begin with. Perhaps not coincidentally, young people who’ve spent the most years in the increasingly partisan bubble of higher education are also the most likely to favor expanded government programs as a “solution” to those complaints.
It’s Your Debt, Boomer
What most young people don’t yet understand is that we are sacrificing our young adulthood and our financial security to pay for debts run up by Baby Boomers. Part of every Millennial and Gen-Z paycheck is payable to people the same age as the members of Congress currently milking this system and miring us further in debt.
Our government spends more than it can extract from taxpayers. Social Security, which represents 20 percent of government spending, has run an annual deficit for 15 years. Last year Social Security alone overspent by $22.1 billion. To keep sending out checks to retirees, Social Security goes begging to the Treasury Department, and the Treasury borrows from the public by issuing bonds. Bonds allow investors (who are often also taxpayers) to pay for some retirees’ benefits now, and be paid back later. But investors only volunteer to lend Social Security the money it needs to cover its bills because the (younger) taxpayers will eventually repay the debt — with interest.
In other words, both Social Security and Medicare, along with various smaller federal entitlement programs, together comprising almost half of the federal budget, have been operating for a decade on the principle of “give us the money now, and stick the next generation with the check.” We saddle future generations with debt for present-day consumption.
The second largest item in the budget after Social Security is interest on the national debt — largely on Social Security and other entitlements that have already been spent. These mandatory benefits now consume three quarters of the federal budget: even Congress is not answerable for these programs. We never had the chance for our votes to impact that spending (not that older generations were much better represented) and it’s unclear if we ever will.
Young Americans probably don’t think much about the budget deficit (each year’s overspending) or the national debt (many years’ deficits put together, plus interest) much at all. And why should we? For our entire political memory, the federal government, as well as most of our state governments, have been steadily piling “public” debt upon our individual and collective heads. That’s just how it is. We are the frogs trying to make our way in the watery world as the temperature ticks imperceptibly higher. We have been swimming in debt forever, unaware that we’re being economically boiled alive.
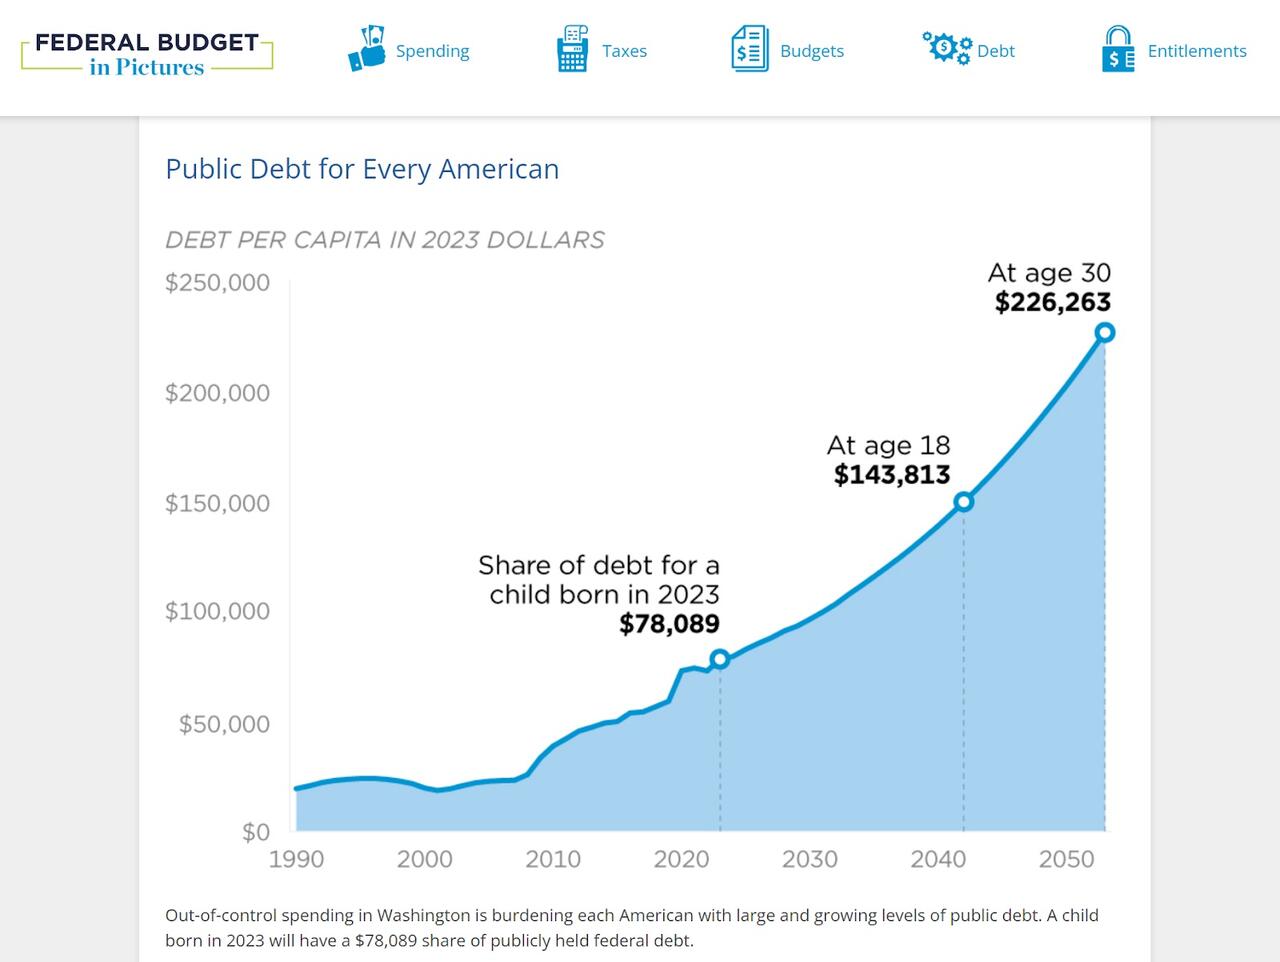
Millennials have somewhat modest non-mortgage debt of around $27,000 (some self-reports say twice that much), including car notes, student loans, and credit cards. But we each owe more than $100,000 as a share of the national debt. And we don’t even know it.
When Millennials finally do have babies (and we are!) that infant born in 2024 will enter the world with a newly minted Social Security Number and $78,089 credit card bill for Granddad’s heart surgery and the interest on a benefit check that was mailed when her parents were in middle school.
Headlines and comments sections love to sneer at “snowflakes” who’ve just hit the “real world,” and can’t figure out how to make ends meet, but the kids are onto something. A full 15 percent of our earnings are confiscated to pay into retirement and healthcare programs that will be insolvent by the time we’re old enough to enjoy them. The Federal Reserve and government debt are eating the economy. The same interest rates that are pushing mortgages out of reach are driving up the cost of interest to maintain the debt going forward. As we learn to save and invest, our dollars are slowly devalued. We’re right to feel trapped.
Sure, if we’re alive and own a smartphone, we’re among the one percent of the wealthiest humans who’ve ever lived. Older generations could argue (persuasively!) that we have no idea what “poverty” is anymore. But with the state of government spending and debt…we are likely to find out.
Despite being richer than Rockefeller, Millennials are right to say that the previous ways of building income security have been pushed out of reach. Our earning years are subsidizing not our own economic coming-of-age, but bank bailouts, wars abroad, and retirement and medical benefits for people who navigated a less-challenging wealth-building landscape.
Redistribution goes both ways. Boomers are expected to pass on tens of trillions in unprecedented wealth to their children (if it isn’t eaten up by medical costs, despite heavy federal subsidies) and older generations’ financial support of the younger has had palpable lifting effects. Half of college costs are paid by families, and the trope of young people moving back home is only possible if mom and dad have the spare room and groceries to make that feasible.
Government “help” during COVID-19 resulted in the worst inflation in 40 years, as the federal government spent $42,000 per citizen on “stimulus” efforts, right around a Millennial’s average salary at that time. An absurd amount of fraud was perpetrated in the stimulus to save an economy from the lockdown that nearly ruined it. Trillions in earmarked goodies were rubber stamped, carelessly added to young people’s growing bill. Government lenders deliberately removed fraud controls, fearing they couldn’t hand out $800 billion in young people’s future wages away fast enough. Important lessons were taught by those programs. The importance of self-sufficiency and the dignity of hard work weren’t top of the list.
Boomer Benefits are Stagnating Hiring, Wages, and Investment for Young People
Even if our workplace engagement suffered under government distortions, Millennials continue to work more hours than other generations and invest in side hustles and self employment at higher rates. Working hard and winning higher wages almost doesn’t matter, though, when our purchasing power is eaten from the other side. Buying power has dropped 20 percent in just five years. Life is $11,400/year more expensive than it was two years ago and deficit spending is the reason why.
We’re having trouble getting hired for what we’re worth, because it costs employers 30 percent more than just our wages to employ us. The federal tax code both requires and incentivizes our employers to transfer a bunch of what we earned directly to insurance companies and those same Boomer-busted federal benefits, via tax-deductible benefits and payroll taxes. And the regulatory compliance costs of ravenous bureaucratic state. The price paid by each employer to keep each employee continues to rise — but Congress says your boss has to give most of the increase to someone other than you.
Federal spending programs that many people consider good government, including Social Security, Medicare, Medicaid, and health insurance for children (CHIP) aren’t a small amount of the federal budget. Government spends on these programs because people support and demand them, and because cutting those benefits would be a re-election death sentence. That’s why they call cutting Social Security the “third rail of politics.” If you touch those benefits, you die. Congress is held hostage by Baby Boomers who are running up the bill with no sign of slowing down.
Young people generally support Social Security and the public health insurance programs, even though a 2021 poll by Nationwide Financial found 47 percent of Millennials agree with the statement “I will not get a dime of the Social Security benefits I have earned.”
In the same survey, Millennials were the most likely of any generation to believe that Social Security benefits should be enough to live on as a sole income, and guessed the retirement age was 52 (it’s 67 for anyone born after 1959 — and that’s likely to rise). Young people are the most likely to see government guarantees as a valid way to live — even though we seem to understand that those promises aren’t guarantees at all.
Healthcare costs tied to an aging population and wonderful-but-expensive growth in medical technologies and medications will balloon over the next few years, and so will the deficits in Boomer benefit programs. Newly developed obesity drugs alone are expected to add $13.6 billion to Medicare spending. By 2030, every single Baby Boomer will be 65, eligible for publicly funded healthcare.
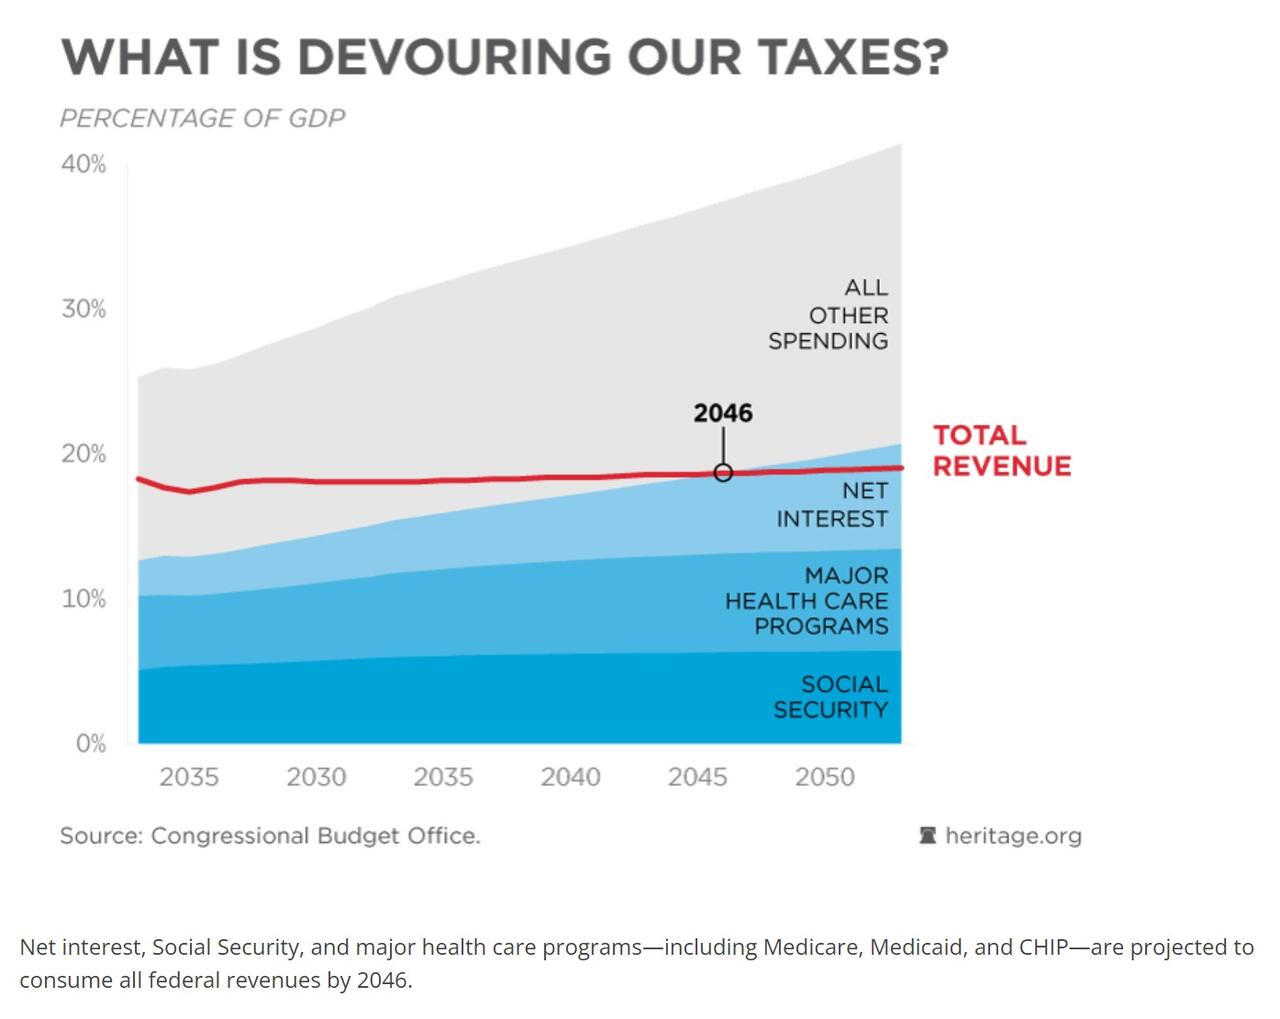
The first Millennial will be eligible to claim Medicare (assuming the program exists and the qualifying age is still 65, both of which are improbable) in 2046. As it happens, that’s also the year that the Boomer benefits programs (which will then be bloated with Gen Xers) and the interest payments we’re incurring to provide those benefits now, are projected to consume 100 percent of federal tax revenue.
Government spending is being transferred to bureaucrats and then to the beneficiaries of government spending who are, in some sense, your diabetic grandma who needs a Medicare-paid dialysis treatment, but in a much more immediate sense, are the insurance companies, pharma giants, and hospital corporations who wrote the healthcare legislation. Some percentage of every college graduate’s paycheck buys bullets that get fired at nothing and inflating the private investment portfolios of government contractors, with dubious, wasteful outcomes from the prison-industrial complex to the perpetual war machine.
No bank or nation in the world can lend the kind of money the American government needs to borrow to fulfill its obligations to citizens. Someone will have to bite the bullet. Even some of the co-authors of the current disaster are wrestling with the truth.
Forget avocado toast and streaming subscriptions. We’re already sensing it, but we haven’t yet seen it. Young people are not well-informed, and often actively misled, about what’s rotten in this economic system. But we are seeing the consequences on store shelves and mortgage contracts and we can sense disaster is coming. We’re about to get stuck with the bill.
Spread & Containment
There Goes The Fed’s Inflation Target: Goldman Sees Terminal Rate 100bps Higher At 3.5%
There Goes The Fed’s Inflation Target: Goldman Sees Terminal Rate 100bps Higher At 3.5%
Two years ago, we first said that it’s only a matter…
Share this:

Two years ago, we first said that it's only a matter of time before the Fed admits it is unable to rsolve the so-called "last mile" of inflation and that as a result, the old inflation target of 2% is no longer viable.
At some point Fed will concede it has no control over supply. That's when we will start getting leaks of raising the inflation target
— zerohedge (@zerohedge) June 21, 2022
Then one year ago, we correctly said that while everyone was paying attention elsewhere, the inflation target had already been hiked to 2.8%... on the way to even more increases.
The new inflation target has been set to 2.8%. The rest is just narrative fill for the next 2 years. https://t.co/X1xYkecyPy
— zerohedge (@zerohedge) February 21, 2023
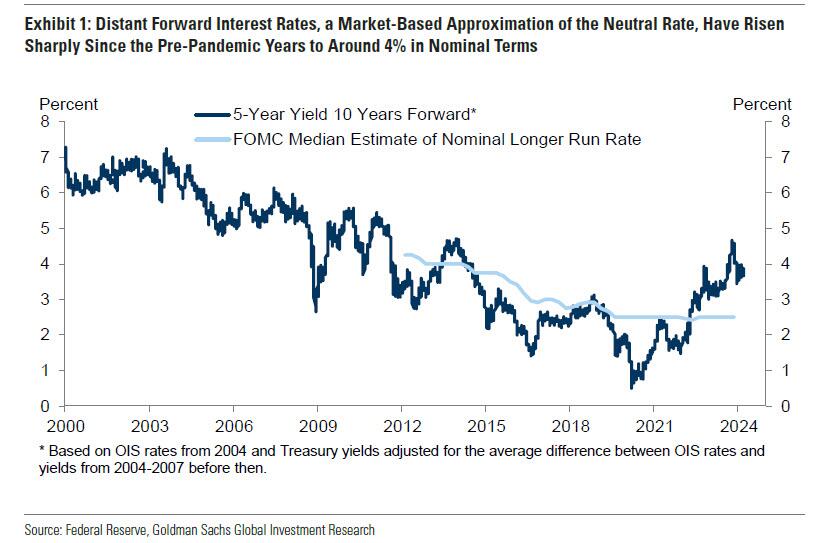
And while the Fed still pretends it can one day lower inflation to 2% even as it prepares to cut rates as soon as June, moments ago Goldman published a note from its economics team which had to balls to finally call a spade a spade, and concluded that - as party of the Fed's next big debate, i.e., rethinking the Neutral rate - both the neutral and terminal rate, a polite euphemism for the inflation target, are much higher than conventional wisdom believes, and that as a result Goldman is "penciling in a terminal rate of 3.25-3.5% this cycle, 100bp above the peak reached last cycle."
There is more in the full Goldman note, but below we excerpt the key fragments:
We argued last cycle that the long-run neutral rate was not as low as widely thought, perhaps closer to 3-3.5% in nominal terms than to 2-2.5%. We have also argued this cycle that the short-run neutral rate could be higher still because the fiscal deficit is much larger than usual—in fact, estimates of the elasticity of the neutral rate to the deficit suggest that the wider deficit might boost the short-term neutral rate by 1-1.5%. Fed economists have also offered another reason why the short-term neutral rate might be elevated, namely that broad financial conditions have not tightened commensurately with the rise in the funds rate, limiting transmission to the economy.
Over the coming year, Fed officials are likely to debate whether the neutral rate is still as low as they assumed last cycle and as the dot plot implies....
...Translation: raising the neutral rate estimate is also the first step to admitting that the traditional 2% inflation target is higher than previously expected. And once the Fed officially crosses that particular Rubicon, all bets are off.
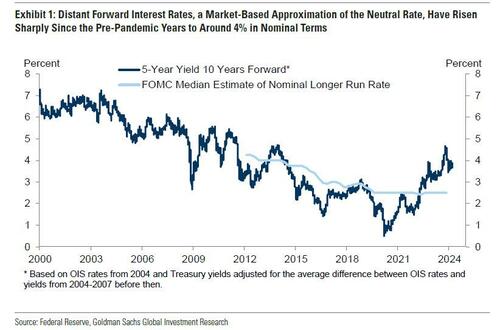
... Their thinking is likely to be influenced by distant forward market rates, which have risen 1-2pp since the pre-pandemic years to about 4%; by model-based estimates of neutral, whose earlier real-time values have been revised up by roughly 0.5pp on average to about 3.5% nominal and whose latest values are little changed; and by their perception of how well the economy is performing at the current level of the funds rate.
The bank's conclusion:
We expect Fed officials to raise their estimates of neutral over time both by raising their long-run neutral rate dots somewhat and by concluding that short-run neutral is currently higher than long-run neutral. While we are fairly confident that Fed officials will not be comfortable leaving the funds rate above 5% indefinitely once inflation approaches 2% and that they will not go all the way back to 2.5% purely in the name of normalization, we are quite uncertain about where in between they will ultimately land.
Because the economy is not sensitive enough to small changes in the funds rate to make it glaringly obvious when neutral has been reached, the terminal or equilibrium rate where the FOMC decides to leave the funds rate is partly a matter of the true neutral rate and partly a matter of the perceived neutral rate. For now, we are penciling in a terminal rate of 3.25-3.5% this cycle, 100bps above the peak reached last cycle. This reflects both our view that neutral is higher than Fed officials think and our expectation that their thinking will evolve.
Not that this should come as a surprise: as a reminder, with the US now $35.5 trillion in debt and rising by $1 trillion every 100 days, we are fast approaching the Minsky Moment, which means the US has just a handful of options left: losing the reserve currency status, QEing the deficit and every new dollar in debt, or - the only viable alternative - inflating it all away. The only question we had before is when do "serious" economists make the same admission.
Meanwhile, nothing changes: total US debt jumps $57BN on March 15, to a record $34.543 trillion.
— zerohedge (@zerohedge) March 19, 2024
Three ways this ends: inflate it away, QE it all, or reserve status collapse
They now have.
And while we have discussed the staggering consequences of raising the inflation target by just 1% from 2% to 3% on everything from markets, to economic growth (instead of doubling every 35 years at 2% inflation target, prices would double every 23 years at 3%), and social cohesion, we will soon rerun the analysis again as the implications are profound. For now all you need to know is that with the US about to implicitly hit the overdrive of dollar devaluation, anything that is non-fiat will be much more preferable over fiat alternatives.
Much more in the full Goldman note available to pro subs in the usual place.
Spread & Containment
Household Net Interest Income Falls As Rates Spike
A Bloomberg article from this morning offered an excellent array of charts detailing the shifts in interest payment flows amid rising rates. The historical…
Share this:

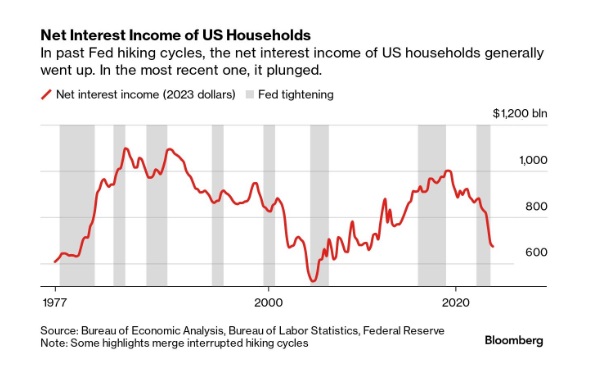
A Bloomberg article from this morning offered an excellent array of charts detailing the shifts in interest payment flows amid rising rates. The historical anomaly was both surprising and contradicted our priors.
10 Key Points:
- Historical Anomaly: This is the first time in the last fifty years that a Federal Reserve rate hike cycle has led to a significant drop in household net interest income.
- Interest Expense Increase: Since the Fed began raising rates in March 2022, Americans’ annual interest expenses on debts like mortgages and credit cards have surged by nearly $420 billion.
- Interest Income Lag: The increase in interest income during the same period was only about $280 billion, resulting in a net decline in household interest income, a departure from past trends.
- Consumer Debt Influence: The recent rate hikes impacted household finances more because of a higher proportion of consumer credit, which adjusts more quickly to rate changes, increasing interest costs.
- Banks and Savers: Banks have been slow to pass on higher interest rates to depositors, and the prolonged period of low rates before 2022 may have discouraged savers from actively seeking better returns.
- Shift in Wealth: There’s been a shift from interest-bearing assets to stocks, with dividends surpassing interest payments as a source of unearned income during the pandemic.
- Distributional Discrepancy: Higher interest rates benefit wealthier individuals who own interest-earning assets, whereas lower-income earners face the brunt of increased debt servicing costs, exacerbating economic inequality.
- Job Market Impact: Typically, Fed rate hikes affect households through the job market, as businesses cut costs, potentially leading to layoffs or wage suppression, though this hasn’t occurred yet in the current cycle.
- Economic Impact: The distribution of interest income and debt servicing means that rate increases transfer money from those more likely to spend (and thus stimulate the economy) to those less likely to increase consumption, potentially dampening economic activity.
- No Immediate Relief: Expectations for the Fed to reduce rates have diminished, indicating that high-interest expenses for households may persist.


Google’s A.I. Fiasco Exposes Deeper Infowarp


Supreme Court Rules Public Officials May Block Their Constituents On Social Media


Greenback Surges after BOJ Hikes and Ends YCC and RBA Delivers a Dovish Hold


There Goes The Fed’s Inflation Target: Goldman Sees Terminal Rate 100bps Higher At 3.5%


Manufacturing and construction vs. the still-inverted yield curve


When words make you sick


Student loan borrowers may finally get answers to loan forgiveness issues


You can strike gold and silver investment opportunities at Costco


Bolsonaro Indicted By Brazilian Police For Falsifying Covid-19 Vaccine Records


Germany Is Running Out Of Money And Debt Levels Are Exploding, Finance Minister Warns
-

 Spread & Containment7 days ago
IFM’s Hat Trick and Reflections On Option-To-Buy M&A
-

 Uncategorized4 weeks ago
All Of The Elements Are In Place For An Economic Crisis Of Staggering Proportions
-

 International2 weeks ago
EyePoint poaches medical chief from Apellis; Sandoz CFO, longtime BioNTech exec to retire
-

 Uncategorized1 month ago
California Counties Could Be Forced To Pay $300 Million To Cover COVID-Era Program
-

 Uncategorized4 weeks ago
Apparel Retailer Express Moving Toward Bankruptcy
-

 Uncategorized1 month ago
Industrial Production Decreased 0.1% in January
-

 International2 weeks ago
Walmart launches clever answer to Target’s new membership program
-

 Uncategorized1 month ago
RFK Jr: The Wuhan Cover-Up & The Rise Of The Biowarfare-Industrial Complex