Money Supply Growth in May Again Surges to An All-Time High
Money Supply Growth in May Again Surges to An All-Time High
Share this:

Money supply growth surged to another all-time high in May, following April's all-time high that came in the wake of unprecedented quantitative easing, central bank asset purchases, and various stimulus packages.
The growth rate has never been higher, with the 1970s as the only period that comes close. It was expected that money supply growth would surge in recent months. This usually happens in the wake of the early months of a recession or financial crisis. The magnitude of the growth rate, however, was unexpected.
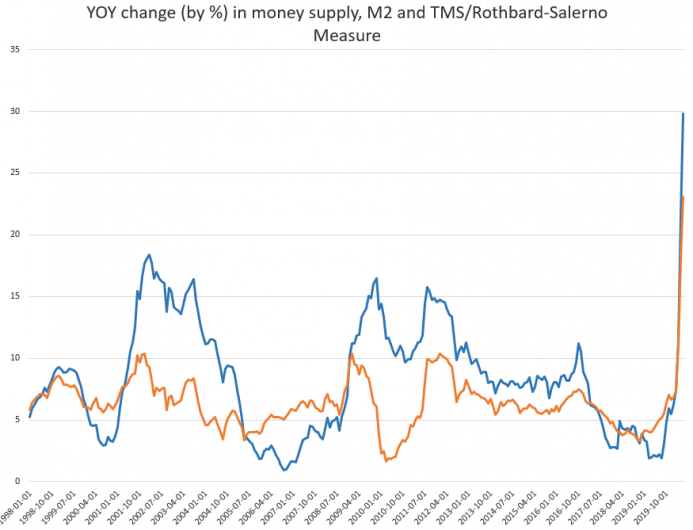
During May 2020, year-over-year (YOY) growth in the money supply was at 29.80 percent. That's up from April's rate of 21.3 percent, and up from May 2019's rate of 2.15 percent. Historically, this is a very large surge in growth both month over month and year over year. It is also quite a reversal from the trend that only just ended in August of last year, when growth rates were nearly bottoming out around 2 percent. In August, the growth rate hit a 120-month low, falling to the lowest growth rates we'd seen since 2007.

The money supply metric used here—the "true" or Rothbard-Salerno money supply measure (TMS)—is the metric developed by Murray Rothbard and Joseph Salerno, and is designed to provide a better measure of money supply fluctuations than M2. The Mises Institute now offers regular updates on this metric and its growth. This measure of the money supply differs from M2 in that it includes Treasury deposits at the Fed (and excludes short-time deposits, traveler's checks, and retail money funds).
The M2 growth rate also increased to historic highs in May, growing 23.09 percent compared to April's growth rate of 18.01 percent. M2 grew 4.2 percent during May of last year. The M2 growth rate had fallen considerably from late 2016 to late 2018, but has been growing again in recent months. As of March, it is following the same trend as TMS.
Money supply growth can often be a helpful measure of economic activity. During periods of economic boom, money supply tends to grow quickly as banks make more loans. Recessions, on the other hand, tend to be preceded by periods of slowdown in rates of money supply growth. However, money supply growth tends to grow out of its low-growth trough well before the onset of recession. As recession nears, the TMS growth rate climbs and becomes larger than the M2 growth rate. This occurred in the early months of the 2002 and the 2009 crises. February 2020 was the first month since late 2008 that the TMS growth rate climbed higher than the M2 growth rate. The TMS growth rate again exceeded M2 in March and April 2020. As of mid-April 2020, it does appear that the decline in money supply growth has again preceded a recession. Although some observers will likely claim that the current economic crisis is a result solely of the COVID-19 panic and resulting government-forced shutdowns, several indicators do suggests that the economy was primed for a recession. The decline in TMS is one of these indicators, as is the late 2019 liquidity crisis in the repo markets. The Fed's moves to drop interest rates and to once again grow its balance sheet speak to the weakness of the economy leading up to April 2020.
After initial balance-shooet growth in late 2019, total Fed assets surged to over 7 trillion in June, setting a new all-time high and propelling the Fed balance sheet far beyond anything seen during the Great Recession's stimulus packages. The Fed's assets are now up more than 680 percent from the period immediately preceeding the 2008 financial crisis.

While Fed asset purchases are not solely responsible for the surge in new money creation, they are certainly a sizable factor. Bank-loan activity has surged as well, also driving new money creation.

In terms of total dollar amounts now extant, the overall M2 total money supply in May was $17.9 trillion and the TMS total was $17.4 trillion. This is an increase of 4.0 trillion in M2, and 3.3 trillion in the TMS.
Uncategorized
These Cities Have The Highest (And Lowest) Share Of Unaffordable Neighborhoods In 2024
These Cities Have The Highest (And Lowest) Share Of Unaffordable Neighborhoods In 2024
Authored by Sam Bourgi via CreditNews.com,
Homeownership…
Share this:


Authored by Sam Bourgi via CreditNews.com,
Homeownership is one of the key pillars of the American dream. But for many families, the idyllic fantasy of a picket fence and backyard barbecues remains just that—a fantasy.
Thanks to elevated mortgage rates, sky-high house prices, and scarce inventory, millions of American families have been locked out of the opportunity to buy a home in many cities.
To shed light on America’s housing affordability crisis, Creditnews Research ranked the 50 most populous cities by the percentage of neighborhoods within reach for the typical married-couple household to buy a home in.
The study reveals a stark reality, with many cities completely out of reach for the most affluent household type. Not only that, the unaffordability has radically worsened in recent years.
Comparing how affordability has changed since Covid, Creditnews Research discovered an alarming pattern—indicating consistently more unaffordable housing in all but three cities.
Fortunately, there’s still hope for households seeking to put down roots in more affordable cities—especially for those looking beyond Los Angeles, New York, Boston, San Jone, and Miami.
The typical American family has a hard time putting down roots in many parts of the country. In 11 of the top 50 cities, at least 50% of neighborhoods are out of reach for the average married-couple household. The affordability gap has widened significantly since Covid; in fact, no major city has reported an improvement in affordability post-pandemic.
Sam Bourgi, Senior Analyst at Creditnews
Key findings
-
The most unaffordable cities are Los Angeles, Boston, St. Louis, and San Jose; in each city, 100% of neighborhoods are out of reach for for married-couple households earning a median income;
-
The most affordable cities are Cleveland, Hartford, and Memphis—in these cities, the typical family can afford all neighborhoods;
-
None of the top 50 cities by population saw an improvement in affordable neighborhoods post-pandemic;
-
California recorded the biggest spike in unaffordable neighborhoods since pre-Covid;
-
The share of unaffordable neighborhoods has increased the most since pre-Covid in San Jose (70 percentage points), San Diego (from 57.8 percentage points), and Riverside-San Bernardino (51.9 percentage points);
-
Only three cities have seen no change in housing affordability since pre-Covid: Cleveland, Memphis, and Hartford. They’re also the only cities that had 0% of unaffordable neighborhoods before Covid.
Cities with the highest share of unaffordable neighborhoods
With few exceptions, the most unaffordable cities for married-couple households tend to be located in some of the nation’s most expensive housing markets.
Four cities in the ranking have an unaffordability percentage of 100%—indicating that the median married-couple household couldn’t qualify for an average home in any neighborhood.
The following are the cities ranked from the least affordable to the most:
-
Los Angeles, CA: Housing affordability in Los Angeles has deteriorated over the last five years, as average incomes have failed to keep pace with rising property values and elevated mortgage rates. The median household income of married-couple families in LA is $117,056, but even at that rate, 100% of the city’s neighborhoods are unaffordable.
-
St. Louis, MO: It may be surprising to see St. Louis ranking among the most unaffordable housing markets for married-couple households. But a closer look reveals that the Mound City was unaffordable even before Covid. In 2019, 98% of the city’s neighborhoods were unaffordable—way worse than Los Angeles, Boston, or San Jose.
-
Boston, MA: Boston’s housing affordability challenges began long before Covid but accelerated after the pandemic. Before Covid, married couples earning a median income were priced out of 90.7% of Boston’s neighborhoods. But that figure has since jumped to 100%, despite a comfortable median household income of $172,223.
-
San Jose, CA: Nestled in Silicon Valley, San Jose has long been one of the most expensive cities for housing in America. But things have gotten far worse since Covid, as 100% of its neighborhoods are now out of reach for the average family. Perhaps the most shocking part is that the median household income for married-couple families is $188,403—much higher than the national average.
-
San Diego, CA: Another California city, San Diego, is among the most unaffordable places in the country. Despite boasting a median married-couple household income of $136,297, 95.6% of the city’s neighborhoods are unaffordable.
-
San Francisco, CA: San Francisco is another California city with a high married-couple median income ($211,585) but low affordability. The percentage of unaffordable neighborhoods for these homebuyers stands at 89.2%.
-
New York, NY: As one of the most expensive cities in America, New York is a difficult housing market for married couples with dual income. New York City’s share of unaffordable neighborhoods is 85.9%, marking a 33.4% rise from pre-Covid times.
-
Miami, FL: Partly due to a population boom post-Covid, Miami is now one of the most unaffordable cities for homebuyers. Roughly four out of five (79.4%) of Miami’s neighborhoods are out of reach price-wise for married-couple families. That’s a 34.7% increase from 2019.
-
Nashville, TN: With Nashville’s population growth rebounding to pre-pandemic levels, the city has also seen greater affordability challenges. In the Music City, 73.7% of neighborhoods are considered unaffordable for married-couple households—an increase of 11.9% from pre-Covid levels.
-
Richmond, VA: Rounding out the bottom 10 is Richmond, where 55.9% of the city’s 161 neighborhoods are unaffordable for married-couple households. That’s an 11.9% increase from pre-Covid levels.
Cities with the lowest share of unaffordable neighborhoods
All the cities in our top-10 ranking have less than 10% unaffordable neighborhoods—meaning the average family can qualify for a home in at least 90% of the city.
Interestingly, these cities are also outside the top 15 cities by population, and eight are in the bottom half.
The following are the cities ranked from the most affordable to the least:
-
Hartford, CT: Hartford ranks first with the percentage of unaffordable neighborhoods at 0%, unchanged since pre-Covid times. Married couples earning a median income of $135,612 can afford to live in any of the city’s 16 neighborhoods. Interestingly, Hartford is the smallest city to rank in the top 10.
-
Memphis, TN: Like Hartford, Memphis has 0% unaffordable neighborhoods, meaning any married couple earning a median income of $101,734 can afford an average homes in any of the city’s 12 neighborhoods. The percentage of unaffordable neighborhoods also stood at 0% before Covid.
-
Cleveland, OH: The Midwestern city of Cleveland is also tied for first, with the percentage of unaffordable neighborhoods at 0%. That means households with a median-couple income of $89,066 can qualify for an average home in all of the city’s neighborhoods. Cleveland is also among the three cities that have seen no change in unaffordability compared to 2019.
-
Minneapolis, MN: The largest city in the top 10, Minneapolis’ share of unaffordable neighborhoods stood at 2.41%, up slightly from 2019. Married couples earning the median income ($149,214) have access to the vast majority of the city’s 83 neighborhoods.
-
Baltimore, MD: Married-couple households in Baltimore earn a median income of $141,634. At that rate, they can afford to live in 97.3% of the city’s 222 neighborhoods, making only 2.7% of neighborhoods unaffordable. That’s up from 0% pre-Covid.
-
Louisville, KY: Louisville is a highly competitive market for married households. For married-couple households earning a median wage, only 3.6% of neighborhoods are unaffordable, up 11.9% from pre-Covid times.
-
Cincinnati, OH: The second Ohio city in the top 10 ranks close to Cleveland in population but has a much higher median married-couple household income of $129,324. Only 3.6% of the city’s neighborhoods are unaffordable, up slightly from pre-pandemic levels.
-
Indianapolis, IN: Another competitive Midwestern market, only 4.4% of Indianapolis is unaffordable, making the vast majority of the city’s 92 neighborhoods accessible to the average married couple. Still, the percentage of unaffordable neighborhoods before Covid was less than 1%.
-
Oklahoma City, OK: Before Covid, Oklahoma City had 0% neighborhoods unaffordable for married-couple households earning the median wage. It has since increased to 4.69%, which is still tiny compared to the national average.
-
Kansas City, MO: Kansas City has one of the largest numbers of neighborhoods in the top 50 cities. Its married-couple residents can afford to live in nearly 95% of them, making only 5.6% of neighborhoods out of reach. Like Indiana, Kansas City’s share of unaffordable neighborhoods was less than 1% before Covid.
The biggest COVID losers
What's particularly astonishing about the current housing market is just how quickly affordability has declined since Covid.
Even factoring in the market correction after the 2022 peak, the price of existing homes is still nearly one-third higher than before Covid. Mortgage rates have also more than doubled since early 2022.
Combined, the rising home prices and interest rates led to the worst mortgage affordability in more than 40 years.
Against this backdrop, it’s hardly surprising that unaffordability increased in 47 of the 50 cities studied and remained flat in the other three. No city reported improved affordability in 2024 compared to 2019.
The biggest increases are led by San Jose (70 percentage points), San Diego (57.8 percentage points), Riverside-San Bernardino (51.9 percentage points), Sacramento (43 percentage points), Orlando (37.4 percentage points), Miami (34.7 percentage points), and New York City (33.4 percentage points).
The following cities in our study are ranked by the largest percentage point change in unaffordable neighborhoods since pre-Covid:
Uncategorized
Your financial plan may be riskier without bitcoin
It might actually be riskier to not have bitcoin in your portfolio than it is to have a small allocation.
Share this:


This article originally appeared in the Sound Advisory blog. Sound Advisory provide financial advisory services and are specialize in educating and guiding clients to thrive financially in a bitcoin-powered world. Click here to learn more.
“Belief is a wise wager. Granted that faith cannot be proved, what harm will come to you if you gamble on its truth and it proves false? If you gain, you gain all; if you lose, you lose nothing. Wager, then, without hesitation, that He exists.”
- Blaise Pascal
Blaise Pascal only lived to age 39 but became world-famous for many contributions in the fields of mathematics, physics, and theology. The above quote encapsulates Pascal’s wager—a philosophical argument for the Christian belief in the existence of God.
The argument's conclusion states that a rational person should live as though God exists. Even if the probability is low, the reward is worth the risk.
Pascal’s wager as a justification for bitcoin? Yes, I’m aware of the fallacies: false dichotomy, appeal to emotion, begging the question, etc. That is not the point. The point is that binary outcomes instigate extreme results, and the game theory of money suggests that it’s a winner-take-all game.
The Pascalian investor: A rational approach to bitcoin
Humanity’s adoption of “the best money over time” mimics a series of binary outcomes—A/B tests.
Throughout history, inferior forms of money have faded as better alternatives emerged (see India’s failed transition to a gold standard). And if bitcoin is trying to be the premier money of the future, it will either succeed or it won’t.
“If you ain’t first, you’re last.” -Ricky Bobby, Talladega Nights, on which monies succeed over time.
So, we can look at bitcoin success similarly to Pascal’s wager—let’s call it Satoshi’s wager. The translated points would go something like this:
- If you own bitcoin early and it becomes a globally valuable money, you gain immensely. ????
- If you own bitcoin and it fails, you’ve lost that value. ????
- If you don’t own bitcoin and it goes to zero, no pain and no gain. ????
- If you don’t own bitcoin and it succeeds, you will have missed out on the significant financial revolution of our lifetimes and fall comparatively behind. ????
If bitcoin is successful, it will be worth far more than it is today and have a massive impact on your financial future. If it fails, the losses are only limited to your exposure. The most that you could lose is the money that you invested.
It is hypothetically possible that bitcoin could be worth 100x more than it is today, but it can only possibly lose 1x its value as it goes to zero. The concept we’re discussing here is asymmetric upside - significant gains with relatively limited downside. In other words, the potential rewards of the investment outweigh the potential risks.
Bitcoin offers an asymmetric upside that makes it a wise investment for most portfolios. Even a small allocation provides potential protection against extreme currency debasement.
Salt, gasoline, and insurance

“Don’t over salt your steak, pour too much gas on the fire, or buy too much insurance.”
A little bit goes a long way, and you can easily overdo it. The same applies when looking at bitcoin in the context of a financial plan.
Bitcoin’s asymmetric upside gives it “insurance-like” qualities, and that insurance pays off very well in times of money printing. This was exemplified in 2020 when bitcoin's value increased over 300% in response to pandemic money printing, far outpacing stocks, gold, and bonds.
Bitcoin offers a similar asymmetric upside today. Bitcoin's supply is capped at 21 million coins, making it resistant to inflationary debasement. In contrast, the dollar's purchasing power consistently declines through unrestrained money printing. History has shown that societies prefer money that is hard to inflate.
If recent rampant inflation is uncontainable and the dollar system falters, bitcoin is well-positioned as a successor. This global monetary A/B test is still early, but given their respective sizes, a little bitcoin can go a long way. If it succeeds, early adopters will benefit enormously compared to latecomers. Of course, there are no guarantees, but the potential reward justifies reasonable exposure despite the risks.
Let’s imagine Nervous Nancy, an extremely conservative investor. She wants to invest but also take the least risk possible. She invests 100% of her money in short-term cash equivalents (short-term treasuries, money markets, CDs, maybe some cash in the coffee can). With this investment allocation, she’s nearly certain to get her initial investment back and receive a modest amount of interest as a gain. However, she has no guarantees that the investment returned to her will purchase the same amount as it used to. Inflation and money printing cause each dollar to be able to purchase less and less over time. Depending on the severity of the inflation, it might not buy anything at all. In other words, she didn’t lose any dollars, but the dollar lost purchasing power.
Now, let’s salt her portfolio with bitcoin.
99% short-term treasuries. 1% bitcoin.
With a 1% allocation, if bitcoin goes to zero overnight, she’ll have only lost a penny on the dollar, and her treasury interest will quickly fill the gap. Not at all catastrophic to her financial future.
However, if the hypothetical hyperinflationary scenario from above plays out and bitcoin grows 100x in purchasing power, she’s saved everything. Metaphorically, her entire dollar house burned down, and “bitcoin insurance” made her whole. Powerful. A little bitcoin salt goes a long way.
(When protecting against the existing system, it’s important to remember that you need to get your bitcoin out of the system. Keeping bitcoin on an exchange or with a counterparty will do you no good if that entity fails. If you view bitcoin as insurance, it’s essential to keep your bitcoin in cold storage and hold your keys. Otherwise, it’s someone else’s insurance.)
When all you have a hammer, everything looks like a…

A construction joke:
There are only three rules to construction: 1.) Always use the right tool for the job! 2.) A hammer is always the right tool! 3.) Anything can be a hammer!
Yeah. That’s what I thought, too. Slightly funny and mostly useless.
But if you spend enough time swinging a hammer, you’ll eventually realize it can be more than it first appears. Not everything is a nail. A hammer can tear down walls, break concrete, tap objects into place, and wiggle other things out. A hammer can create and destroy; it builds tall towers and humbles novice fingers. The use cases expand with the skill of the carpenter.
Like hammers, bitcoin is a monetary tool. And a 1-5% allocator to the asset typically sees a “speculative insurance” use case - valid. Bitcoin is speculative insurance, but it is not only speculative insurance. People invest and save in bitcoin for many different reasons.
I’ve seen people use bitcoin to pursue all of the following use cases:
- Hedging against a financial collapse (speculative insurance)
- Saving for family and future (long-term general savings and safety net)
- Growing a downpayment for a house (medium-term specific savings)
- Shooting for the moon in a manner equivalent to winning the lottery (gambling)
- Opting out of government-run, bank-controlled financial systems (financial optionality)
- Making a quick buck (short-term trading)
- Escaping a hostile country (wealth evacuation)
- Locking away wealth that can’t be confiscated (wealth preservation)
- As a means to influence opinions and gain followers (social status)
- Fix the money and fix the world (mission and purpose)
Keep this in mind when taking other people’s financial advice. They are often playing a different game than you. They have different goals, upbringings, worldviews, family dynamics, and circumstances. Even though they might use the same hammer as you, it could be for a completely different job.
Wrapping Up
A massive allocation to bitcoin may seem crazy to some people, yet perfectly reasonable to others. The same goes for having a 1% allocation.
But, given today’s macroeconomic environment and bitcoin’s trajectory, I find very few use cases where 0% bitcoin makes sense. By not owning bitcoin, you implicitly say that you are 100% certain it will fail and go to zero. Given its 14-year history so far, I’d recommend reducing your confidence. Nobody is 100% right forever. A little salt goes a long way. Your financial plan may be riskier without bitcoin. Diversify accordingly.
“We must learn our limits. We are all something, but none of us are everything.” - Blaise Pascal.
bonds pandemic stocks bitcoin link goldContact
Office: (208)-254-0142
Ste. 205
Eagle, ID 83616
Check the background of your financial professional on FINRA's BrokerCheck.The content is developed from sources believed to be providing accurate information. The information in this material is not intended as tax or legal advice. Please consult legal or tax professionals for specific information regarding your individual situation. Some of this material was developed and produced by FMG Suite to provide information on a topic that may be of interest. FMG Suite is not affiliated with the named representative, broker - dealer, state - or SEC - registered investment advisory firm. The opinions expressed and material provided are for general information, and should not be considered a solicitation for the purchase or sale of any security.
We take protecting your data and privacy very seriously. As of January 1, 2020 the California Consumer Privacy Act (CCPA) suggests the following link as an extra measure to safeguard your data: Do not sell my personal information.
Copyright 2024 FMG Suite.
Sound Advisory, LLC (“SA”) is a registered investment advisor offering advisory services in the State of Idaho and in other jurisdictions where exempt. Registration does not imply a certain level of skill or training. The information on this site is not intended as tax, accounting, or legal advice, as an offer or solicitation of an offer to buy or sell, or as an endorsement of any company, security, fund, or other securities or non-securities offering. This information should not be relied upon as the sole factor in an investment-making decision. Past performance is no indication of future results. Investment in securities involves significant risk and has the potential for partial or complete loss of funds invested. It should not be assumed that any recommendations made will be profitable or equal any performance noted on this site.
The information on this site is provided “AS IS” and without warranties of any kind, either express or implied. To the fullest extent permissible pursuant to applicable laws, Sound Advisory LLC disclaims all warranties, express or implied, including, but not limited to, implied warranties of merchantability, non-infringement, and suitability for a particular purpose.
SA does not warrant that the information on this site will be free from error. Your use of the information is at your sole risk. Under no circumstances shall SA be liable for any direct, indirect, special or consequential damages that result from the use of, or the inability to use, the information provided on this site, even if SA or an SA authorized representative has been advised of the possibility of such damages. Information contained on this site should not be considered a solicitation to buy, an offer to sell, or a recommendation of any security in any jurisdiction where such offer, solicitation, or recommendation would be unlawful or unauthorized.
International
Shakira’s net worth
After 12 albums, a tax evasion case, and now a towering bronze idol sculpted in her image, how much is Shakira worth more than 4 decades into her care…
Share this:

Shakira’s considerable net worth is no surprise, given her massive popularity in Latin America, the U.S., and elsewhere.
In fact, the belly-dancing contralto queen is the second-wealthiest Latin-America-born pop singer of all time after Gloria Estefan. (Interestingly, Estefan actually helped a young Shakira translate her breakout album “Laundry Service” into English, hugely propelling her stateside success.)
Since releasing her first record at age 13, Shakira has spent decades recording albums in both Spanish and English and performing all over the world. Over the course of her 40+ year career, she helped thrust Latin pop music into the American mainstream, paving the way for the subsequent success of massively popular modern acts like Karol G and Bad Bunny.
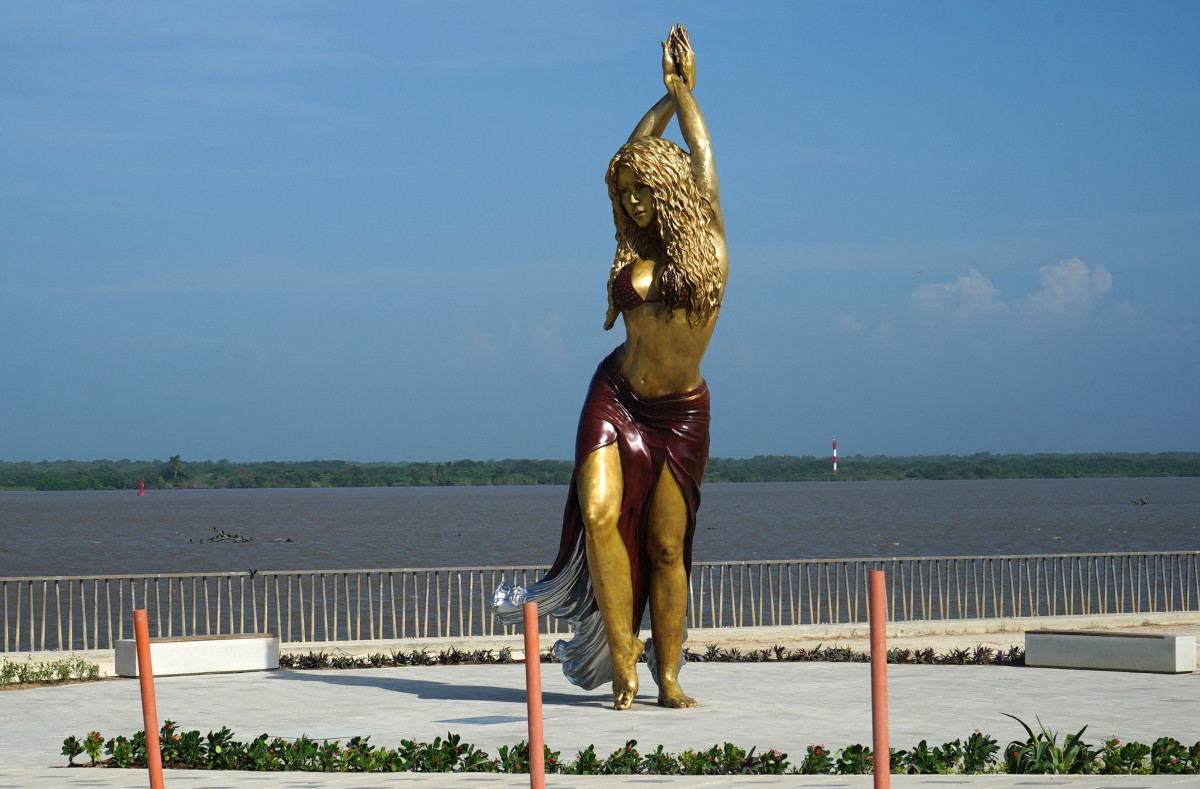
In December 2023, a 21-foot-tall beachside bronze statue of the “Hips Don’t Lie” singer was unveiled in her Colombian hometown of Barranquilla, making her a permanent fixture in the city’s skyline and cementing her legacy as one of Latin America’s most influential entertainers.
After 12 albums, a plethora of film and television appearances, a highly publicized tax evasion case, and now a towering bronze idol sculpted in her image, how much is Shakira worth? What does her income look like? And how does she spend her money?
How much is Shakira worth?
In late 2023, Spanish sports and lifestyle publication Marca reported Shakira’s net worth at $400 million, citing Forbes as the figure’s source (although Forbes’ profile page for Shakira does not list a net worth — and didn’t when that article was published).
Most other sources list the singer’s wealth at an estimated $300 million, and almost all of these point to Celebrity Net Worth — a popular but dubious celebrity wealth estimation site — as the source for the figure.
A $300 million net worth would make Shakira the third-richest Latina pop star after Gloria Estefan ($500 million) and Jennifer Lopez ($400 million), and the second-richest Latin-America-born pop singer after Estefan (JLo is Puerto Rican but was born in New York).
Shakira’s income: How much does she make annually?
Entertainers like Shakira don’t have predictable paychecks like ordinary salaried professionals. Instead, annual take-home earnings vary quite a bit depending on each year’s album sales, royalties, film and television appearances, streaming revenue, and other sources of income. As one might expect, Shakira’s earnings have fluctuated quite a bit over the years.
From June 2018 to June 2019, for instance, Shakira was the 10th highest-earning female musician, grossing $35 million, according to Forbes. This wasn’t her first time gracing the top 10, though — back in 2012, she also landed the #10 spot, bringing in $20 million, according to Billboard.
In 2023, Billboard listed Shakira as the 16th-highest-grossing Latin artist of all time.

How much does Shakira make from her concerts and tours?
A large part of Shakira’s wealth comes from her world tours, during which she sometimes sells out massive stadiums and arenas full of passionate fans eager to see her dance and sing live.
According to a 2020 report by Pollstar, she sold over 2.7 million tickets across 190 shows that grossed over $189 million between 2000 and 2020. This landed her the 19th spot on a list of female musicians ranked by touring revenue during that period. In 2023, Billboard reported a more modest touring revenue figure of $108.1 million across 120 shows.
In 2003, Shakira reportedly generated over $4 million from a single show on Valentine’s Day at Foro Sol in Mexico City. 15 years later, in 2018, Shakira grossed around $76.5 million from her El Dorado World Tour, according to Touring Data.
Related: RuPaul's net worth: Everything to know about the cultural icon and force behind 'Drag Race'
How much has Shakira made from her album sales?
According to a 2023 profile in Variety, Shakira has sold over 100 million records throughout her career. “Laundry Service,” the pop icon’s fifth studio album, was her most successful, selling over 13 million copies worldwide, according to TheRichest.
Exactly how much money Shakira has taken home from her album sales is unclear, but in 2008, it was widely reported that she signed a 10-year contract with LiveNation to the tune of between $70 and $100 million to release her subsequent albums and manage her tours.

How much did Shakira make from her Super Bowl and World Cup performances?
Shakira co-wrote one of her biggest hits, “Waka Waka (This Time for Africa),” after FIFA selected her to create the official anthem for the 2010 World Cup in South Africa. She performed the song, along with several of her existing fan-favorite tracks, during the event’s opening ceremonies. TheThings reported in 2023 that the song generated $1.4 million in revenue, citing Popnable for the figure.
A decade later, 2020’s Superbowl halftime show featured Shakira and Jennifer Lopez as co-headliners with guest performances by Bad Bunny and J Balvin. The 14-minute performance was widely praised as a high-energy celebration of Latin music and dance, but as is typical for Super Bowl shows, neither Shakira nor JLo was compensated beyond expenses and production costs.
The exposure value that comes with performing in the Super Bowl Halftime Show, though, is significant. It is typically the most-watched television event in the U.S. each year, and in 2020, a 30-second Super Bowl ad spot cost between $5 and $6 million.
How much did Shakira make as a coach on “The Voice?”
Shakira served as a team coach on the popular singing competition program “The Voice” during the show’s fourth and sixth seasons. On the show, celebrity musicians coach up-and-coming amateurs in a team-based competition that eventually results in a single winner. In 2012, The Hollywood Reporter wrote that Shakira’s salary as a coach on “The Voice” was $12 million.
Related: John Cena's net worth: The wrestler-turned-actor's investments, businesses, and more
How does Shakira spend her money?
Shakira doesn’t just make a lot of money — she spends it, too. Like many wealthy entertainers, she’s purchased her share of luxuries, but Barranquilla’s barefoot belly dancer is also a prolific philanthropist, having donated tens of millions to charitable causes throughout her career.
Private island
Back in 2006, she teamed up with Roger Waters of Pink Floyd fame and Spanish singer Alejandro Sanz to purchase Bonds Cay, a 550-acre island in the Bahamas, which was listed for $16 million at the time.
Along with her two partners in the purchase, Shakira planned to develop the island to feature housing, hotels, and an artists’ retreat designed to host a revolving cast of artists-in-residence. This plan didn’t come to fruition, though, and as of this article’s last update, the island was once again for sale on Vladi Private Islands.
Real estate and vehicles
Like most wealthy celebs, Shakira’s portfolio of high-end playthings also features an array of luxury properties and vehicles, including a home in Barcelona, a villa in Cyprus, a Miami mansion, and a rotating cast of Mercedes-Benz vehicles.
Philanthropy and charity
Shakira doesn’t just spend her massive wealth on herself; the “Queen of Latin Music” is also a dedicated philanthropist and regularly donates portions of her earnings to the Fundación Pies Descalzos, or “Barefoot Foundation,” a charity she founded in 1997 to “improve the education and social development of children in Colombia, which has suffered decades of conflict.” The foundation focuses on providing meals for children and building and improving educational infrastructure in Shakira’s hometown of Barranquilla as well as four other Colombian communities.
In addition to her efforts with the Fundación Pies Descalzos, Shakira has made a number of other notable donations over the years. In 2007, she diverted a whopping $40 million of her wealth to help rebuild community infrastructure in Peru and Nicaragua in the wake of a devastating 8.0 magnitude earthquake. Later, during the COVID-19 pandemic in 2020, Shakira donated a large supply of N95 masks for healthcare workers and ventilators for hospital patients to her hometown of Barranquilla.
Back in 2010, the UN honored Shakira with a medal to recognize her dedication to social justice, at which time the Director General of the International Labour Organization described her as a “true ambassador for children and young people.”

Shakira’s tax fraud scandal: How much did she pay?
In 2018, prosecutors in Spain initiated a tax evasion case against Shakira, alleging she lived primarily in Spain from 2012 to 2014 and therefore failed to pay around $14.4 million in taxes to the Spanish government. Spanish law requires anyone who is “domiciled” (i.e., living primarily) in Spain for more than half of the year to pay income taxes.
During the period in question, Shakira listed the Bahamas as her primary residence but did spend some time in Spain, as she was dating Gerard Piqué, a professional footballer and Spanish citizen. The couple’s first son, Milan, was also born in Barcelona during this period.
Shakira maintained that she spent far fewer than 183 days per year in Spain during each of the years in question. In an interview with Elle Magazine, the pop star opined that “Spanish tax authorities saw that I was dating a Spanish citizen and started to salivate. It's clear they wanted to go after that money no matter what."
Prosecutors in the case sought a fine of almost $26 million and a possible eight-year prison stint, but in November of 2023, Shakira took a deal to close the case, accepting a fine of around $8 million and a three-year suspended sentence to avoid going to trial. In reference to her decision to take the deal, Shakira stated, "While I was determined to defend my innocence in a trial that my lawyers were confident would have ruled in my favour [had the trial proceeded], I have made the decision to finally resolve this matter with the best interest of my kids at heart who do not want to see their mom sacrifice her personal well-being in this fight."
How much did the Shakira statue in Barranquilla cost?
In late 2023, a 21-foot-tall bronze likeness of Shakira was unveiled on a waterfront promenade in Barranquilla. The city’s then-mayor, Jaime Pumarejo, commissioned Colombian sculptor Yino Márquez to create the statue of the city’s treasured pop icon, along with a sculpture of the city’s coat of arms.
According to the New York Times, the two sculptures cost the city the equivalent of around $180,000. A plaque at the statue’s base reads, “A heart that composes, hips that don’t lie, an unmatched talent, a voice that moves the masses and bare feet that march for the good of children and humanity.”
Related: Taylor Swift net worth: The most successful entertainer joins the billionaire's club
bonds pandemic covid-19 real estate africa mexico spain

IFM’s Hat Trick and Reflections On Option-To-Buy M&A


Q4 Update: Delinquencies, Foreclosures and REO


Net Zero, The Digital Panopticon, & The Future Of Food


Pharma industry reputation remains steady at a ‘new normal’ after Covid, Harris Poll finds


For-profit nursing homes are cutting corners on safety and draining resources with financial shenanigans − especially at midsize chains that dodge public scrutiny


The Question You Should Ask Whenever You’re Wrong


Trump nearly derailed democracy once − here’s what to watch out for in reelection campaign


Part 1: Current State of the Housing Market; Overview for mid-March 2024


MIPIM 2024 Reflects Mixed Feelings on CRE Recovery


Riley Gaines Explains How Women’s Sports Are Rigged To Promote The Trans Agenda
-

 Uncategorized3 weeks ago
All Of The Elements Are In Place For An Economic Crisis Of Staggering Proportions
-

 International6 days ago
EyePoint poaches medical chief from Apellis; Sandoz CFO, longtime BioNTech exec to retire
-

 Uncategorized4 weeks ago
California Counties Could Be Forced To Pay $300 Million To Cover COVID-Era Program
-

 Uncategorized3 weeks ago
Apparel Retailer Express Moving Toward Bankruptcy
-

 Uncategorized4 weeks ago
Industrial Production Decreased 0.1% in January
-

 International6 days ago
Walmart launches clever answer to Target’s new membership program
-

 Uncategorized4 weeks ago
RFK Jr: The Wuhan Cover-Up & The Rise Of The Biowarfare-Industrial Complex
-

 Uncategorized3 weeks ago
GOP Efforts To Shore Up Election Security In Swing States Face Challenges