Uncategorized
Monetary Support Suggests Bear Market Is Possibly Over
Could massive monetary support have softened the deep bear market many expected? It is an interesting question. Particularly given the Fed has hiked rates…
Share this:

Could massive monetary support have softened the deep bear market many expected? It is an interesting question. Particularly given the Fed has hiked rates at one of the most aggressive paces in history. Combined with inverted yield curves, surging debt levels, and weak economic data, a recession and bear market seem assured.
I always shudder at the four most dangerous words in investing, “this time is different.“ However, could the massive amount of monetary support combined with trillions in Government spending change historical outcomes?
One of my favorite Twitter follows, @MichaelAArouet, recently posted a compelling question.
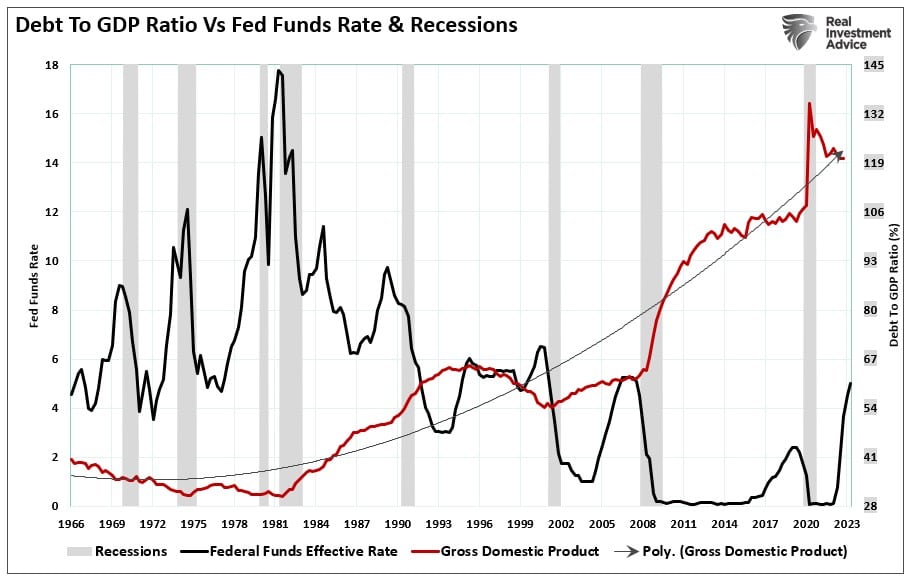
“What are the odds that the fastest tightening cycle combined with highest debt/GDP level will end up in a soft landing?”
Here is the chart to support his question.
What is clear is that since 1981, the Federal Government has been on a rampant spending spree. To Michael’s point, low-interest rates supported increasing debt levels, and previous rate hike cycles inevitably ended in recession. Such is logical given that rate increases divert economic spending to debt service.
Such is seen in the chart below, which shows that increased debt levels subsequently lower economic growth rates. (The chart uses data based on CBO projections for debt levels and the BEA projections for potential inflation-adjusted GDP.)

While politicians consistently focus on spending more money to help the citizenry, the outcomes have been far less favorable. As discussed in “Taking Risk Is No Longer Necessary,” since 1982, economic prosperity has shifted from the middle class to the top 10% of income earners.

This shift from the middle class, combined with the massive fiscal and monetary supports of 2020 and 2021, introduces an exciting dynamic concerning Michael’s question. One issue many may be overlooking is that despite higher rates, the economy, and by extension, the stock market, maybe more resilient than expected.
Monetary Support Is Still High
One aspect of monetary support that much of the mainstream media overlooks was the massive Inflation Reduction Act of $1.7 Trillion that was on top of the more than $5 Trillion in direct stimulus payments during the Pandemic era.
Beginning in 2000, the “money supply” as a percentage of GDP grew sharply, with each Administration ratcheting up debt to pay for politically driven agendas. However, in 2020, monetary support changed radically by sending checks directly to households. That resulted in both a “surge” in economic activity and inflation due to “reopening” from an artificially manufactured “shutdown.”

As shown, M2, a measure of monetary liquidity, is still highly elevated as a percentage of GDP. This “pig in the python” still moves through the economic system. The massive deviation from previous growth trends will require an extended time frame for reversion. Such is why calls for a “recession” have been early, and the data continues to surprise economists.
Federal Spending Ramps Up
However, another overlooked aspect of monetary support could keep the economy from a more profound recessionary drag. In 2022 the Biden Administration was finally able to force through $1.7 Trillion in Federal spending in the Inflation Reduction Act. Those funds are getting spent in 2023 to start various projects, which will provide economic support in the near term, regardless of their success or failure.

In the first quarter of 2023, Federal spending increased by 3% on a quarter-over-quarter basis. Using that increase as a baseline, we can project federal spending through the end of the year, which will eclipse $7 Trillion at the current run rate. Of course, if the current Republican-controlled house can negotiate some spending cuts while raising the debt ceiling, that number will decline.
The point here is that while many economists and analysts are predicting a sharp slowdown and recession later this year, which is indeed possible, there is still a lot of liquidity supporting economic activity in the near term.

Is The Worst Behind Us?
As investors, we must ask whether the market suggests the worse is behind us. Since October, stocks have been in a decent rally, with the Nasdaq leading the charge in 2023. That rally is noteworthy because the stock market leads the economy by 6-9 months.
However, this is the dichotomy that investors currently face. We have repeatedly noted the various recessionary indicators such as inverted yield curves, the 6-month rate of change of the Leading Economic Index, and our Economic composite. These indicators have a flawless track record of predicting recessions over time. I have shown both the LEI rate-of-change and the Economic Composite below. As noted, the current index readings are at levels consistent with recessions since 1974.

Given that economic data is primarily lagging, it will be some time before we know whether the current readings coincided with a recessionary slowdown. However, as noted by the two horizontal lines, outside of the 2020 and 2008 recessions, current readings are near levels that previously denoted recessionary lows.
If such is the case, it is possible the recent rally in stocks, a leading indicator, combined with the ongoing monetary supports, suggests we may start to see some improvement in the economic data. If such is the case, then on an inflation-adjusted basis, the corrective market drawdown did achieve historical norms for recessionary periods.

Furthermore, the correction process may be complete as it held critical support at the 200-week moving average. Such remains support for the market since the 2009 lows. Again, if we see some improvement in sentiment-driven and data-driven surveys, such will confirm the market is leading the economic progress.

Conclusion
There are many arguments against the current market rally, given the lag effect of the Fed’s most aggressive rate hiking campaign since the 1970s. Furthermore, those rate hikes, and much tighter bank lending standards, will eventually reduce consumer spending. Such was the point made in “NFIB Sends Recession Alert.” To wit.
“However, tighter bank lending standards have always been a strong “recession alert” signal as it correlates with changes in retail sales. (Retail sales comprise roughly 40% of PCE, which is 70% of the GDP calculation.)”

I am not suggesting the markets, and the economy, won’t potentially struggle in the months ahead. However, we could avoid a deep economic due to the still massive amounts of monetary support in the system.
These competing forces will make investing more difficult until those monetary excesses reverse.
One thing is for sure. The volatility we have seen in the markets over the last year will likely continue. Investors should expect lower rates of future returns. Of course, that will result from much less monetary support and lower economic growth rates resulting from increased debt levels.
But that is an article for next time.
The post Monetary Support Suggests Bear Market Is Possibly Over appeared first on RIA.
recession pandemic stimulus economic growth reopening nasdaq stocks fed recession gdp interest rates consumer spending stimulusUncategorized
One city held a mass passport-getting event
A New Orleans congressman organized a way for people to apply for their passports en masse.
Share this:


While the number of Americans who do not have a passport has dropped steadily from more than 80% in 1990 to just over 50% now, a lack of knowledge around passport requirements still keeps a significant portion of the population away from international travel.
Over the four years that passed since the start of covid-19, passport offices have also been dealing with significant backlog due to the high numbers of people who were looking to get a passport post-pandemic.
Related: Here is why it is (still) taking forever to get a passport
To deal with these concurrent issues, the U.S. State Department recently held a mass passport-getting event in the city of New Orleans. Called the "Passport Acceptance Event," the gathering was held at a local auditorium and invited residents of Louisiana’s 2nd Congressional District to complete a passport application on-site with the help of staff and government workers.
'Come apply for your passport, no appointment is required'
"Hey #LA02," Rep. Troy A. Carter Sr. (D-LA), whose office co-hosted the event alongside the city of New Orleans, wrote to his followers on Instagram (META) . "My office is providing passport services at our #PassportAcceptance event. Come apply for your passport, no appointment is required."
More Travel:
- A new travel term is taking over the internet (and reaching airlines and hotels)
- The 10 best airline stocks to buy now
- Airlines see a new kind of traveler at the front of the plane
The event was held on March 14 from 10 a.m. to 1 p.m. While it was designed for those who are already eligible for U.S. citizenship rather than as a way to help non-citizens with immigration questions, it helped those completing the application for the first time fill out forms and make sure they have the photographs and identity documents they need. The passport offices in New Orleans where one would normally have to bring already-completed forms have also been dealing with lines and would require one to book spots weeks in advance.
These are the countries with the highest-ranking passports in 2024
According to Carter Sr.'s communications team, those who submitted their passport application at the event also received expedited processing of two to three weeks (according to the State Department's website, times for regular processing are currently six to eight weeks).
While Carter Sr.'s office has not released the numbers of people who applied for a passport on March 14, photos from the event show that many took advantage of the opportunity to apply for a passport in a group setting and get expedited processing.
Every couple of months, a new ranking agency puts together a list of the most and least powerful passports in the world based on factors such as visa-free travel and opportunities for cross-border business.
In January, global citizenship and financial advisory firm Arton Capital identified United Arab Emirates as having the most powerful passport in 2024. While the United States topped the list of one such ranking in 2014, worsening relations with a number of countries as well as stricter immigration rules even as other countries have taken strides to create opportunities for investors and digital nomads caused the American passport to slip in recent years.
A UAE passport grants holders visa-free or visa-on-arrival access to 180 of the world’s 198 countries (this calculation includes disputed territories such as Kosovo and Western Sahara) while Americans currently have the same access to 151 countries.
stocks pandemic covid-19 grantsUncategorized
Fast-food chain closes restaurants after Chapter 11 bankruptcy
Several major fast-food chains recently have struggled to keep restaurants open.
Share this:


Competition in the fast-food space has been brutal as operators deal with inflation, consumers who are worried about the economy and their jobs and, in recent months, the falling cost of eating at home.
Add in that many fast-food chains took on more debt during the covid pandemic and that labor costs are rising, and you have a perfect storm of problems.
It's a situation where Restaurant Brands International (QSR) has suffered as much as any company.
Related: Wendy's menu drops a fan favorite item, adds something new
Three major Burger King franchise operators filed for bankruptcy in 2023, and the chain saw hundreds of stores close. It also saw multiple Popeyes franchisees move into bankruptcy, with dozens of locations closing.
RBI also stepped in and purchased one of its key franchisees.
"Carrols is the largest Burger King franchisee in the United States today, operating 1,022 Burger King restaurants in 23 states that generated approximately $1.8 billion of system sales during the 12 months ended Sept. 30, 2023," RBI said in a news release. Carrols also owns and operates 60 Popeyes restaurants in six states."
The multichain company made the move after two of its large franchisees, Premier Kings and Meridian, saw multiple locations not purchased when they reached auction after Chapter 11 bankruptcy filings. In that case, RBI bought select locations but allowed others to close.
Image source: Chen Jianli/Xinhua via Getty
Another fast-food chain faces bankruptcy problems
Bojangles may not be as big a name as Burger King or Popeye's, but it's a popular chain with more than 800 restaurants in eight states.
"Bojangles is a Carolina-born restaurant chain specializing in craveable Southern chicken, biscuits and tea made fresh daily from real recipes, and with a friendly smile," the chain says on its website. "Founded in 1977 as a single location in Charlotte, our beloved brand continues to grow nationwide."
Like RBI, Bojangles uses a franchise model, which makes it dependent on the financial health of its operators. The company ultimately saw all its Maryland locations close due to the financial situation of one of its franchisees.
Unlike. RBI, Bojangles is not public — it was taken private by Durational Capital Management LP and Jordan Co. in 2018 — which means the company does not disclose its financial information to the public.
That makes it hard to know whether overall softness for the brand contributed to the chain seeing its five Maryland locations after a Chapter 11 bankruptcy filing.
Bojangles has a messy bankruptcy situation
Even though the locations still appear on the Bojangles website, they have been shuttered since late 2023. The locations were operated by Salim Kakakhail and Yavir Akbar Durranni. The partners operated under a variety of LLCs, including ABS Network, according to local news channel WUSA9.
The station reported that the owners face a state investigation over complaints of wage theft and fraudulent W2s. In November Durranni and ABS Network filed for bankruptcy in New Jersey, WUSA9 reported.
"Not only do former employees say these men owe them money, WUSA9 learned the former owners owe the state, too, and have over $69,000 in back property taxes."
Former employees also say that the restaurant would regularly purchase fried chicken from Popeyes and Safeway when it ran out in their stores, the station reported.
Bojangles sent the station a comment on the situation.
"The franchisee is no longer in the Bojangles system," the company said. "However, it is important to note in your coverage that franchisees are independent business owners who are licensed to operate a brand but have autonomy over many aspects of their business, including hiring employees and payroll responsibilities."
Kakakhail and Durranni did not respond to multiple requests for comment from WUSA9.
bankruptcy pandemicUncategorized
Industrial Production Increased 0.1% in February
From the Fed: Industrial Production and Capacity Utilization
Industrial production edged up 0.1 percent in February after declining 0.5 percent in January. In February, the output of manufacturing rose 0.8 percent and the index for mining climbed 2.2 p…
Share this:


Industrial production edged up 0.1 percent in February after declining 0.5 percent in January. In February, the output of manufacturing rose 0.8 percent and the index for mining climbed 2.2 percent. Both gains partly reflected recoveries from weather-related declines in January. The index for utilities fell 7.5 percent in February because of warmer-than-typical temperatures. At 102.3 percent of its 2017 average, total industrial production in February was 0.2 percent below its year-earlier level. Capacity utilization for the industrial sector remained at 78.3 percent in February, a rate that is 1.3 percentage points below its long-run (1972–2023) average.Click on graph for larger image.
emphasis added
This graph shows Capacity Utilization. This series is up from the record low set in April 2020, and above the level in February 2020 (pre-pandemic).
Capacity utilization at 78.3% is 1.3% below the average from 1972 to 2022. This was below consensus expectations.
Note: y-axis doesn't start at zero to better show the change.
 The second graph shows industrial production since 1967.
Industrial production increased to 102.3. This is above the pre-pandemic level.
Industrial production was above consensus expectations.


Key shipping company files for Chapter 11 bankruptcy


These Cities Have The Highest (And Lowest) Share Of Unaffordable Neighborhoods In 2024


The Question You Should Ask Whenever You’re Wrong


Tight inventory and frustrated buyers challenge agents in Virginia


Walmart and Target make key self-checkout changes to fight theft


Industrial Production Increased 0.1% in February


Your financial plan may be riskier without bitcoin
Key shipping company files Chapter 11 bankruptcy


Futures Rise To New Record High Ahead Of Data Deluge


One city held a mass passport-getting event
-

 Uncategorized3 weeks ago
All Of The Elements Are In Place For An Economic Crisis Of Staggering Proportions
-

 International1 week ago
EyePoint poaches medical chief from Apellis; Sandoz CFO, longtime BioNTech exec to retire
-

 Uncategorized4 weeks ago
California Counties Could Be Forced To Pay $300 Million To Cover COVID-Era Program
-

 Uncategorized3 weeks ago
Apparel Retailer Express Moving Toward Bankruptcy
-

 Uncategorized4 weeks ago
Industrial Production Decreased 0.1% in January
-

 International1 week ago
Walmart launches clever answer to Target’s new membership program
-

 Spread & Containment3 days ago
IFM’s Hat Trick and Reflections On Option-To-Buy M&A
-

 Uncategorized4 weeks ago
RFK Jr: The Wuhan Cover-Up & The Rise Of The Biowarfare-Industrial Complex