Uncategorized
Mirion Warrants – Nuclear Insurance
I recently took a position on warrants that trade on Mirion Technologies (NYSE: MIR, warrants trading as MIR.WS). My average entry was under a dollar per…
Share this:

I recently took a position on warrants that trade on Mirion Technologies (NYSE: MIR, warrants trading as MIR.WS). My average entry was under a dollar per warrant.
Nuclear Insurance
There are a small number of companies out there that specifically deal with the nuclear industry and even less that are pure plays. You can invest in generalized engineering companies like Fluor (NYSE: FLR) or GE (NYSE: GE), but they have a lot of non-nuclear operations which dilutes the sector interest to an insignificant level. You can also invest in power generation (e.g. Tokyo Electric, 9501.JP), but power itself is a commodity and you are investing in commodity-like characteristics. Likewise the same can be said for Uranium producers like Cameco (TSX: CCO). There are a handful of firms that can be considered pure plays.
One of the historical pure plays in this sector was a radiation detection company called Landauer (formerly NYSE: LDR), but in 2017 they were taken off the public market via acquisition by Fortive (NYSE: FTV), a very large diversified instrumentation company. Another one that I have written about in the past is BWX Technologies (NYSE: BWXT), which its primary moneymaker is producing nuclear reactors for US Navy vessels, but for various reasons I divested myself of this investment earlier this year.
Mirion is a pure play. It is an aggregation of various products relating to radiation biophysics, including medical imaging and also industrial imaging and the like as it relates to the radiological side of things.
I want to clarify the term nuclear insurance. It is specifically looking for a company that will rise in price dramatically whenever there are threats of nuclear catastrophes, likely due to geopolitical concerns or improper operations of nuclear reactors. To be clear, this is assuming that financial markets will still be functional after such an event – if this is of the scale where you have thousands of nukes thrown across the planet, there will be bigger problems to deal with!
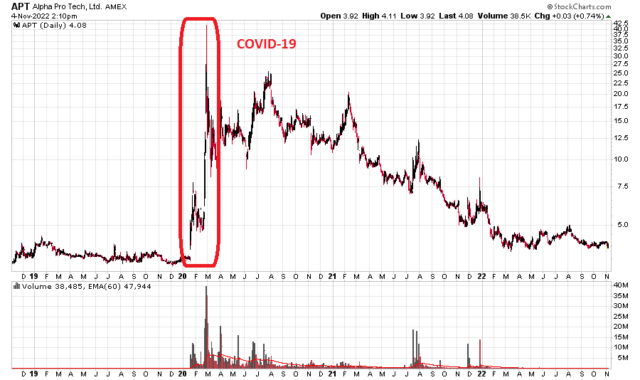
The general theme of this trade is thinking of the biological analogy of what happened with Alpha Pro Tech (TSX: APT), a personal protective equipment manufacturer, during the onset of Covid-19:
This company rose by a factor of about 10x from early January to March 2020 when things got really hot and heavy. I would suspect in a nuclear scenario, Mirion would exhibit a similar price curve and hence the ‘insurance’ as probably every other component in the stock market would evaporate at about the same speed as something at ground zero.
Mirion, the company

This trade would be so much more attractive had the corporate entity had better characteristics, but sadly it does not.
Mirion can be described as a broken SPAC offering, going public in October of 2021. The predecessor name was “GS ACQUISITION HOLDINGS CORP II” and merged into what is Mirion today. It was the typical arrangement, going ‘public’ at $10/share with some warrants. Any investors in the SPAC post-closing (who are these people??) have lost money. As of April 2022, about 40% of the company economically is owned by Goldman Sachs entities. 20% are owned by two other hedge funds. The long-time founder and CEO owns about 2% of the stock. The Goldman entities are actively divesting stock – indeed, the principal officers have a listed occupation as “Goldman Sachs” which is amusing in itself. I’m sure the follow question gets asked at cocktail parties: “What do you do for work?” Answer: “Oh, I’m a Goldman Sachs”.
The corporation has a dual class structure, but the second class of stock does not convey any disproportionate privileges.
I’ve discussed above what the company actually does, and it is not a fly-by-night operation. They have about 2,600 employees, and 75 US patents (which you can search for and contain headlines that are in the relevant domain area).
The big problem is financial. The company has a balance sheet issue, and even worse, they don’t make that much money. Note the market cap of the company at a $6 stock price is about $1.25 billion. They got rightfully slammed after their third quarter report. It was awful.
Looking at their Q3-2022 report, the balance sheet has $58 million in cash and $808 million in debt. The only silver lining on the balance sheet is that the debt is in the form of a floating rate (LIBOR plus 275bps) secured loan that does not mature until October 2028, which is a huge time runway for them to figure things out.
The bad news is that the company is cash flow negative. Management talks about positive “adjusted EBITDA” this and that, but in reality, they are bleeding cash. They need to raise their prices and get their cost structure in line, especially now that LIBOR is rising like a piece of Styrofoam rising from the middle of the ocean.
I will spare the quantitative analysis other than to say that while the TTM price-to-sales is very roughly 2x (with companies such as TDY or FTV at 5x and 4x, respectively), the cash generation situation is just awful. This is not an attractive company using trailing financial metrics.
That said, it is in an industry which is relatively inelastic in terms of consumption preferences – companies that need the product are not going to suddenly defer their purchases. As a result, a general economic recession is not as likely to affect Mirion as it would for some other industrial suppliers.
The warrants

The warrants have a headline expiration date of August 20, 2025 and a strike price of $11.50. This is about 2.8 years to expiry. They are trading around 95 cents at the moment. I will humble-brag that my last purchased tranche to finish my trade was at 80 cents.
It might appear to be a bad deal considering the common stock is trading at half the price of the warrant strike price.
However, when it comes to warrants, they are not always traded like standardized options.
When reading the fine print of the Mirion Warrants, the most relevant non-standard clause governs the option of the company to exercise the warrants if the common stock trades above US$18/share, which will enable the holder to receive 0.361 shares of MIR at a 10 cent exercise price at expiration:

Mirion also has the right to exercise the warrants above US$10/share and the holders have a month to decide if they want the number of shares in the table or whether to take the warrants the ‘conventional’ way. I do not know any scenario where Mirion would want to force the conversion of warrants, but perhaps one of my readers can enlighten me.
Back to nuclear insurance
If there is a relevant nuclear event, I would anticipate the warrants would appreciate significantly beyond their current trading price. As there is time value remaining on these financial products, I would suspect in the worst case scenario in a couple years that I would be able to get out for moderate losses. Again, this is insurance more than anything else. And heaven forbid, if the company gets its cash flow situation in line and actually starts to learn to how to make profits, the stock will appreciate on its own.
This is a small position, I do not intend to make it larger, and the chance of making a loss is relatively high. I share this research for you.
recession covid-19 tsx recessionUncategorized
Homes listed for sale in early June sell for $7,700 more
New Zillow research suggests the spring home shopping season may see a second wave this summer if mortgage rates fall
The post Homes listed for sale in…
Share this:


- A Zillow analysis of 2023 home sales finds homes listed in the first two weeks of June sold for 2.3% more.
- The best time to list a home for sale is a month later than it was in 2019, likely driven by mortgage rates.
- The best time to list can be as early as the second half of February in San Francisco, and as late as the first half of July in New York and Philadelphia.
Spring home sellers looking to maximize their sale price may want to wait it out and list their home for sale in the first half of June. A new Zillow® analysis of 2023 sales found that homes listed in the first two weeks of June sold for 2.3% more, a $7,700 boost on a typical U.S. home.
The best time to list consistently had been early May in the years leading up to the pandemic. The shift to June suggests mortgage rates are strongly influencing demand on top of the usual seasonality that brings buyers to the market in the spring. This home-shopping season is poised to follow a similar pattern as that in 2023, with the potential for a second wave if the Federal Reserve lowers interest rates midyear or later.
The 2.3% sale price premium registered last June followed the first spring in more than 15 years with mortgage rates over 6% on a 30-year fixed-rate loan. The high rates put home buyers on the back foot, and as rates continued upward through May, they were still reassessing and less likely to bid boldly. In June, however, rates pulled back a little from 6.79% to 6.67%, which likely presented an opportunity for determined buyers heading into summer. More buyers understood their market position and could afford to transact, boosting competition and sale prices.
The old logic was that sellers could earn a premium by listing in late spring, when search activity hit its peak. Now, with persistently low inventory, mortgage rate fluctuations make their own seasonality. First-time home buyers who are on the edge of qualifying for a home loan may dip in and out of the market, depending on what’s happening with rates. It is almost certain the Federal Reserve will push back any interest-rate cuts to mid-2024 at the earliest. If mortgage rates follow, that could bring another surge of buyers later this year.
Mortgage rates have been impacting affordability and sale prices since they began rising rapidly two years ago. In 2022, sellers nationwide saw the highest sale premium when they listed their home in late March, right before rates barreled past 5% and continued climbing.
Zillow’s research finds the best time to list can vary widely by metropolitan area. In 2023, it was as early as the second half of February in San Francisco, and as late as the first half of July in New York. Thirty of the top 35 largest metro areas saw for-sale listings command the highest sale prices between May and early July last year.
Zillow also found a wide range in the sale price premiums associated with homes listed during those peak periods. At the hottest time of the year in San Jose, homes sold for 5.5% more, a $88,000 boost on a typical home. Meanwhile, homes in San Antonio sold for 1.9% more during that same time period.
| Metropolitan Area | Best Time to List | Price Premium | Dollar Boost |
| United States | First half of June | 2.3% | $7,700 |
| New York, NY | First half of July | 2.4% | $15,500 |
| Los Angeles, CA | First half of May | 4.1% | $39,300 |
| Chicago, IL | First half of June | 2.8% | $8,800 |
| Dallas, TX | First half of June | 2.5% | $9,200 |
| Houston, TX | Second half of April | 2.0% | $6,200 |
| Washington, DC | Second half of June | 2.2% | $12,700 |
| Philadelphia, PA | First half of July | 2.4% | $8,200 |
| Miami, FL | First half of June | 2.3% | $12,900 |
| Atlanta, GA | Second half of June | 2.3% | $8,700 |
| Boston, MA | Second half of May | 3.5% | $23,600 |
| Phoenix, AZ | First half of June | 3.2% | $14,700 |
| San Francisco, CA | Second half of February | 4.2% | $50,300 |
| Riverside, CA | First half of May | 2.7% | $15,600 |
| Detroit, MI | First half of July | 3.3% | $7,900 |
| Seattle, WA | First half of June | 4.3% | $31,500 |
| Minneapolis, MN | Second half of May | 3.7% | $13,400 |
| San Diego, CA | Second half of April | 3.1% | $29,600 |
| Tampa, FL | Second half of June | 2.1% | $8,000 |
| Denver, CO | Second half of May | 2.9% | $16,900 |
| Baltimore, MD | First half of July | 2.2% | $8,200 |
| St. Louis, MO | First half of June | 2.9% | $7,000 |
| Orlando, FL | First half of June | 2.2% | $8,700 |
| Charlotte, NC | Second half of May | 3.0% | $11,000 |
| San Antonio, TX | First half of June | 1.9% | $5,400 |
| Portland, OR | Second half of April | 2.6% | $14,300 |
| Sacramento, CA | First half of June | 3.2% | $17,900 |
| Pittsburgh, PA | Second half of June | 2.3% | $4,700 |
| Cincinnati, OH | Second half of April | 2.7% | $7,500 |
| Austin, TX | Second half of May | 2.8% | $12,600 |
| Las Vegas, NV | First half of June | 3.4% | $14,600 |
| Kansas City, MO | Second half of May | 2.5% | $7,300 |
| Columbus, OH | Second half of June | 3.3% | $10,400 |
| Indianapolis, IN | First half of July | 3.0% | $8,100 |
| Cleveland, OH | First half of July | 3.4% | $7,400 |
| San Jose, CA | First half of June | 5.5% | $88,400 |
The post Homes listed for sale in early June sell for $7,700 more appeared first on Zillow Research.
federal reserve pandemic home sales mortgage rates interest ratesUncategorized
February Employment Situation
By Paul Gomme and Peter Rupert The establishment data from the BLS showed a 275,000 increase in payroll employment for February, outpacing the 230,000…
Share this:


By Paul Gomme and Peter Rupert
The establishment data from the BLS showed a 275,000 increase in payroll employment for February, outpacing the 230,000 average over the previous 12 months. The payroll data for January and December were revised down by a total of 167,000. The private sector added 223,000 new jobs, the largest gain since May of last year.

Temporary help services employment continues a steep decline after a sharp post-pandemic rise.


Average hours of work increased from 34.2 to 34.3. The increase, along with the 223,000 private employment increase led to a hefty increase in total hours of 5.6% at an annualized rate, also the largest increase since May of last year.

The establishment report, once again, beat “expectations;” the WSJ survey of economists was 198,000. Other than the downward revisions, mentioned above, another bit of negative news was a smallish increase in wage growth, from $34.52 to $34.57.

The household survey shows that the labor force increased 150,000, a drop in employment of 184,000 and an increase in the number of unemployed persons of 334,000. The labor force participation rate held steady at 62.5, the employment to population ratio decreased from 60.2 to 60.1 and the unemployment rate increased from 3.66 to 3.86. Remember that the unemployment rate is the number of unemployed relative to the labor force (the number employed plus the number unemployed). Consequently, the unemployment rate can go up if the number of unemployed rises holding fixed the labor force, or if the labor force shrinks holding the number unemployed unchanged. An increase in the unemployment rate is not necessarily a bad thing: it may reflect a strong labor market drawing “marginally attached” individuals from outside the labor force. Indeed, there was a 96,000 decline in those workers.


Earlier in the week, the BLS announced JOLTS (Job Openings and Labor Turnover Survey) data for January. There isn’t much to report here as the job openings changed little at 8.9 million, the number of hires and total separations were little changed at 5.7 million and 5.3 million, respectively.

As has been the case for the last couple of years, the number of job openings remains higher than the number of unemployed persons.

Also earlier in the week the BLS announced that productivity increased 3.2% in the 4th quarter with output rising 3.5% and hours of work rising 0.3%.

The bottom line is that the labor market continues its surprisingly (to some) strong performance, once again proving stronger than many had expected. This strength makes it difficult to justify any interest rate cuts soon, particularly given the recent inflation spike.
unemployment pandemic unemploymentUncategorized
Mortgage rates fall as labor market normalizes
Jobless claims show an expanding economy. We will only be in a recession once jobless claims exceed 323,000 on a four-week moving average.
Share this:


Everyone was waiting to see if this week’s jobs report would send mortgage rates higher, which is what happened last month. Instead, the 10-year yield had a muted response after the headline number beat estimates, but we have negative job revisions from previous months. The Federal Reserve’s fear of wage growth spiraling out of control hasn’t materialized for over two years now and the unemployment rate ticked up to 3.9%. For now, we can say the labor market isn’t tight anymore, but it’s also not breaking.
The key labor data line in this expansion is the weekly jobless claims report. Jobless claims show an expanding economy that has not lost jobs yet. We will only be in a recession once jobless claims exceed 323,000 on a four-week moving average.
From the Fed: In the week ended March 2, initial claims for unemployment insurance benefits were flat, at 217,000. The four-week moving average declined slightly by 750, to 212,250
Below is an explanation of how we got here with the labor market, which all started during COVID-19.
1. I wrote the COVID-19 recovery model on April 7, 2020, and retired it on Dec. 9, 2020. By that time, the upfront recovery phase was done, and I needed to model out when we would get the jobs lost back.
2. Early in the labor market recovery, when we saw weaker job reports, I doubled and tripled down on my assertion that job openings would get to 10 million in this recovery. Job openings rose as high as to 12 million and are currently over 9 million. Even with the massive miss on a job report in May 2021, I didn’t waver.
Currently, the jobs openings, quit percentage and hires data are below pre-COVID-19 levels, which means the labor market isn’t as tight as it once was, and this is why the employment cost index has been slowing data to move along the quits percentage.

3. I wrote that we should get back all the jobs lost to COVID-19 by September of 2022. At the time this would be a speedy labor market recovery, and it happened on schedule, too
Total employment data
4. This is the key one for right now: If COVID-19 hadn’t happened, we would have between 157 million and 159 million jobs today, which would have been in line with the job growth rate in February 2020. Today, we are at 157,808,000. This is important because job growth should be cooling down now. We are more in line with where the labor market should be when averaging 140K-165K monthly. So for now, the fact that we aren’t trending between 140K-165K means we still have a bit more recovery kick left before we get down to those levels.

From BLS: Total nonfarm payroll employment rose by 275,000 in February, and the unemployment rate increased to 3.9 percent, the U.S. Bureau of Labor Statistics reported today. Job gains occurred in health care, in government, in food services and drinking places, in social assistance, and in transportation and warehousing.
Here are the jobs that were created and lost in the previous month:

In this jobs report, the unemployment rate for education levels looks like this:
- Less than a high school diploma: 6.1%
- High school graduate and no college: 4.2%
- Some college or associate degree: 3.1%
- Bachelor’s degree or higher: 2.2%

Today’s report has continued the trend of the labor data beating my expectations, only because I am looking for the jobs data to slow down to a level of 140K-165K, which hasn’t happened yet. I wouldn’t categorize the labor market as being tight anymore because of the quits ratio and the hires data in the job openings report. This also shows itself in the employment cost index as well. These are key data lines for the Fed and the reason we are going to see three rate cuts this year.
recession unemployment covid-19 fed federal reserve mortgage rates recession recovery unemployment


-

 Uncategorized3 weeks ago
All Of The Elements Are In Place For An Economic Crisis Of Staggering Proportions
-

 Uncategorized1 month ago
Cathie Wood sells a major tech stock (again)
-

 Uncategorized3 weeks ago
California Counties Could Be Forced To Pay $300 Million To Cover COVID-Era Program
-

 Uncategorized2 weeks ago
Apparel Retailer Express Moving Toward Bankruptcy
-

 Uncategorized4 weeks ago
Industrial Production Decreased 0.1% in January
-

 International3 days ago
Walmart launches clever answer to Target’s new membership program
-

 International3 days ago
EyePoint poaches medical chief from Apellis; Sandoz CFO, longtime BioNTech exec to retire
-

 Uncategorized3 weeks ago
RFK Jr: The Wuhan Cover-Up & The Rise Of The Biowarfare-Industrial Complex