Government
#MacroView: CBO – The “One-Way Trip” Of American Debt
#MacroView: CBO – The “One-Way Trip” Of American Debt
Share this:

We have frequently discussed the “one-way trip” of American debt and the long, slow slide into the “Japanification” of America.
The amount of outstanding debt, and the subsequent deficit, has long been a problem in the U.S. For the last two decades, policymakers have made annual promises for more substantial economic growth. Yet with each passing year, growth rates weaken, and economic prosperity worsens. As we discussed pre-pandemic in “Economy Should Grow Faster Than Debt:”
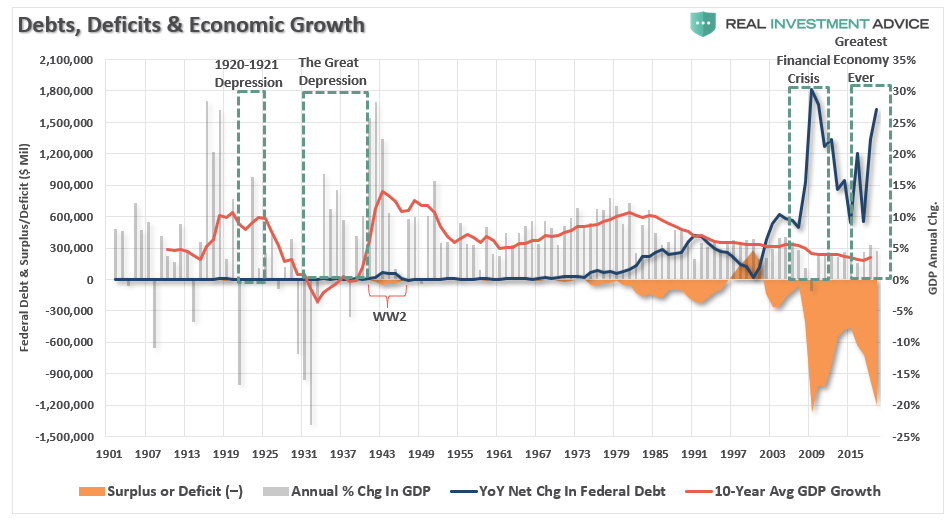
“The chart below shows the deficit, 10-year average GDP growth, and the annual change in Federal Debt. The problem should be obvious. Since the Federal government began ramping up debt, and running deficits, growth continues to deteriorate. Such is not a coincidence.”

“The government is already running a massive deficit. It also expects to issue another $1.5-2 Trillion in debt during the next fiscal year. The efficacy of ‘deficit spending’ in terms of its impact on economic growth has been greatly marginalized.”
Spending Without Controls
Since then, Government debt surged n response to the “Coronavirus Pandemic,” to provide fiscal support. Concurrently, the drop in economic activity has dramatically reduced Federal revenues to pay for it all.

Unfortunately, this also means the CBO’s already catastrophic long-term debt forecast has become even more disastrous. It already requires over 100% of all Federal revenues to cover mandatory spending. Such was a point in the most recent Long-Term Budget Outlook report from the CBO.
“Once the effects of decreased revenues associated with the economic disruption caused by the pandemic dissipate, revenues measured as a percentage of GDP will rise. After 2025, CBO’s projections increase largely due to scheduled changes in tax rules. Such includes the expiration of nearly all of the changes made to individual income taxes by the 2017 tax act. After 2030, they continue to rise. But that growth does not keep pace with the growth in spending. Most of the long-term growth in revenues is attributable to the increasing share of income that is pushed into higher tax brackets.” – CBO

Deficits Set To Grow
Of course, to fund the excess spending by the Government, the debt burden and subsequent debt service will continue to grow.
“Deficits increase again in the last few years of the decade, reaching 5.3 percent of GDP in 2030. That level is historically high and more than one-and-a-half times the average over the past 50 years (3.0 percent of GDP).
In the second and third decades of CBO’s projection period, deficits grow from 5.3 percent of GDP in 2030 to 9.0 percent by 2040. They hit 12.6 percent by 2050. Over that 20-year period, deficits average 9.0 percent of GDP, which is higher than their 50-year average of 3.0 percent of GDP.” – CBO

Spending Set To Increase
Note what is driving the deficit. The mandatory spending, comprised of Social Security, Medicare, Medicaid, prescription drug benefits, and the Affordable Care Act, also includes interest on the debt.

Given rising debt levels erode economic growth, as it displaces revenue from productive uses, debt continues to grow to support “mandatory spending” requirements.
“Debt continues to increase in most years thereafter, reaching 195 percent of GDP by 2050. That amount of debt will be the highest in the nation’s history, and will increase further. High and rising federal debt makes the economy more vulnerable to rising interest rates and, depending on how the debt is financed, rising inflation. The growing debt burden also raises borrowing costs and slows the growth of the economy and national income. There is an increased risk of a fiscal crisis or a gradual decline in the value of Treasury securities.” – CBO

As the CBO further explains:
Debt as a percentage of GDP will increase in most years as the government incurs budget deficits larger than the growth of the economy. If current laws generally remain unchanged, federal deficits will be substantially larger over the next 30 years than over the past 50 years. In CBO’s projections, deficits rise after 2030 as mandatory spending, outlays for the major health care programs, and interest payments grow faster than revenues.
Debt Likely To Be Worse
The Committee For A Responsible Federal Budget just released the following analysis:
“Projected debt in 2050 is nearly five times higher than the 50-year average of 42 percent of GDP. It will be on track to double the previous record of 106 set just after World War II. In dollar terms, debt will rise from nearly $21 trillion today to $121 trillion by 2050.”

“Actual debt levels could grow significantly faster than CBO forecasts. Under our alternative scenario, debt would reach 246 percent of GDP in 2050.
Even under current law, high and rising debt represents a large fiscal gap. For example, CBO estimates policymakers would need to enact 3.6 percent of GDP in spending cuts and tax increases starting in 2025. Such actions could restore the debt to 2019 levels by 2050. That’s the equivalent of cutting all spending by one-sixth or increasing all revenue by one-fifth.”
Neither of those things will happen.
Spending Will Be Higher
As we showed previously, at the end of 2019, we were already spending more than we brought in.
“According to the Center On Budget & Policy Priorities, roughly 75% of every tax dollar goes to non-productive spending.”

“Here is the real kicker. In 2018, the Federal Government spent $4.48 Trillion, which was equivalent to 22% of the nation’s entire nominal GDP. Of that total spending, ONLY $3.5 Trillion was financed by Federal revenues and $986 billion was financed through debt.
In other words, if 75% of all expenditures is social welfare and interest on the debt, those payments required $3.36 Trillion of the $3.5 Trillion (or 96%) of revenue coming in.”
The CFRB report expands on this analysis with future projections.
Rising debt and deficits are driven by a disconnect between spending and revenue. CBO expects spending to grow rapidly over the next three decades and revenue to grow gradually.
The 11.7 percent of GDP growth in Social Security, health, and interest costs explains more than the entire 10.3 percent growth in total spending through 2030. Meanwhile, revenue will only grow by 2.3 percent of GDP – failing to cover the rising cost.

Here is the real problem as we advance:
Rising health and retirement costs and insufficient funding also puts trust funds in danger. On a combined basis, CBO estimates the Social Security trust funds will run out in calendar year 2031 and face a 75-year shortfall of 1.6 percent of GDP, or 4.7 percent of taxable payroll.
Slower Economic Growth
The underlying structure of the economy continues to weaken as non-productive debt erodes growth. As discussed just recently in “Debts, Deficits & The Path To MMT:”
“The relevance of debt growth versus economic growth is all too evident. When debt issuance exploded under the Obama administration and accelerated under President Trump, it has taken an ever-increasing amount of debt to generate $1 of economic growth.”

Such reckless abandon by politicians is simply due to a lack of “experience” with the consequences of debt.
However, as the CFRB stated:
“Unfortunately, the actual fiscal situation could turn out to be even worse than CBO projects.
CBO estimates stabilizing debt at 2019 levels would require annual tax and spending adjustments between 2025 and 2050. Such would be equivalent to 3.6 percent of GDP. A carefully crafted package could be phased in gradually, targeted to ask the most from those who can best afford it. It could be designed to improve economic growth and thus reduce the burden of any adjustments. However, there is no magic wand we can wave to fix these problems
While policymakers should prioritize addressing the current pandemic and economic crisis, they cannot and should not continue to ignore our dangerous long-term fiscal situation.”
Ratcheting Growth Down Again
As the CFRB states, ignoring the issue will only lead to longer-term declines in economic growth and prosperity.
Before the “Financial Crisis,” the economy had a linear growth trend of real GDP of 3.2%. Following the 2008 recession, the growth rate dropped to the exponential growth trend of roughly 2.2%. Instead of reducing the debt problems, unproductive debt and leverage increased.

The “COVID-19″ crisis led to a debt surge to new highs. Such will result in a retardation of economic growth to 1.5% or less, as discussed recently. Simultaneously, the stock market may rise due to massive Fed liquidity, but only the 10% of the population owning 88% of the market benefits. In the future, the economic bifurcation will deepen to the point where 5% of the population owns virtually all of it.
As I noted previously, it now requires $7.42 of debt to create $1 of economic growth, which will only worsen as the debt continues to expand at the expense of more robust rates of growth.

That is not economic prosperity. It is a distortion of economics.
Hypocritical
The CBO’s latest budget projections confirm what we, and the CRFB, have been warning about. The current Administration has taken a path of fiscal irresponsibility, which will take an already dismal fiscal situation and made it worse.
While “conservative” Republicans continually chastised the previous Administration for running trillion-dollar deficits, the Republicans have now decided trillion-dollar deficits are acceptable.
That is entirely hypocritical.
Given the flaws in the CBO’s calculations, their current projections of multi-trillion deficits next year, and exceeding that mark every year after, will likely turn out to be overly optimistic.
Notably, the projected budget deficits in the coming decade are “full-employment” deficits. Such is significant because, while budget deficits can help recessions by providing an economic stimulus, there are good reasons we should be retrenching during good economic times, including the one we are in now.
Conclusion
As President Kennedy once said:
“The time to repair the roof is when the sun is shining.”
Instead, we seem to have just removed the roof altogether.
The fact that debt and deficits had risen under conditions of full employment suggests a more profound underlying fiscal problem existed and has now worsened.
The CBO’s budget projections are a harsh reminder of the consequences of debt and deficits.
“The longer policymakers wait to fix the debt, the harder and costlier it will get. That fiscal gap would grow to 4.4 percent of GDP if action was delayed until 2030, or 5.9 percent if delayed until 2035. Delaying action means the necessary changes will be spread among fewer people. Policymakers will have less ability to carefully target adjustments. And ultimately, it will be harder to phase in new policies or give families and businesses time to prepare and adjust for them.” – CFRB
It is just a function of time until the “bill comes due.”
As we concluded previously, you can make choices today, which may be unpopular, and induce short-term pain for a more robust economy tomorrow. Or, you can wait until creditors force those painful choices upon you all at once.
The post #MacroView: CBO – The “One-Way Trip” Of American Debt appeared first on RIA.
International
Four Years Ago This Week, Freedom Was Torched
Four Years Ago This Week, Freedom Was Torched
Authored by Jeffrey Tucker via The Brownstone Institute,
"Beware the Ides of March,” Shakespeare…
Share this:


Authored by Jeffrey Tucker via The Brownstone Institute,
"Beware the Ides of March,” Shakespeare quotes the soothsayer’s warning Julius Caesar about what turned out to be an impending assassination on March 15. The death of American liberty happened around the same time four years ago, when the orders went out from all levels of government to close all indoor and outdoor venues where people gather.
It was not quite a law and it was never voted on by anyone. Seemingly out of nowhere, people who the public had largely ignored, the public health bureaucrats, all united to tell the executives in charge – mayors, governors, and the president – that the only way to deal with a respiratory virus was to scrap freedom and the Bill of Rights.
And they did, not only in the US but all over the world.
The forced closures in the US began on March 6 when the mayor of Austin, Texas, announced the shutdown of the technology and arts festival South by Southwest. Hundreds of thousands of contracts, of attendees and vendors, were instantly scrapped. The mayor said he was acting on the advice of his health experts and they in turn pointed to the CDC, which in turn pointed to the World Health Organization, which in turn pointed to member states and so on.
There was no record of Covid in Austin, Texas, that day but they were sure they were doing their part to stop the spread. It was the first deployment of the “Zero Covid” strategy that became, for a time, official US policy, just as in China.
It was never clear precisely who to blame or who would take responsibility, legal or otherwise.
This Friday evening press conference in Austin was just the beginning. By the next Thursday evening, the lockdown mania reached a full crescendo. Donald Trump went on nationwide television to announce that everything was under control but that he was stopping all travel in and out of US borders, from Europe, the UK, Australia, and New Zealand. American citizens would need to return by Monday or be stuck.
Americans abroad panicked while spending on tickets home and crowded into international airports with waits up to 8 hours standing shoulder to shoulder. It was the first clear sign: there would be no consistency in the deployment of these edicts.
There is no historical record of any American president ever issuing global travel restrictions like this without a declaration of war. Until then, and since the age of travel began, every American had taken it for granted that he could buy a ticket and board a plane. That was no longer possible. Very quickly it became even difficult to travel state to state, as most states eventually implemented a two-week quarantine rule.
The next day, Friday March 13, Broadway closed and New York City began to empty out as any residents who could went to summer homes or out of state.
On that day, the Trump administration declared the national emergency by invoking the Stafford Act which triggers new powers and resources to the Federal Emergency Management Administration.
In addition, the Department of Health and Human Services issued a classified document, only to be released to the public months later. The document initiated the lockdowns. It still does not exist on any government website.
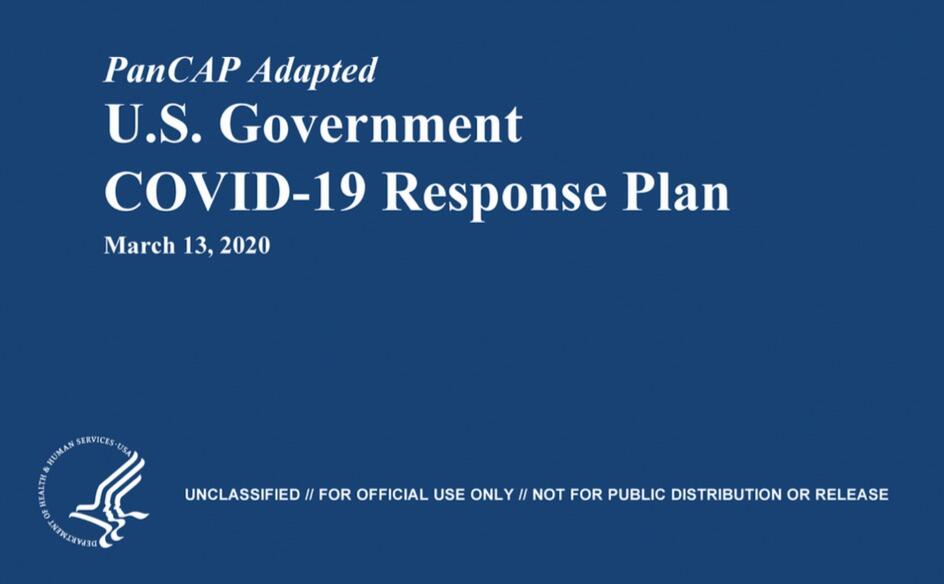
The White House Coronavirus Response Task Force, led by the Vice President, will coordinate a whole-of-government approach, including governors, state and local officials, and members of Congress, to develop the best options for the safety, well-being, and health of the American people. HHS is the LFA [Lead Federal Agency] for coordinating the federal response to COVID-19.
Closures were guaranteed:
Recommend significantly limiting public gatherings and cancellation of almost all sporting events, performances, and public and private meetings that cannot be convened by phone. Consider school closures. Issue widespread ‘stay at home’ directives for public and private organizations, with nearly 100% telework for some, although critical public services and infrastructure may need to retain skeleton crews. Law enforcement could shift to focus more on crime prevention, as routine monitoring of storefronts could be important.
In this vision of turnkey totalitarian control of society, the vaccine was pre-approved: “Partner with pharmaceutical industry to produce anti-virals and vaccine.”
The National Security Council was put in charge of policy making. The CDC was just the marketing operation. That’s why it felt like martial law. Without using those words, that’s what was being declared. It even urged information management, with censorship strongly implied.
The timing here is fascinating. This document came out on a Friday. But according to every autobiographical account – from Mike Pence and Scott Gottlieb to Deborah Birx and Jared Kushner – the gathered team did not meet with Trump himself until the weekend of the 14th and 15th, Saturday and Sunday.
According to their account, this was his first real encounter with the urge that he lock down the whole country. He reluctantly agreed to 15 days to flatten the curve. He announced this on Monday the 16th with the famous line: “All public and private venues where people gather should be closed.”
This makes no sense. The decision had already been made and all enabling documents were already in circulation.
There are only two possibilities.
One: the Department of Homeland Security issued this March 13 HHS document without Trump’s knowledge or authority. That seems unlikely.
Two: Kushner, Birx, Pence, and Gottlieb are lying. They decided on a story and they are sticking to it.
Trump himself has never explained the timeline or precisely when he decided to greenlight the lockdowns. To this day, he avoids the issue beyond his constant claim that he doesn’t get enough credit for his handling of the pandemic.
With Nixon, the famous question was always what did he know and when did he know it? When it comes to Trump and insofar as concerns Covid lockdowns – unlike the fake allegations of collusion with Russia – we have no investigations. To this day, no one in the corporate media seems even slightly interested in why, how, or when human rights got abolished by bureaucratic edict.
As part of the lockdowns, the Cybersecurity and Infrastructure Security Agency, which was and is part of the Department of Homeland Security, as set up in 2018, broke the entire American labor force into essential and nonessential.
They also set up and enforced censorship protocols, which is why it seemed like so few objected. In addition, CISA was tasked with overseeing mail-in ballots.
Only 8 days into the 15, Trump announced that he wanted to open the country by Easter, which was on April 12. His announcement on March 24 was treated as outrageous and irresponsible by the national press but keep in mind: Easter would already take us beyond the initial two-week lockdown. What seemed to be an opening was an extension of closing.
This announcement by Trump encouraged Birx and Fauci to ask for an additional 30 days of lockdown, which Trump granted. Even on April 23, Trump told Georgia and Florida, which had made noises about reopening, that “It’s too soon.” He publicly fought with the governor of Georgia, who was first to open his state.
Before the 15 days was over, Congress passed and the president signed the 880-page CARES Act, which authorized the distribution of $2 trillion to states, businesses, and individuals, thus guaranteeing that lockdowns would continue for the duration.
There was never a stated exit plan beyond Birx’s public statements that she wanted zero cases of Covid in the country. That was never going to happen. It is very likely that the virus had already been circulating in the US and Canada from October 2019. A famous seroprevalence study by Jay Bhattacharya came out in May 2020 discerning that infections and immunity were already widespread in the California county they examined.
What that implied was two crucial points: there was zero hope for the Zero Covid mission and this pandemic would end as they all did, through endemicity via exposure, not from a vaccine as such. That was certainly not the message that was being broadcast from Washington. The growing sense at the time was that we all had to sit tight and just wait for the inoculation on which pharmaceutical companies were working.
By summer 2020, you recall what happened. A restless generation of kids fed up with this stay-at-home nonsense seized on the opportunity to protest racial injustice in the killing of George Floyd. Public health officials approved of these gatherings – unlike protests against lockdowns – on grounds that racism was a virus even more serious than Covid. Some of these protests got out of hand and became violent and destructive.
Meanwhile, substance abuse rage – the liquor and weed stores never closed – and immune systems were being degraded by lack of normal exposure, exactly as the Bakersfield doctors had predicted. Millions of small businesses had closed. The learning losses from school closures were mounting, as it turned out that Zoom school was near worthless.
It was about this time that Trump seemed to figure out – thanks to the wise council of Dr. Scott Atlas – that he had been played and started urging states to reopen. But it was strange: he seemed to be less in the position of being a president in charge and more of a public pundit, Tweeting out his wishes until his account was banned. He was unable to put the worms back in the can that he had approved opening.
By that time, and by all accounts, Trump was convinced that the whole effort was a mistake, that he had been trolled into wrecking the country he promised to make great. It was too late. Mail-in ballots had been widely approved, the country was in shambles, the media and public health bureaucrats were ruling the airwaves, and his final months of the campaign failed even to come to grips with the reality on the ground.
At the time, many people had predicted that once Biden took office and the vaccine was released, Covid would be declared to have been beaten. But that didn’t happen and mainly for one reason: resistance to the vaccine was more intense than anyone had predicted. The Biden administration attempted to impose mandates on the entire US workforce. Thanks to a Supreme Court ruling, that effort was thwarted but not before HR departments around the country had already implemented them.
As the months rolled on – and four major cities closed all public accommodations to the unvaccinated, who were being demonized for prolonging the pandemic – it became clear that the vaccine could not and would not stop infection or transmission, which means that this shot could not be classified as a public health benefit. Even as a private benefit, the evidence was mixed. Any protection it provided was short-lived and reports of vaccine injury began to mount. Even now, we cannot gain full clarity on the scale of the problem because essential data and documentation remains classified.
After four years, we find ourselves in a strange position. We still do not know precisely what unfolded in mid-March 2020: who made what decisions, when, and why. There has been no serious attempt at any high level to provide a clear accounting much less assign blame.
Not even Tucker Carlson, who reportedly played a crucial role in getting Trump to panic over the virus, will tell us the source of his own information or what his source told him. There have been a series of valuable hearings in the House and Senate but they have received little to no press attention, and none have focus on the lockdown orders themselves.
The prevailing attitude in public life is just to forget the whole thing. And yet we live now in a country very different from the one we inhabited five years ago. Our media is captured. Social media is widely censored in violation of the First Amendment, a problem being taken up by the Supreme Court this month with no certainty of the outcome. The administrative state that seized control has not given up power. Crime has been normalized. Art and music institutions are on the rocks. Public trust in all official institutions is at rock bottom. We don’t even know if we can trust the elections anymore.
In the early days of lockdown, Henry Kissinger warned that if the mitigation plan does not go well, the world will find itself set “on fire.” He died in 2023. Meanwhile, the world is indeed on fire. The essential struggle in every country on earth today concerns the battle between the authority and power of permanent administration apparatus of the state – the very one that took total control in lockdowns – and the enlightenment ideal of a government that is responsible to the will of the people and the moral demand for freedom and rights.
How this struggle turns out is the essential story of our times.
CODA: I’m embedding a copy of PanCAP Adapted, as annotated by Debbie Lerman. You might need to download the whole thing to see the annotations. If you can help with research, please do.
* * *
Jeffrey Tucker is the author of the excellent new book 'Life After Lock-Down'
Government
CDC Warns Thousands Of Children Sent To ER After Taking Common Sleep Aid
CDC Warns Thousands Of Children Sent To ER After Taking Common Sleep Aid
Authored by Jack Phillips via The Epoch Times (emphasis ours),
A…
Share this:

Authored by Jack Phillips via The Epoch Times (emphasis ours),
A U.S. Centers for Disease Control (CDC) paper released Thursday found that thousands of young children have been taken to the emergency room over the past several years after taking the very common sleep-aid supplement melatonin.
The agency said that melatonin, which can come in gummies that are meant for adults, was implicated in about 7 percent of all emergency room visits for young children and infants “for unsupervised medication ingestions,” adding that many incidents were linked to the ingestion of gummy formulations that were flavored. Those incidents occurred between the years 2019 and 2022.
Melatonin is a hormone produced by the human body to regulate its sleep cycle. Supplements, which are sold in a number of different formulas, are generally taken before falling asleep and are popular among people suffering from insomnia, jet lag, chronic pain, or other problems.
The supplement isn’t regulated by the U.S. Food and Drug Administration and does not require child-resistant packaging. However, a number of supplement companies include caps or lids that are difficult for children to open.
The CDC report said that a significant number of melatonin-ingestion cases among young children were due to the children opening bottles that had not been properly closed or were within their reach. Thursday’s report, the agency said, “highlights the importance of educating parents and other caregivers about keeping all medications and supplements (including gummies) out of children’s reach and sight,” including melatonin.
The approximately 11,000 emergency department visits for unsupervised melatonin ingestions by infants and young children during 2019–2022 highlight the importance of educating parents and other caregivers about keeping all medications and supplements (including gummies) out of children’s reach and sight.
The CDC notes that melatonin use among Americans has increased five-fold over the past 25 years or so. That has coincided with a 530 percent increase in poison center calls for melatonin exposures to children between 2012 and 2021, it said, as well as a 420 percent increase in emergency visits for unsupervised melatonin ingestion by young children or infants between 2009 and 2020.
Some health officials advise that children under the age of 3 should avoid taking melatonin unless a doctor says otherwise. Side effects include drowsiness, headaches, agitation, dizziness, and bed wetting.
Other symptoms of too much melatonin include nausea, diarrhea, joint pain, anxiety, and irritability. The supplement can also impact blood pressure.
However, there is no established threshold for a melatonin overdose, officials have said. Most adult melatonin supplements contain a maximum of 10 milligrams of melatonin per serving, and some contain less.
Many people can tolerate even relatively large doses of melatonin without significant harm, officials say. But there is no antidote for an overdose. In cases of a child accidentally ingesting melatonin, doctors often ask a reliable adult to monitor them at home.
Dr. Cora Collette Breuner, with the Seattle Children’s Hospital at the University of Washington, told CNN that parents should speak with a doctor before giving their children the supplement.
“I also tell families, this is not something your child should take forever. Nobody knows what the long-term effects of taking this is on your child’s growth and development,” she told the outlet. “Taking away blue-light-emitting smartphones, tablets, laptops, and television at least two hours before bed will keep melatonin production humming along, as will reading or listening to bedtime stories in a softly lit room, taking a warm bath, or doing light stretches.”
In 2022, researchers found that in 2021, U.S. poison control centers received more than 52,000 calls about children consuming worrisome amounts of the dietary supplement. That’s a six-fold increase from about a decade earlier. Most such calls are about young children who accidentally got into bottles of melatonin, some of which come in the form of gummies for kids, the report said.
Dr. Karima Lelak, an emergency physician at Children’s Hospital of Michigan and the lead author of the study published in 2022 by the CDC, found that in about 83 percent of those calls, the children did not show any symptoms.
However, other children had vomiting, altered breathing, or other symptoms. Over the 10 years studied, more than 4,000 children were hospitalized, five were put on machines to help them breathe, and two children under the age of two died. Most of the hospitalized children were teenagers, and many of those ingestions were thought to be suicide attempts.
Those researchers also suggested that COVID-19 lockdowns and virtual learning forced more children to be at home all day, meaning there were more opportunities for kids to access melatonin. Also, those restrictions may have caused sleep-disrupting stress and anxiety, leading more families to consider melatonin, they suggested.
The Associated Press contributed to this report.
International
Red Candle In The Wind
Red Candle In The Wind
By Benjamin PIcton of Rabobank
February non-farm payrolls superficially exceeded market expectations on Friday by…
Share this:

By Benjamin PIcton of Rabobank
February non-farm payrolls superficially exceeded market expectations on Friday by printing at 275,000 against a consensus call of 200,000. We say superficially, because the downward revisions to prior months totalled 167,000 for December and January, taking the total change in employed persons well below the implied forecast, and helping the unemployment rate to pop two-ticks to 3.9%. The U6 underemployment rate also rose from 7.2% to 7.3%, while average hourly earnings growth fell to 0.2% m-o-m and average weekly hours worked languished at 34.3, equalling pre-pandemic lows.
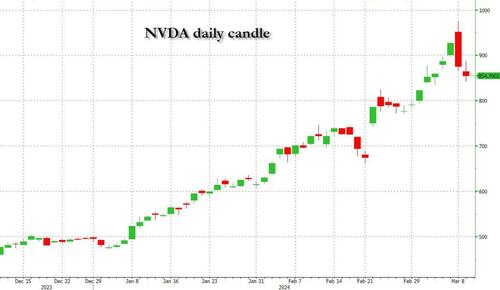
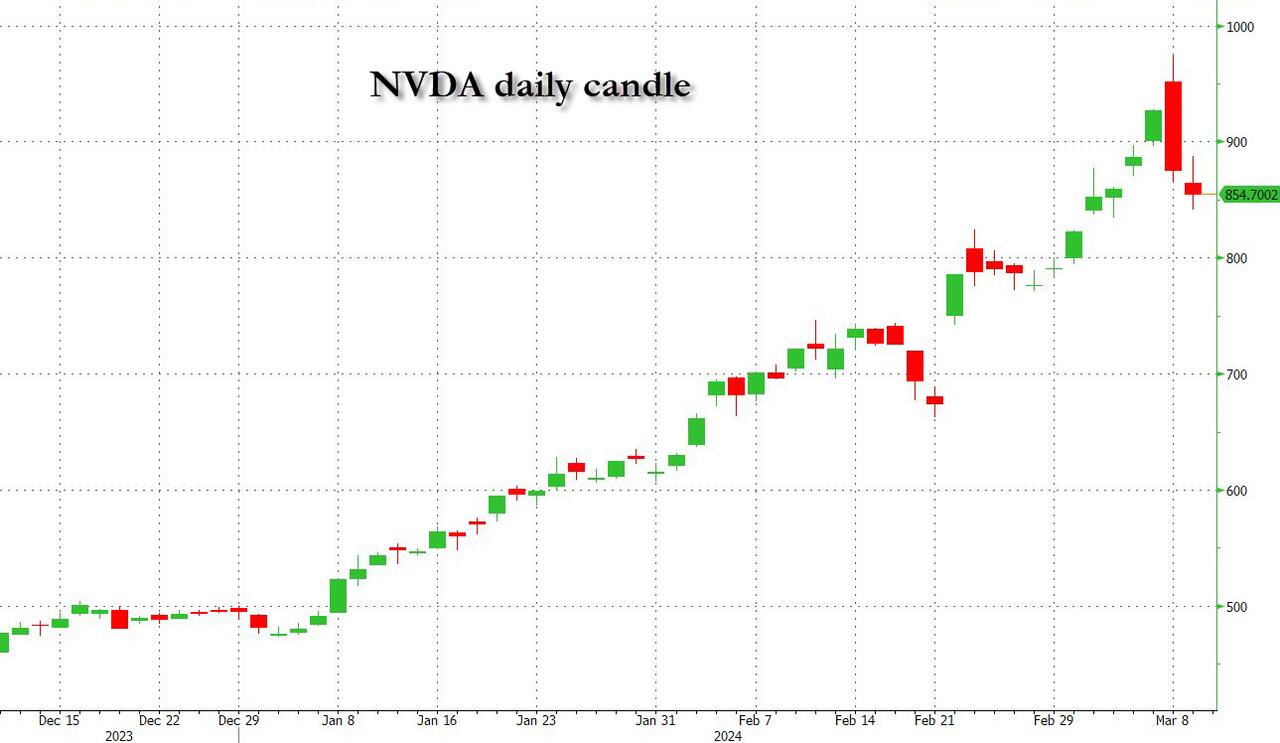
Undeterred by the devil in the detail, the algos sprang into action once exchanges opened. Market darling NVIDIA hit a new intraday high of $974 before (presumably) the humans took over and sold the stock down more than 10% to close at $875.28. If our suspicions are correct that it was the AIs buying before the humans started selling (no doubt triggering trailing stops on the way down), the irony is not lost on us.
The 1-day chart for NVIDIA now makes for interesting viewing, because the red candle posted on Friday presents quite a strong bearish engulfing signal. Volume traded on the day was almost double the 15-day simple moving average, and similar price action is observable on the 1-day charts for both Intel and AMD. Regular readers will be aware that we have expressed incredulity in the past about the durability the AI thematic melt-up, so it will be interesting to see whether Friday’s sell off is just a profit-taking blip, or a genuine trend reversal.
AI equities aside, this week ought to be important for markets because the BTFP program expires today. That means that the Fed will no longer be loaning cash to the banking system in exchange for collateral pledged at-par. The KBW Regional Banking index has so far taken this in its stride and is trading 30% above the lows established during the mini banking crisis of this time last year, but the Fed’s liquidity facility was effectively an exercise in can-kicking that makes regional banks a sector of the market worth paying attention to in the weeks ahead. Even here in Sydney, regulators are warning of external risks posed to the banking sector from scheduled refinancing of commercial real estate loans following sharp falls in valuations.
Markets are sending signals in other sectors, too. Gold closed at a new record-high of $2178/oz on Friday after trading above $2200/oz briefly. Gold has been going ballistic since the Friday before last, posting gains even on days where 2-year Treasury yields have risen. Gold bugs are buying as real yields fall from the October highs and inflation breakevens creep higher. This is particularly interesting as gold ETFs have been recording net outflows; suggesting that price gains aren’t being driven by a retail pile-in. Are gold buyers now betting on a stagflationary outcome where the Fed cuts without inflation being anchored at the 2% target? The price action around the US CPI release tomorrow ought to be illuminating.
Leaving the day-to-day movements to one side, we are also seeing further signs of structural change at the macro level. The UK budget last week included a provision for the creation of a British ISA. That is, an Individual Savings Account that provides tax breaks to savers who invest their money in the stock of British companies. This follows moves last year to encourage pension funds to head up the risk curve by allocating 5% of their capital to unlisted investments.
As a Hail Mary option for a government cruising toward an electoral drubbing it’s a curious choice, but it’s worth highlighting as cash-strapped governments increasingly see private savings pools as a funding solution for their spending priorities.
Of course, the UK is not alone in making creeping moves towards financial repression. In contrast to announcements today of increased trade liberalisation, Australian Treasurer Jim Chalmers has in the recent past flagged his interest in tapping private pension savings to fund state spending priorities, including defence, public housing and renewable energy projects. Both the UK and Australia appear intent on finding ways to open up the lungs of their economies, but government wants more say in directing private capital flows for state goals.
So, how far is the blurring of the lines between free markets and state planning likely to go? Given the immense and varied budgetary (and security) pressures that governments are facing, could we see a re-up of WWII-era Victory bonds, where private investors are encouraged to do their patriotic duty by directly financing government at negative real rates?
That would really light a fire under the gold market.


‘I couldn’t stand the pain’: the Turkish holiday resort that’s become an emergency dental centre for Britons who can’t get treated at home


Four Years Ago This Week, Freedom Was Torched


CDC Warns Thousands Of Children Sent To ER After Taking Common Sleep Aid


Is the National Guard a solution to school violence?


Rand Paul Teases Senate GOP Leader Run – Musk Says “I Would Support”


Trump “Clearly Hasn’t Learned From His COVID-Era Mistakes”, RFK Jr. Says


The next pandemic? It’s already here for Earth’s wildlife


Mathematicians use AI to identify emerging COVID-19 variants


The Great Replacement Loophole: Illegal Immigrants Score 5-Year Work Benefit While “Waiting” For Deporation, Asylum


Fauci Deputy Warned Him Against Vaccine Mandates: Email
-

 Uncategorized3 weeks ago
All Of The Elements Are In Place For An Economic Crisis Of Staggering Proportions
-

 International4 days ago
EyePoint poaches medical chief from Apellis; Sandoz CFO, longtime BioNTech exec to retire
-

 Uncategorized3 weeks ago
California Counties Could Be Forced To Pay $300 Million To Cover COVID-Era Program
-

 Uncategorized2 weeks ago
Apparel Retailer Express Moving Toward Bankruptcy
-

 Uncategorized4 weeks ago
Industrial Production Decreased 0.1% in January
-

 International4 days ago
Walmart launches clever answer to Target’s new membership program
-

 Uncategorized3 weeks ago
RFK Jr: The Wuhan Cover-Up & The Rise Of The Biowarfare-Industrial Complex
-

 Uncategorized3 weeks ago
GOP Efforts To Shore Up Election Security In Swing States Face Challenges