Logica Capital August 2020 Commentary: Scaling S&P Puts And Calls
Logica Capital August 2020 Commentary: Scaling S&P Puts And Calls
Share this:


Logica Capital commentary for the month ended August 2020, discussing scaling S&P puts and calls from their portfolio.

Q2 2020 hedge fund letters, conferences and more
Logica Absolute Return - Up/Down Convexity - No Correlation
Logica Tail Risk - Max Downside Convexity - Negative Correlation
August 2020 Performance*
Logica Absolute Return -1.30%
Logica Tail Risk -2.66%
S&P 500 +6.98%
VIX +1.95 pts
Year To Date Performance*
Logica Absolute Return +19.68%
Logica Tail Risk +19.88%
S&P 500 +9.65%
*Returns are Gross of fees to illustrate strategy performance.
Logica Absolute Return Fund, LP returned -1.41% (net) for August 2020

“Jump up and down and I'll sing and I'll shout I got two left feet, I got two left feet” - LZ7, 2017
S&P Puts And Calls: It’s Hard to Go Solo at a Swinger Party
This month was yet another record-breaking month for option volumes and the dynamic we discuss in our recent whitepaper, “Let’s Talk About Skew, Baby!”, was not written with total disinterest for our portfolios.
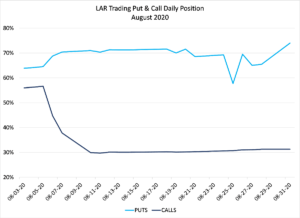
One of the mechanisms Logica uses to defray the cost of being long options (both calls and puts) is a proprietary take on the “gamma scalping” often deployed at dealer desks, which relies on the consistent element of short term mean reversion in the market. Broadly speaking, the natural “noise” of price movement, as the market expands and contracts from side to side while attempting to move its way along a trend creates opportunities for “scalping” those swings. As we illustrate in simplistic terms in our presentation, our process scales in and out of positions in S&P puts and calls by reducing or adding in the over-bought (sold) direction of the local market movement:
While the math is fairly complex, the resulting behavior is expressed as a modulation of the number of contracts that Logica will hold on either side of our “trading” portfolio (composed of S&P index puts and calls). From an implementation standpoint, after we sell, we expect a brief market retreat to give us the opportunity to use an ensuing day to be able to repurchase a fraction of the calls we sold at lower prices. Concurrently, as the market moves higher (lower), each call (put) contract we continue to hold becomes more valuable (gaining both market value and delta) which somewhat offsets the profit taking and incremental capital spent on puts (calls) on the “other side” of the straddle.
In a quantitative system, we necessarily must build our models to reflect “expected” behavior, and this month was anything but expected. If we were to imagine the above graph as a binomial tree, the most frequent outcome is that an up day is followed by a down day. Using the history of US stock markets, roughly 25% of the time we would expect four up days in a row without a meaningful reversal (to reload). 5% of the time, we might expect 17 days in a row without a significant reversal. August 2020 had 20 consecutive days in a row without the opportunity to reload.
If we represent the resulting positioning for Logica graphically, our respective Put and Call loadings for August look less than ideal. Unfortunately, the continuous uplift in August meant that we carried too few calls during a month where the S&P rocketed upwards by nearly 7%, resulting in losses due to our concurrent full put load (which resulted in a short tilted straddle).

Compounding the challenges this month, our stock selection model for our single stock equity calls did not outperform the S&P 500, which was drawn upwards largely on the back of a few technology names from a much publicized single-stock call option buying bonanza. While we believe we have successfully identified the mechanism for this behavior in our whitepaper, our methodology is not designed to capture this rare dynamic. As a result, our combined Upcapture modules underperformed the S&P 500 in a manner that is unusual except for major reversals.
And finally, the challenging dynamic was rounded out by a somewhat surprising drawdown in our macro overlay as all three components (rates, dollar and gold) experienced negative months for the first time in over three years. While the macro modules are an active area of R&D, we do not view this underperformance as indicative of a structural change, especially as each one was well within its acceptable boundary.
While we are not pleased by our performance this month, certainly in the context of the opportunity set, we emphasize that LAR is designed to exhibit zero correlation with the S&P500 over time while delivering positive absolute returns. In a month where numerous aspects of our portfolio performed worse than expected, these results are (unfortunately) within tolerance for our approach. Hopefully, we are our own toughest critics.
“You got me where you want me
I ain't nothin' but your fool
Ya treated me mean
Oh you treated me cruel”
- Aretha Franklin, 1967
Well If Our Strategy Wasn’t Working, Who Was?
Another month, another record-breaking decline in the unemployment rate as small businesses continue to indicate near record levels of difficulty in filling job openings. Full confession – this makes almost zero sense.
In July the NBER released a report detailing the impact of COVID-19 on small business:
“The number of active business owners in the United States plummeted by 3.3 million or 22 percent over the crucial two-month window from February to April 2020. The drop in active business owners was the largest on record, and losses to business activity were felt across nearly all industries… Continuing the analysis in May and June, the number of active business owners remained low - down by 15 percent and 8 percent, respectively… The loss of 3.3 million active business owners (or 22 percent) was the largest drop on record. When conditioning on working roughly two days per week or four days a week, the losses are even larger (28 percent and 31 percent, respectively). Total hours worked by all business owners dropped by 29 percent. Although incorporated businesses are more growth-oriented and stable, they experienced a drop of 20 percent from February to April 2020.”
These horrific results are echoed in the initial increase in unemployment, but oddly the recovery in the unemployment rate and the apparently aggressive search for employees are not echoed in a new survey introduced by the Census Bureau in response to COVID-19 induced data uncertainty. The weekly Business Pulse Survey “complements existing US Census Bureau data collections by providing high-frequency, detailed information on the challenges small businesses are facing during the Coronavirus pandemic as well as their participation in federal programs such as the Paycheck Protection Program.”2 Unfortunately, the survey was not continuous from May to current (leave it to the government to decide continuous data series are overrated), but trends do not seem to have shifted meaningfully. The data does not match the improvement shown in headline unemployment, with more business reporting reductions in employment every week than increases. It is tough to see how the unemployment rate falls under those conditions:
Likewise, another “real-time” survey from the Dallas Fed suggests that the employment rate (not the unemployment rate) has barely recovered from the late March lows. Instead of the 6.2% improvement shown by the BLS, this would suggest that employment has only risen by 1.2% and has trended flat to down since June:
All of which is a long-winded way of saying, “We have no idea what is going on and anyone who claims to know is deceiving themselves.”
This point is broadly echoed in an important post by Felix Salmon in August:
“…other aspects of the recession, like the unemployment rate or national GDP, are foundational statistics upon which multi-trillion-dollar decisions are made. Never in living memory have those statistics been less reliable.” 4
We will not know much of the true data for 2020 for several years to come and the echoes of 2020 uncertainty will influence data for the next several years due to seasonal adjustment factors, etc. This complicates discussions of whether markets have diverged from “fundamentals” and makes risk-taking increasingly… risky. Fortunately, we remain positioned with our straddles that create the potential for returns in either direction.
Business Update - Logica Absolute Return Offhsore Fund
Logica will be introducing an offshore version of the Logica Absolute Return Fund in the next few months. If you are an offshore eligible investor currently in our onshore vehicle, we will be reaching out to gauge interest in transferring. If you are a new investor interested in our offshore vehicle, please contact Steven Greenblatt for subscription documents.
Logica Strategy Details
Note: We have comprehensive statistics and metrics available for our strategies, but only include a select few to highlight what we believe is our most valuable contribution to any larger portfolio.
If you would like to learn more about our strategies, please reach out to Steven Greenblatt.
If you would like to speak with Wayne or Mike on their views on Hedge Funds/Investing/Trading and trends they see shaping the industry, please contact Steven Greenblatt at greenblatt@logicafunds.com or 424-652-9520.
Follow Wayne on Twitter @WayneHimelsein
Follow Michael on Twitter @ProfPlum99
The post Logica Capital August 2020 Commentary: Scaling S&P Puts And Calls appeared first on ValueWalk.
International
“Extreme Events”: US Cancer Deaths Spiked In 2021 And 2022 In “Large Excess Over Trend”
"Extreme Events": US Cancer Deaths Spiked In 2021 And 2022 In "Large Excess Over Trend"
Cancer deaths in the United States spiked in 2021…
Share this:

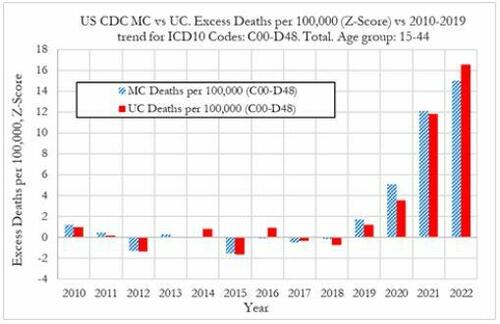
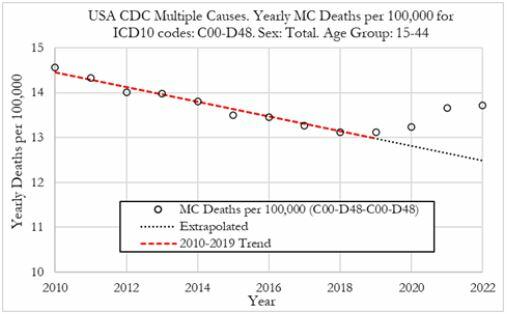
Cancer deaths in the United States spiked in 2021 and 2022 among 15-44 year-olds "in large excess over trend," marking jumps of 5.6% and 7.9% respectively vs. a rise of 1.7% in 2020, according to a new preprint study from deep-dive research firm, Phinance Technologies.
Extreme Events
The report, which relies on data from the CDC, paints a troubling picture.
"We show a rise in excess mortality from neoplasms reported as underlying cause of death, which started in 2020 (1.7%) and accelerated substantially in 2021 (5.6%) and 2022 (7.9%). The increase in excess mortality in both 2021 (Z-score of 11.8) and 2022 (Z-score of 16.5) are highly statistically significant (extreme events)," according to the authors.
That said, co-author, David Wiseman, PhD (who has 86 publications to his name), leaves the cause an open question - suggesting it could either be a "novel phenomenon," Covid-19, or the Covid-19 vaccine.
Cancer deaths in US in 2021 & 2022 in large excess over trend for 15-44 year-olds as extreme events. A novel phenomenon? C19? lockdowns? C19 vaccines? Honored to participate in this work. #CDC where are you? @DowdEdwardhttps://t.co/iUV5oQiWCW pic.twitter.com/uytzaIvvor
— David Wiseman PhD, MRPharmS (@AdhesionsOrg) March 12, 2024
"The results indicate that from 2021 a novel phenomenon leading to increased neoplasm deaths appears to be present in individuals aged 15 to 44 in the US," reads the report.
The authors suggest that the cause may be the result of "an unexpected rise in the incidence of rapidly growing fatal cancers," and/or "a reduction in survival in existing cancer cases."
They also address the possibility that "access to utilization of cancer screening and treatment" may be a factor - the notion that pandemic-era lockdowns resulted in fewer visits to the doctor. Also noted is that "Cancers tend to be slowly-developing diseases with remarkably stable death rates and only small variations over time," which makes "any temporal association between a possible explanatory factor (such as COVID-19, the novel COVID-19 vaccines, or other factor(s)) difficult to establish."
That said, a ZeroHedge review of the CDC data reveals that it does not provide information on duration of illness prior to death - so while it's not mentioned in the preprint, it can't rule out so-called 'turbo cancers' - reportedly rapidly developing cancers, the existence of which has been largely anecdotal (and widely refuted by the usual suspects).
While the Phinance report is extremely careful not to draw conclusions, researcher "Ethical Skeptic" kicked the barn door open in a Thursday post on X - showing a strong correlation between "cancer incidence & mortality" coinciding with the rollout of the Covid mRNA vaccine.
The argument is over.
— Ethical Skeptic ☀ (@EthicalSkeptic) March 14, 2024
The Covid mRNA Vaxx has cause a sizeable 2021 inflection, and now novel-trend elevation in terms of both cancer incidence & mortality.
Now you know who the liars were all along.
????Incidence = 14.8% excess
????UCoD Mortality = 5.3% excess (lags Incidence) pic.twitter.com/uwN9GMrHl1
Phinance principal Ed Dowd commented on the post, noting that "Cancer is suddenly an accelerating growth industry!"
????Indeed it is…Cancer is suddenly an accelerating growth industry! @EthicalSkeptic provides a chart below showing US Cancer treatment in constant dollars with a current growth rate of 14.8% (6.3% New CAGR) versus long term trend of 1.78% CAGR or $33.8 billion in excess cancer… https://t.co/RIn4R2YZZ7
— Edward Dowd (@DowdEdward) March 14, 2024
Continued:
As a former portfolio manager of of a $14 billion Large Cap Growth Equity portfolio I can definitively say Cancer treatments and the Disabilities have become growth industries that both have inflection points coincidental to the mRNA vaccine rollouts in 2021.
— Edward Dowd (@DowdEdward) March 14, 2024
Chart 1 from… pic.twitter.com/TCt4X1plnM
Bottom line - hard data is showing alarming trends, which the CDC and other agencies have a requirement to explore and answer truthfully - and people are asking #WhereIsTheCDC.
We aren't holding our breath.
Experts are sounding the alarm on a spike in cancer diagnosis worldwide. It is still a mystery. @DowdEdward from Phinance Technologies has also been sounding the alarm for months.
— dr.ir. Carla Peeters (@CarlaPeeters3) March 15, 2024
We are facing a dramatic degradation of the human immune system https://t.co/CPnwP3Oj9G
Wiseman, meanwhile, points out that Pfizer and several other companies are making "significant investments in cancer drugs, post COVID."
Pfizer among several companies making significant investments in cancer drugs, post COVID. @DowdEdward @Kevin_McKernan @JesslovesMJK @niki_kyrylenko https://t.co/nefEZYLW1o https://t.co/r505Sbbcq4
— David Wiseman PhD, MRPharmS (@AdhesionsOrg) March 15, 2024
Phinance
We've featured several of Phinance's self-funded deep dives into pandemic data that nobody else is doing. If you'd like to support them, click here.
List of our projects following disturbing tends in deaths, disabilities and absences.
— Edward Dowd (@DowdEdward) March 16, 2024
Link to projects at bottom.
✅ V-Damage Project
✅ Excess Mortality Project
✅ US Disabilities Project
✅ US BLS Absence rates Project
✅ US Cause of Death Project
✅ UK Cause of Death…
International
Gen Z, The Most Pessimistic Generation In History, May Decide The Election
Gen Z, The Most Pessimistic Generation In History, May Decide The Election
Authored by Mike Shedlock via MishTalk.com,
Young adults are more…
Share this:

Authored by Mike Shedlock via MishTalk.com,
Young adults are more skeptical of government and pessimistic about the future than any living generation before them.
This is with reason, and it’s likely to decide the election.
Rough Years and the Most Pessimism Ever
The Wall Street Journal has an interesting article on The Rough Years That Turned Gen Z Into America’s Most Disillusioned Voters.
Young adults in Generation Z—those born in 1997 or after—have emerged from the pandemic feeling more disillusioned than any living generation before them, according to long-running surveys and interviews with dozens of young people around the country. They worry they’ll never make enough money to attain the security previous generations have achieved, citing their delayed launch into adulthood, an impenetrable housing market and loads of student debt.
And they’re fed up with policymakers from both parties.
Washington is moving closer to passing legislation that would ban or force the sale of TikTok, a platform beloved by millions of young people in the U.S. Several young people interviewed by The Wall Street Journal said they spend hours each day on the app and use it as their main source of news.
“It’s funny how they quickly pass this bill about this TikTok situation. What about schools that are getting shot up? We’re not going to pass a bill about that?” Gaddie asked. “No, we’re going to worry about TikTok and that just shows you where their head is…. I feel like they don’t really care about what’s going on with humanity.”
Gen Z’s widespread gloominess is manifesting in unparalleled skepticism of Washington and a feeling of despair that leaders of either party can help. Young Americans’ entire political memories are subsumed by intense partisanship and warnings about the looming end of everything from U.S. democracy to the planet. When the darkest days of the pandemic started to end, inflation reached 40-year highs. The right to an abortion was overturned. Wars in Ukraine and the Middle East raged.
Dissatisfaction is pushing some young voters to third-party candidates in this year’s presidential race and causing others to consider staying home on Election Day or leaving the top of the ticket blank. While young people typically vote at lower rates, a small number of Gen Z voters could make the difference in the election, which four years ago was decided by tens of thousands of votes in several swing states.
Roughly 41 million Gen Z Americans—ages 18 to 27—will be eligible to vote this year, according to Tufts University.
Gen Z is among the most liberal segments of the electorate, according to surveys, but recent polling shows them favoring Biden by only a slim margin. Some are unmoved by those who warn that a vote against Biden is effectively a vote for Trump, arguing that isn’t enough to earn their support.
Confidence
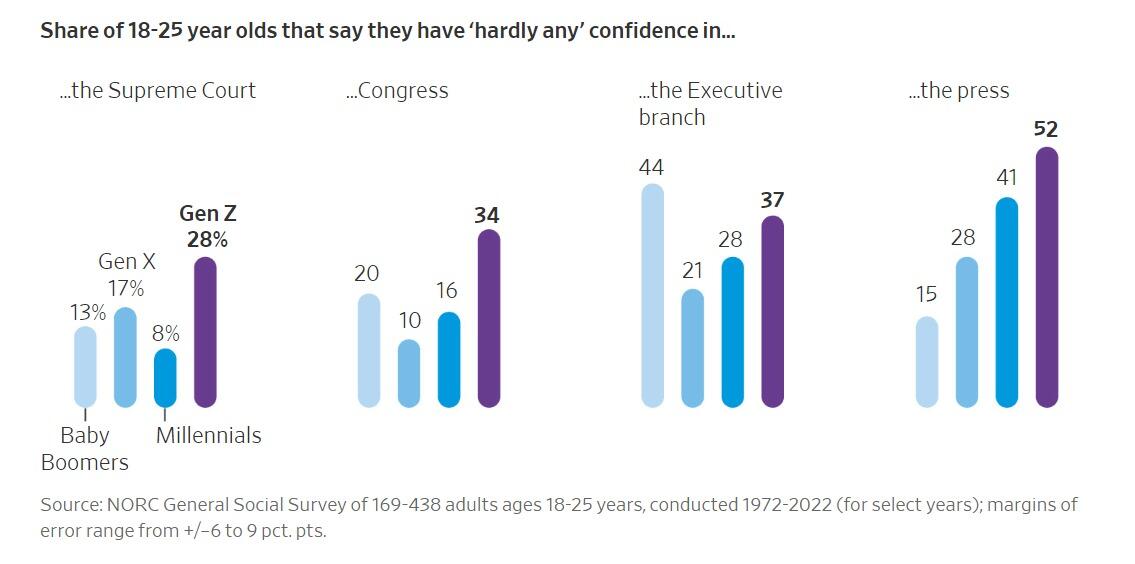
When asked if they had confidence in a range of public institutions, Gen Z’s faith in them was generally below that of the older cohorts at the same point in their lives.
One-third of Gen Z Americans described themselves as conservative, according to NORC’s 2022 General Social Survey. That is a larger share identifying as conservative than when millennials, Gen X and baby boomers took the survey when they were the same age, though some of the differences were small and within the survey’s margin of error.
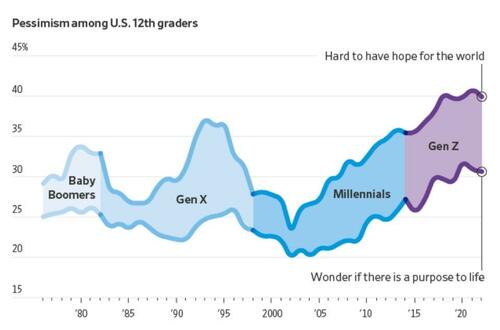
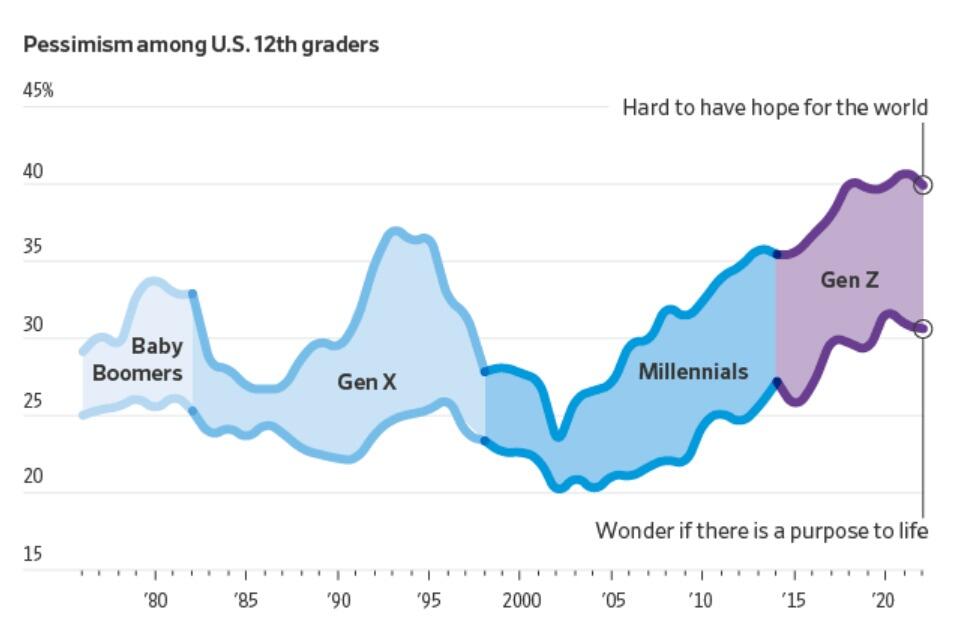
More young people now say they find it hard to have hope for the world than at any time since at least 1976, according to a University of Michigan survey that has tracked public sentiment among 12th-graders for nearly five decades. Young people today are less optimistic than any generation in decades that they’ll get a professional job or surpass the success of their parents, the long-running survey has found. They increasingly believe the system is stacked against them and support major changes to the way the country operates.
Gen Z future Outcome
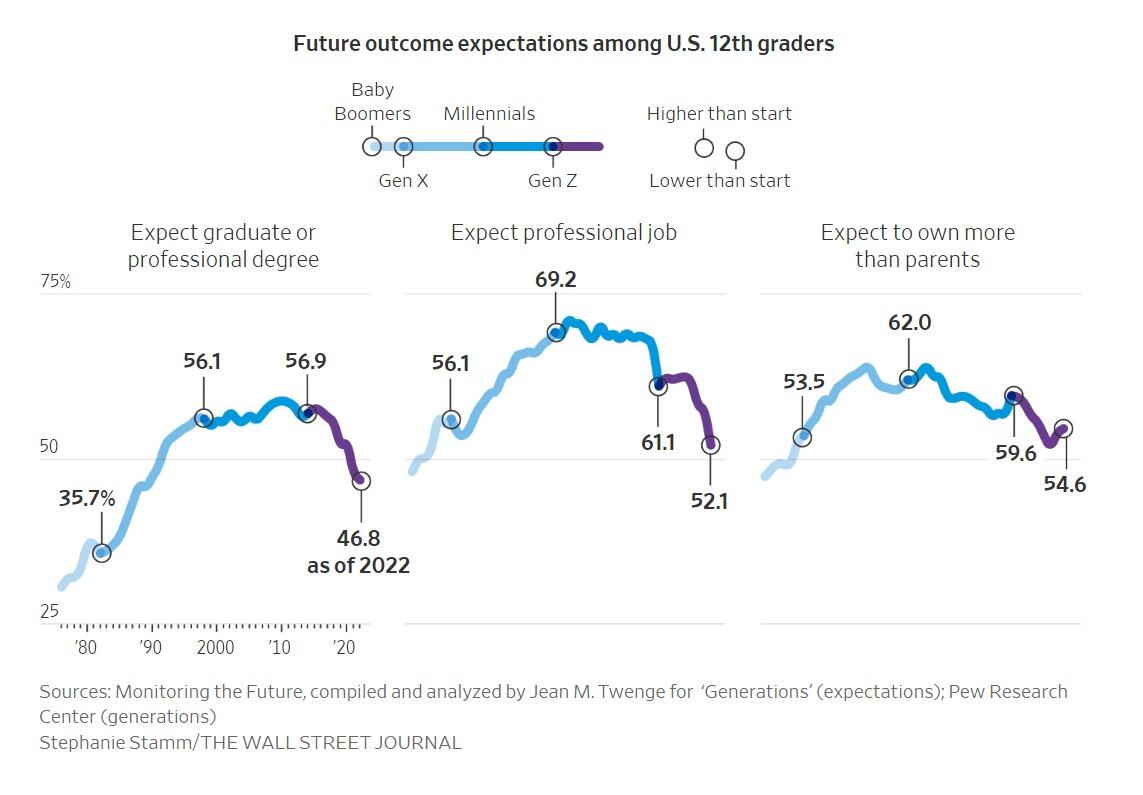
“It’s the starkest difference I’ve documented in 20 years of doing this research,” said Twenge, the author of the book “Generations.” The pandemic, she said, amplified trends among Gen Z that have existed for years: chronic isolation, a lack of social interaction and a propensity to spend large amounts of time online.
A 2020 study found past epidemics have left a lasting impression on young people around the world, creating a lack of confidence in political institutions and their leaders. The study, which analyzed decades of Gallup World polling from dozens of countries, found the decline in trust among young people typically persists for two decades.
Young people are more likely than older voters to have a pessimistic view of the economy and disapprove of Biden’s handling of inflation, according to the recent Journal poll. Among people under 30, Biden leads Trump by 3 percentage points, 35% to 32%, with 14% undecided and the remaining shares going to third-party candidates, including 10% to independent Robert F. Kennedy Jr.
Economic Reality
Gen Z may be the first generation in US history that is not better off than their parents.
Many have given up on the idea they will ever be able to afford a home.
The economy is allegedly booming (I disagree). Regardless, stress over debt is high with younger millennials and zoomers.
This has been a constant theme of mine for many months.
Credit Card and Auto Delinquencies Soar
Credit card debt surged to a record high in the fourth quarter. Even more troubling is a steep climb in 90 day or longer delinquencies.
![]()
Record High Credit Card Debt
Credit card debt rose to a new record high of $1.13 trillion, up $50 billion in the quarter. Even more troubling is the surge in serious delinquencies, defined as 90 days or more past due.
For nearly all age groups, serious delinquencies are the highest since 2011.
Auto Loan Delinquencies
![]()
Serious delinquencies on auto loans have jumped from under 3 percent in mid-2021 to to 5 percent at the end of 2023 for age group 18-29.Age group 30-39 is also troubling. Serious delinquencies for age groups 18-29 and 30-39 are at the highest levels since 2010.
For further discussion please see Credit Card and Auto Delinquencies Soar, Especially Age Group 18 to 39
Generational Homeownership Rates
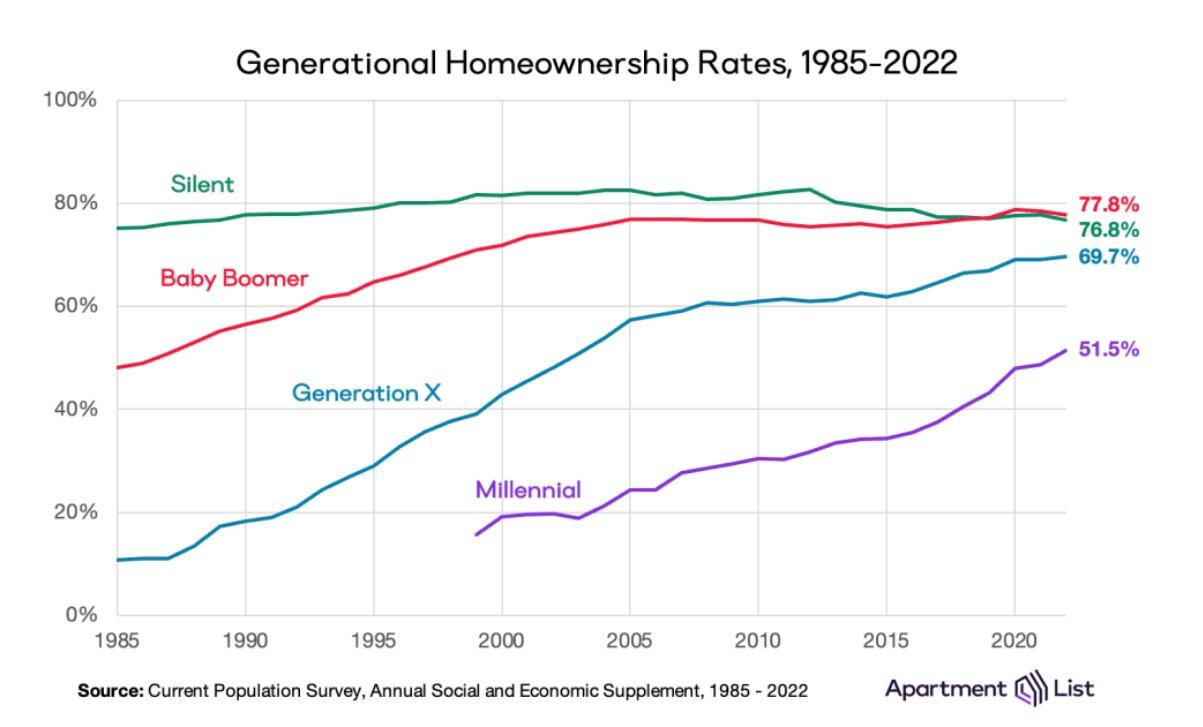
Home ownership rates courtesy of Apartment List
The above chart is from the Apartment List’s 2023 Millennial Homeownership Report
Those struggling with rent are more likely to be Millennials and Zoomers than Generation X, Baby Boomers, or members of the Silent Generation.
The same age groups struggling with credit card and auto delinquencies.
On Average Everything is Great
Average it up, and things look pretty good. This is why we have seen countless stories attempting to explain why people should be happy.
Krugman Blames Partisanship
With the recent rise in consumer sentiment, time to revisit this excellent Briefing Book paper. On reflection, I'd do it a bit differently; same basic conclusion, but I think partisan asymmetry explains even more of the remaining low numbers 1/ https://t.co/4lqm7X4472
— Paul Krugman (@paulkrugman) February 17, 2024
OK, there is a fair amount of partisanship in the polls.
However, Biden isn’t struggling from partisanship alone. If that was the reason, Biden would not be polling so miserably with Democrats in general, blacks, and younger voters.
OK, there is a fair amount of partisanship in the polls.
However, Biden isn’t struggling from partisanship alone. If that was the reason, Biden would not be polling so miserably with Democrats in general, blacks, and younger voters.
This allegedly booming economy left behind the renters and everyone under the age of 40 struggling to make ends meet.
Many Are Addicted to “Buy Now, Pay Later” Plans
Buy Now Pay Later, BNPL, plans are increasingly popular. It’s another sign of consumer credit stress.
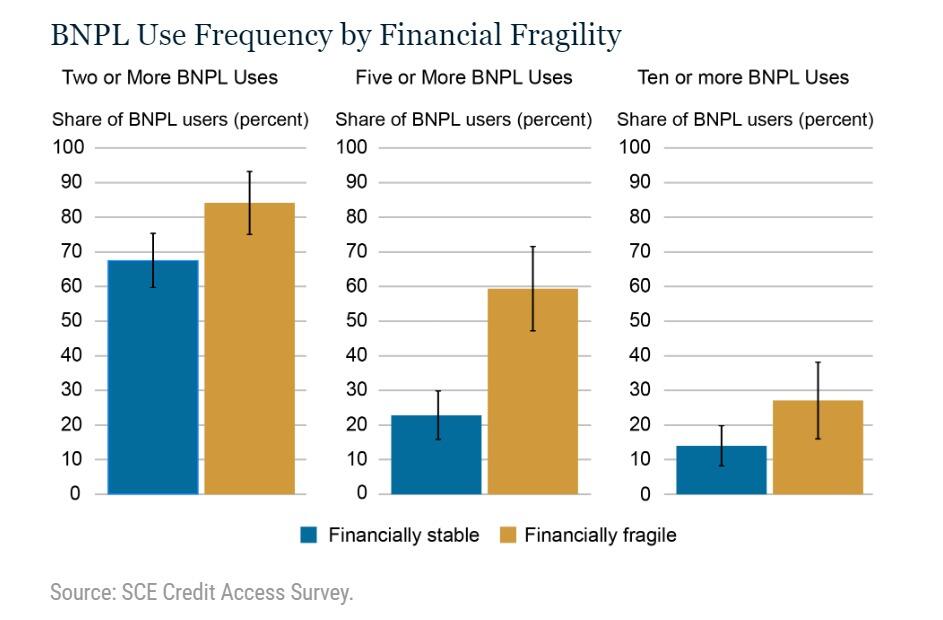
For discussion, please see Many Are Addicted to “Buy Now, Pay Later” Plans, It’s a Big Trap
The study did not break things down by home owners vs renters, but I strongly suspect most of the BNPL use is by renters.
What About Jobs?
Another seemingly strong jobs headline falls apart on closer scrutiny. The massive divergence between jobs and employment continued into February.
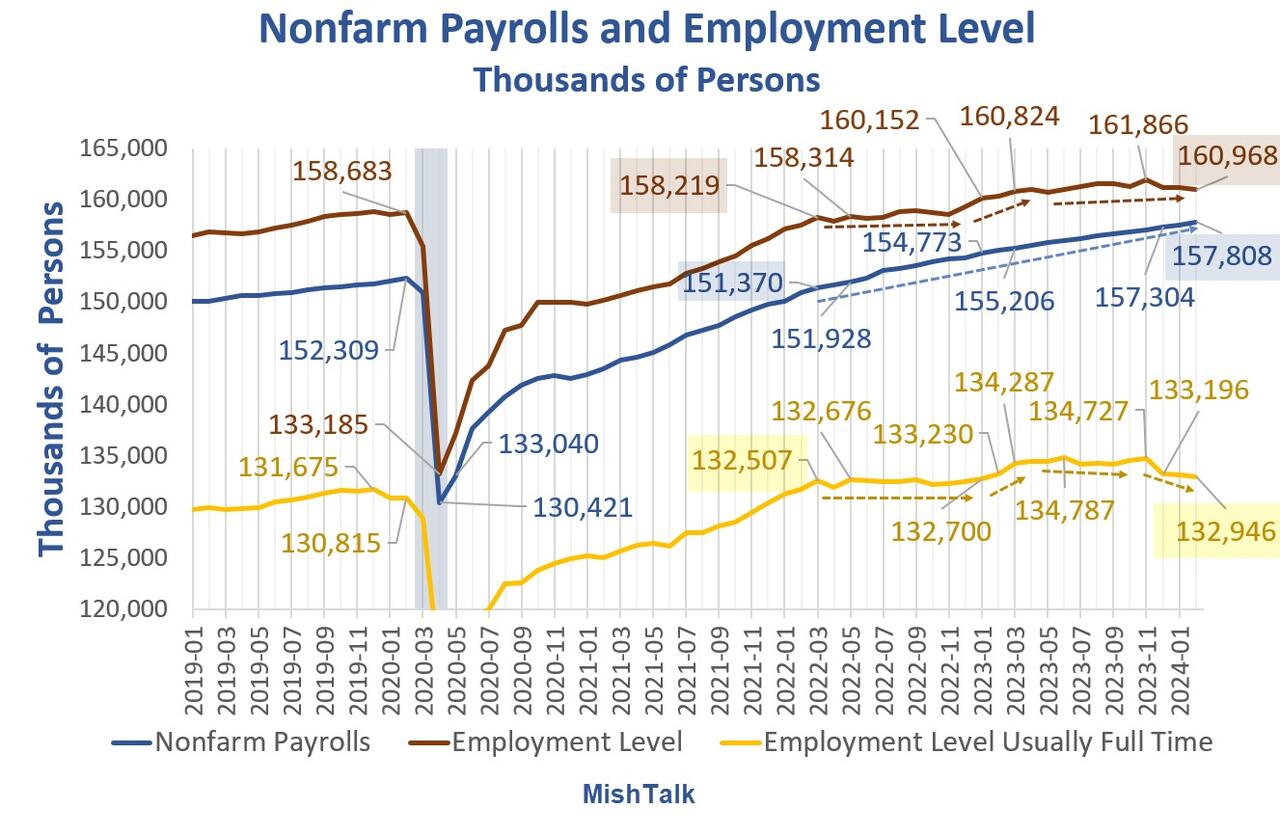
Nonfarm payrolls and employment levels from the BLS, chart by Mish.
Payrolls vs Employment Gains Since March 2023
-
Nonfarm Payrolls: 2,602,000
-
Employment Level: +144,000
-
Full Time Employment: -284,000
For more details of the weakening labor markets, please see Jobs Up 275,000 Employment Down 184,000
CPI Hot Again
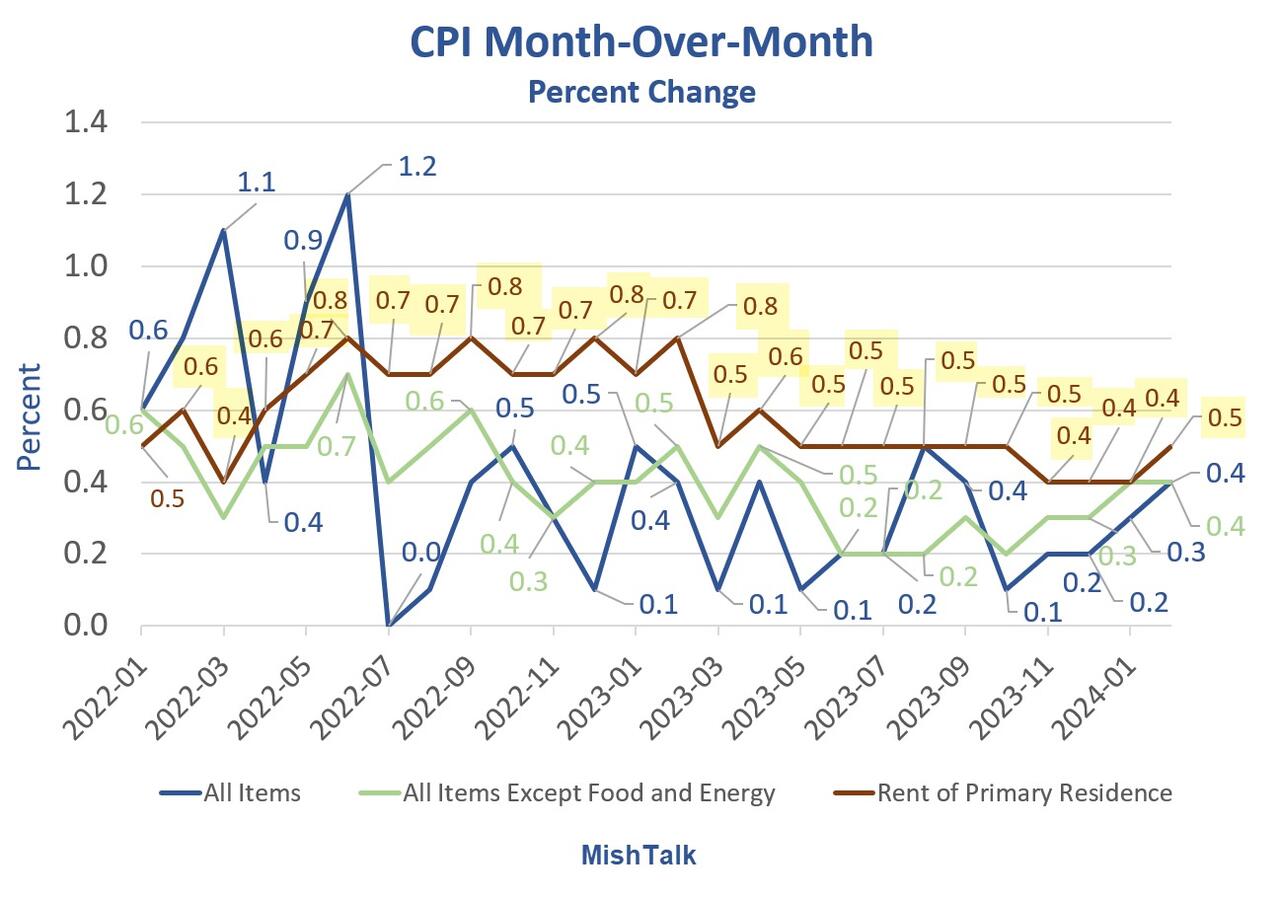
CPI Data from the BLS, chart by Mish.
For discussion of the CPI inflation data for February, please see CPI Hot Again, Rent Up at Least 0.4 Percent for 30 Straight Months
Also note the Producer Price Index (PPI) Much Hotter Than Expected in February
Major Economic Cracks
There are economic cracks in spending, cracks in employment, and cracks in delinquencies.
But there are no cracks in the CPI. It’s coming down much slower than expected. And the PPI appears to have bottomed.
Add it up: Inflation + Recession = Stagflation.
Election Impact
In 2020, younger voters turned out in the biggest wave in history. And they voted for Biden.
Younger voters are not as likely to vote in 2024, and they are less likely to vote for Biden.
Millions of voters will not vote for either Trump or Biden. Net, this will impact Biden more. The base will not decide the election, but the Trump base is far more energized than the Biden base.
If Biden signs a TikTok ban, that alone could tip the election.
If No Labels ever gets its act together, I suspect it will siphon more votes from Biden than Trump. But many will just sit it out.
“We’re just kind of over it,” Noemi Peña, 20, a Tucson, Ariz., resident who works in a juice bar, said of her generation’s attitude toward politics. “We don’t even want to hear about it anymore.” Peña said she might not vote because she thinks it won’t change anything and “there’s just gonna be more fighting.” Biden won Arizona in 2020 by just over 10,000 votes.
The Journal noted nearly one-third of voters under 30 have an unfavorable view of both Biden and Trump, a higher number than all older voters. Sixty-three percent of young voters think neither party adequately represents them.
Young voters in 2020 were energized to vote against Trump. Now they have thrown in the towel.
And Biden telling everyone how great the economy is only rubs salt in the wound.
Uncategorized
Women’s basketball is gaining ground, but is March Madness ready to rival the men’s game?
The hype around Caitlin Clark, NCAA Women’s Basketball is unprecedented — but can its March Madness finally rival the Men’s?
Share this:

In March 2021, the world was struggling to find its legs amid the ongoing Covid-19 pandemic. Sports leagues were trying their best to keep going.
It started with the NBA creating a bubble in Orlando in late 2020, playing a full postseason in the confines of Disney World in arenas that were converted into gyms devoid of fans. Other leagues eventually allowed for limited capacity seating in stadiums, including the NCAA for its Men’s and Women’s Basketball tournaments.
The two tournaments were confined to two cities that year — instead of games normally played in different regions around the country: Indianapolis for the men and San Antonio for the women.
But a glaring difference between the men’s and women’s facilities was exposed by Oregon’s Sedona Prince on social media. The workout and practice area for the men was significantly larger than the women, whose weight room was just a single stack of dumbbells.
Let me put it on Twitter too cause this needs the attention pic.twitter.com/t0DWKL2YHR
— SEDONA (@sedonaprince_) March 19, 2021
The video drew significant attention to the equity gaps between the Men’s and Women’s divisions, leading to a 114-page report by a civil rights law firm that detailed the inequities between the two and suggested ways to improve the NCAA’s efforts for the Women’s side. One of these suggestions was simply to give the Women’s Tournament the same March Madness moniker as the men, which it finally got in 2022.
But underneath the surface of these institutional changes, women’s basketball’s single-biggest success driver was already emerging out of the shadows.
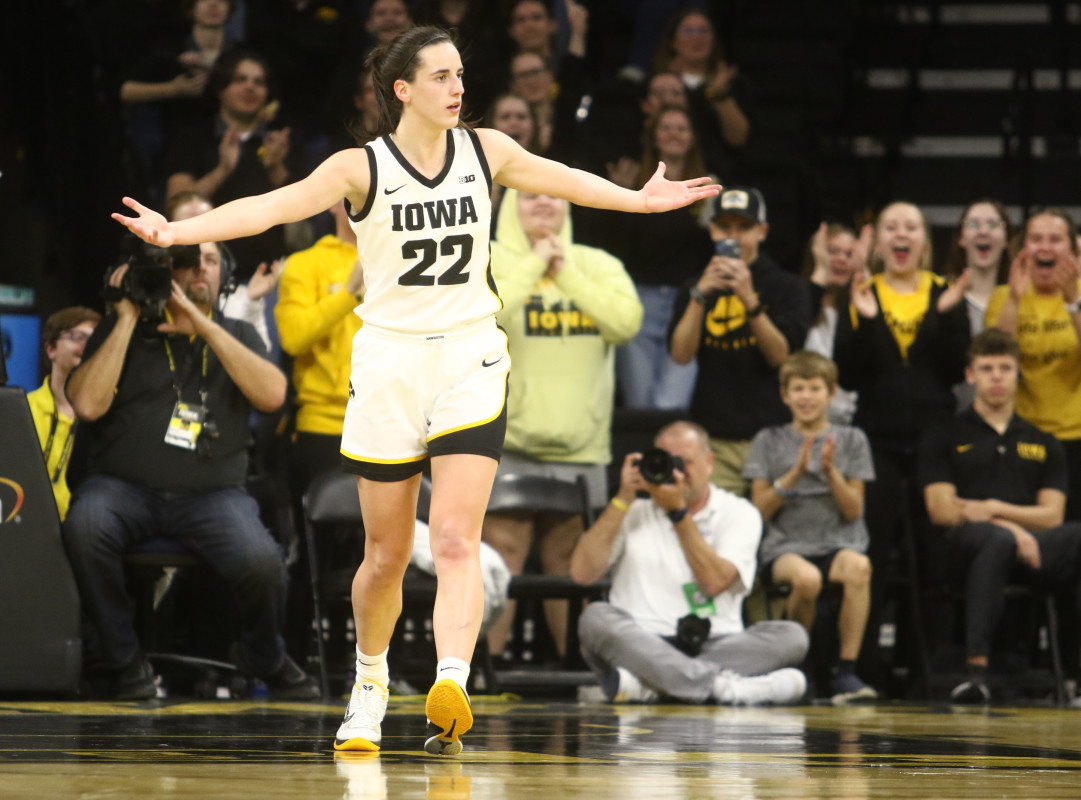
During the same COVID-marred season, a rookie from Iowa led the league in scoring with 26.6 points per game.
Her name: Caitlin Clark.
As it stands today, Clark is the leading scorer in the history of college basketball — Men’s or Women’s. Her jaw-dropping shooting ability has fueled record viewership and ticket sales for Women’s collegiate games, carrying momentum to the March Madness tournament that has NBA legends like Kevin Garnett and Paul Pierce more excited for the Women’s March Madness than the Men’s this year.
Related: Ticket prices for Caitlin Clark's final college home game are insanely high
But as the NCAA tries to bridge the opportunities given to the two sides, can the hype around Clark be enough for the Women’s March Madness to bring in the same fandom as the Men for the 2024 tournaments?
TheStreet spoke with Jon Lewis of Sports Media Watch, who has been following sports viewership trends for the last two decades; Melissa Isaacson, a veteran sports journalist and longtime advocate of women’s basketball; and Pete Giorgio, Deloitte’s leader for Global and US Sports to dissect the rise Caitlin Clark and women’s collegiate hoops ahead of March Madness.
“Nobody is moving the needle like Caitlin Clark,” Lewis told TheStreet. “Nobody else in sports, period, right now, is fueling record numbers on all these different networks, driving viewership beyond what the norm has been for 20 years."
The Caitlin Clark Effect is real — but there are other reasons for the success of women's basketball
The game in which Clark broke the all-time college scoring record against Ohio State on Sunday, Mar. 3 was seen by an average of 3.4 million viewers on Fox, marking the first time a women’s game broke the two million viewership barrier since 2010. Viewership for that game came in just behind the men’s game between Michigan State vs Arizona game on Thanksgiving, which Lewis said was driven by NFL viewership on the same day.
A week later, Iowa’s Big Ten Championship win over Nebraska breached the three million viewers mark as well, and the team has also seen viewership numbers crack over 1.5 million viewers multiple times throughout the regular season.
The success on television has also translated to higher ticket prices, as tickets to watch Clark at home and on the road have breached hundreds of dollars and drawn long lines outside stadiums. Isaacson, who is a professor at Northwestern, said she went to the game between the Hawkeyes and Northwestern Wildcats — which was the first sellout in school history for the team — and witnessed the effect of Clark in person.
“Standing in line interviewing people at the Northwestern game, seeing men who've never been to a women's game with their little girls watching and so excited, and seeing Caitlin and her engaging with little girls, it’s just been really fun,” Isaacson said.
But while Clark is certainly the biggest success driver, her game isn’t the only thing pulling up the women’s side. The three-point revolution, which started in the NBA with the introduction of deeper analytics as well as the rise of stars like Steph Curry, has been a positive for the Women’s game.
“They backed up to the three-point line and it’s opening up the game,” Isaacson said.
One of the major criticisms from a lot of women’s hoops detractors has been how the game does not compare in terms of quality to the men. However, shooting has become a great equalizer, displayed recently during the 2024 NBA All-Star Weekend last month when the WNBA’s Sabrina Ionescu nearly defeated Curry — who is widely considered the greatest shooter ever — in a three-point contest.
Clark has become the embodiment of the three-point revolution for the women. Her shooting displays have demanded the respect of anyone who has doubted women’s basketball in the past because being a man simply doesn’t grant someone the ability to shoot long-distance bombs the way she can.
Basketball pundit Bill Simmons admitted on a Feb. 28 episode of “The Bill Simmons Podcast” that he used to not want to watch women’s basketball because he didn’t enjoy watching the product, but finds himself following the women’s game this year more than the men’s side in large part due to Clark.
“I think she has the chance to be the most fun basketball player, male or female, when she gets to the pros,” Simmons said. “If she’s going to make the same 30-footers, routinely. It’s basically all the same Curry stuff just with a female … I would like watching her play in any format.”
But while Clark is driving up the numbers at the top, she’s not the only one carrying the greatness of the product. Lewis, Isaacson, Giorgio — and even Simmons, on his podcast — agreed that there are several other names and collegiate programs pulling in fans.
“It’s not just Iowa, it’s not just Caitlin Clark, it’s all of these teams,” Giorgio said. “Part of it is Angel Reese … coaches like Dawn Staley in South Carolina … You’ve got great stories left and right.”

The viewership showed that as well because the SEC Championship game between the LSU Tigers and University of South Carolina Gamecocks on Sunday, Mar. 10 averaged two million viewers.
Bridging the gap between the Men’s and Women’s March Madness viewership
The first reason women are catching up to the men is really star power. While the Women’s division has names like Clark and Reese, there just aren’t any names on the Men’s side this year that carry the same weight.
Garnett said on his show that he can’t name any men’s college basketball players, while on the women’s side, he could easily throw out the likes of Clark, Reese, UConn’s Paige Bueckers, and USC’s JuJu Watkins. Lewis felt the same.
Kevin Garnett energy towards WBB is unmatched. Sorry for the language but that’s how he talks. Just watch. pic.twitter.com/0yGBRGaF3O
— The9450 Podcast Network (@The9450) March 8, 2024
“The stars in the men's game, with one and done, I genuinely couldn't give you a single name of a single men’s player,” Lewis said.
A major reason for this is that the Women’s side has the continuity that the Men’s side does not. The rules of the NBA allow for players to play just one year in college — or even play a year professionally elsewhere — before entering the draft, while the WNBA requires players to be 22-years-old during the year of the draft to be eligible.
“You know the stars in the women's game because they stay longer,” Lewis said. “[In the men’s game], the programs are the stars … In the women's game, it's a lot more like the NBA where the players are the stars.”
Parity is also a massive factor on both sides. The women’s game used to be dominated by a few schools like UConn and Notre Dame. Nowadays, between LSU, Iowa, University of South Carolina, Stanford, and UConn, there are a handful of schools that have a shot to win the entire tournament. While this is more exciting for fans, the talent in the women's game isn’t deep enough, so too many upsets are unlikely. Many of the biggest draws are still expected to make deep runs.
But on the men’s side, there is a bigger shot that the smaller programs make it to the end — which is what was seen last year. UConn eventually won the whole thing, but schools without as big of a national fanbase in San Diego State, Florida Atlantic University, and the University Miami rounded out the Final Four.
“People want to see one Cinderella,” Lewis said. “They don't want to see two and three, they want one team that isn't supposed to be there.”
Is Women's March Madness ready to overtake the Men?
Social media might feel like it’s giving more traction to the Women’s game, but experts don’t necessarily expect that to show up in the viewership numbers just yet.
“There’s certainly a lot more buzz than there used to be,” Giorgio said. “It’s been growing every year for not just the past few years but for 10 years, but it’s hard to compare it versus Men’s.”
But the gap continues to get smaller and smaller between the two sides, and this year's tournament could bridge that gap even further.
One indicator is ticket prices. For the NCAA Tournament Final Four in April, “get-in” ticket prices are currently more expensive for the Women’s game than the Men’s game, according to TickPick. The ticketing site also projects that the Women’s Final Four and Championship game ticket prices will smash any previous records for the Women’s side should Clark and the Hawkeyes make a run to the end.

Getty Images/TheStreet
The caveat is that the Women’s Final Four is played in a stadium that has less than a third of the seating capacity of the Men’s Final Four. That’s why the average ticket prices are still more expensive for the men, although the gap is a lot smaller this year than in previous years.

But that caveat pretty much sums up where the women’s game currently stands versus the men’s: There is still a significant gap between the distribution and availability of the former.
While Iowa’s regular season games have garnered millions of viewers, the majority of the most-viewed games are still Men’s contests.
To illustrate the gap between the men’s and women’s game — last year’s Women’s Championship game that saw the LSU Tigers defeat the Hawkeyes was a record-breaking one for the women, drawing an average of 9.9 million viewers, more than double the viewership from the previous year.
One of the main reasons for that increase, as Lewis pointed out, is that last year’s Championship game was on ABC, which was the first time since 1995 that the Women’s Championship game was on broadcast television. The 1995 contest between UConn and Tennessee drew 7.4 million viewers.
The Men’s Championship actually had a record low in viewership last year garnering only 14.7 million viewers, driven in-part due to a lack of hype surrounding the schools that made it to the Final Four and Championship game. Viewership for the Men’s title game has been trending down in recent years — partly due to the effect the pandemic had on collective sports viewership — but the Men’s side had been easily breaching 20 million viewers for the game as recently as 2017.

Iowa's Big Ten Championship win on Sunday actually only averaged 6,000 fewer viewers than the iconic rivalry game between Duke and University of North Carolina Men’s Basketball the day prior. However, there is also the case that the Iowa game was played on broadcast TV (CBS) versus the Duke-UNC game airing on cable channel (ESPN).
So historical precedence makes it unlikely that we’ll see the women’s game match the men’s in terms of viewership as early as this year barring another massive viewership jump for the women and a lack of recovery for the Men’s side.
But ultimately, this shouldn’t be looked at as a down point for Women’s Basketball, according to Lewis. The Men’s side has built its viewership base for years, and the Women’s side is still growing. Even keeping pace with the Men’s viewership is already a great sign.
“The fact that these games have Caitlin Clark are even in the conversation with men's games, in terms of viewership is a huge deal,” Lewis said.
Related: Angel Reese makes bold statement for avoiding late game scuffle in championship game
recovery pandemic covid-19

The War Between Knowledge And Stupidity


Key shipping company files for Chapter 11 bankruptcy


Women’s basketball is gaining ground, but is March Madness ready to rival the men’s game?


Sylvester researchers, collaborators call for greater investment in bereavement care


Gen Z, The Most Pessimistic Generation In History, May Decide The Election


“I Can’t Even Save”: Americans Are Getting Absolutely Crushed Under Enormous Debt Load


Illegal Immigrants Leave US Hospitals With Billions In Unpaid Bills


Problems After COVID-19 Vaccination More Prevalent Among Naturally Immune: Study


Looking Back At COVID’s Authoritarian Regimes


Moderna turns the spotlight on long Covid with new initiatives
-

 Uncategorized3 weeks ago
All Of The Elements Are In Place For An Economic Crisis Of Staggering Proportions
-

 International1 week ago
EyePoint poaches medical chief from Apellis; Sandoz CFO, longtime BioNTech exec to retire
-

 Uncategorized4 weeks ago
California Counties Could Be Forced To Pay $300 Million To Cover COVID-Era Program
-

 Uncategorized3 weeks ago
Apparel Retailer Express Moving Toward Bankruptcy
-

 Spread & Containment4 days ago
IFM’s Hat Trick and Reflections On Option-To-Buy M&A
-

 Uncategorized1 month ago
Industrial Production Decreased 0.1% in January
-

 International1 week ago
Walmart launches clever answer to Target’s new membership program
-

 Uncategorized4 weeks ago
RFK Jr: The Wuhan Cover-Up & The Rise Of The Biowarfare-Industrial Complex