Lead Analyst Logan Mohtashami lays out his housing forecast for 2022 for mortgage rates, the 10-year yield, existing home sales and more.
The post Logan Mohtashami: The 2022 housing forecast appeared first on HousingWire.
Most of the time, the economy is like a slow-moving ocean liner that changes direction gradually and without much effort. But when a new, powerful variable presents itself, like the worldwide COVID-19 pandemic, the economy can change on a dime. COVID was a veritable iceberg for our ocean liner economy, but the ship did not go down! Even in the extreme conditions of COVID-19, my general premise on housing economics predicted that the two variables with the most influence — demographics and mortgage rates — would hold up the housing market. With those two factors still very much in play, here is my 2022 forecast.
The 10-year yield and mortgage rates
The forecast
For 2022, my range for the 10-year yield is 0.62%-1.94%, similar to 2021. Accordingly, my upper end range in mortgage rates is 3.375%-3.625% and the lower end range is 2.375%-2.50%. This is very similar to what I have done in the past, paying my respects to the downtrend in bond yields since 1981.
We had a few times in the previous cycle where the 10-year yield was below 1.60% and above 3%. Regarding 4% plus mortgage rates, I can make a case for higher yields, but this would require the world economies functioning all together in a world with no pandemic. For this scenario, Japan and Germany yields need to rise, which would push our 10-year yield toward 2.42% and get mortgage rates over 4%. Current conditions don’t support this.
The backstory
The lifeblood of my economic work depends greatly on the ebbs and flows of the 10-year yield, even more than mortgage rate targeting, which is unusual for a housing analyst.
When I first dipped into 10-year yield and mortgage rate forecasting in 2015, during the previous expansion, I said the 10-year yield will remain in a channel between 1.60%-3%. I’ve stuck to that channel forecast every year since — and for the most part that 10-year yield channel stuck. That range dictated that mortgage rates would roughly stay between 3.5%-4.75%.
When COVID-19 was about to hit our economy, I forecasted that the 10-year yield recessionary yields should be in a range between -0.21%-0.62%. We got to as low as 0.32% on that Monday morning in March when the crisis was hitting the markets the hardest. About a month later, I published my AB (America is Back) recovery model, which said that the 10-year yield should get back toward 1%. We got there in December of 2020 so I was able to retire my America is Back recovery model.
I said that when the economy was beginning the new expansion, the 10-year yield would create a range between 1.33%-1.60%. This couldn’t happen in 2020 but should happen in 2021. Even with the hot economic growth, the hottest inflation data in decades, and the Fed rate hike discussion picking up, this range of 1.33%-1.60% has held up nicely for most of 2021, meaning mortgage rates were going to be low in 2021.
My forecast for the 10-year yield range in 2021 was 0.62%-1.94% which translates to a bottom-end range in mortgage rates of 2.375%-2.5%, and an upper-end of 3.375%-3.625%. Single mortgage rate target forecasts have not fared well over the decades because these forecasters did not respect the downtrend in bond yields since 1981.
The X factor
Can there be a bond market sell out short term, sending yields above 1.94%, like what we saw early in the COVID-19 crisis? Yes, but if the markets do overreact for any reason, typically bond yields would fall back. Why do I not believe bond yields will push higher aggressively? The economic rate of growth peaked in 2021. The economy was on fire this year, and inflation data was super-hot. Even so, the highest the 10-year yield got was 1.75%. The economic disaster relief that boosted the recovery in 2020 and 2021 has been drawn down.
Government spending plans have also been watered down and new legislation might not even pass at all. Economic growth peaked in 2021 and some of the hotter inflation data has the potential to fall next year. The Federal Reserve wants to hike rates to cool the economy. Typically what happens before the first Fed rate hike is that the U.S. dollar has its biggest percent move higher ,which tends to hurt commodity prices and world growth. This is something to watch for next year as it could slow down world growth.
The economy won’t be as hot in 2022 as it was in 2021, but it will remain in expansionary mode. This type of backdrop will make it challenging for rates to rise in a big way and stay higher. The key with all my 10-year yield channel work is how long the 10-year stays in that channel during the calendar year. I have always believed this type of forecast is more useful than targeting a mortgage rate.
Existing-home sales
The forecast
For 2022, I am forecasting the same sales trend range as 2021 of about 5.74 million to 6.16 million. If monthly sales prints are above 6.16 million for existing homes, then I would consider the market more robust than expected. If sales trend toward 5.3 million then we will be back to 2019 levels. This would still be healthy sales considering the post-1996 trend, but it will mean housing demand has gotten softer.
This has happened before when higher rates have impacted demand. This is why since the summer of 2020 I have written about how if the 10-year yield can get above 1.94%, then things should cool down. However, as you can see it’s been hard to bond yields over that level and thus mortgage rates above 3.75%.
The backstory
If the last two reports of the year on existing home sales are above 6.2 million, I will admit that sales have slightly outperformed what I predicted for 2021. Early in 2021, I wrote that home sales would moderate after the peaks caused by the COVID-19 shutdown make-up demand and that readers should not overreact to this slowing. I wrote that sales would range between 5.84 million and 6.2 million, and that we could anticipate a few prints under 5.84 million — but sales would consistently be above the closing level of 2020 of 5.64 million. We got one print below 5.84 million and a few recent prints over 6.2 million, with two more reports. Mortgage demand was solid all year long and has picked up in the last 15 weeks.
One of my longer-term forecasts in the previous expansion was that the MBA Index would not reach 300 until 2020-2024. We got there in the early part of 2020, then the Index got hit by the COVID-19 delays in home buying to only have a V-shaped recovery that led to the make-up demand surge, moderation down and back to 300.
As you can see, it’s been like Mr. Toad’s wild ride here. We will still have some COVID-19 year-over-year comps to deal with up until mid February and then we can get back to normal. However, one thing is for sure: demand has been solid and stable in 2020 and 2021. Also, the market we have today doesn’t look like the credit boom we saw from 2002-2005.
I didn’t believe total home sales could get to 6.2 million in the years 2008-2019, this is new and existing home sales combined. We simply didn’t have the type of demographics in the previous expansion. We are in different times.
New home sales and housing starts
The forecast
My long-term call from the previous expansion has been that we won’t start a year at 1.5 million total housing starts until the years 2020-2024 and we have finally gotten here much like the 300 level in the MBA index. My rule of thumb has always been to follow the monthly supply data for new homes, and as long as monthly supply is below 6.5 months on a three-month average, they will build.
The backstory
Housing starts, permits and builders confidence are ending the year on a good note. Even though new home sales aren’t booming this year, it’s good enough to keep the builders building more homes even with all the drama of labor shortages, material cost and delays in finishing homes.
As you can see below, the uptrend has been intact even with the slowdown in 2018 and the brief pause from COVID-19.
The new home sales sector gets impacted by rates much more than the existing home sales marketplace. The last time this sector saw some stress from mortgage rates was in 2018 when rates were at 5%. Today’s 3% mortgage rates are good enough to keep things going. We should see slow growth in new home sales and housing starts as long as the monthly supply of new homes is below 6.5 months on a 3-month average. This sector has legs to walk forward slowly. I have never believed in the housing construction boom premise as mature economies don’t have construction booms with slowing population growth. More on that here.
The X factor
The one concern I have for this sector in 2022 is if the builders keep pushing the limits of home price growth to make their margins look better. When rates are low, they have the pricing power to do this. This is why the sector has done so well in 2021. If I am wrong about mortgage rates staying low in 2022, and rates go above 3.75% with duration, then demand for new homes should get hit. The longer-term concern for this sector is price growth because if demand slows down, this means a slowdown in construction and the builders really maximized their pricing power in 2020 and 2021.
Home prices
The forecast
I am looking for total home-price growth to be between 5.2% and 6.7% for 2022. This would be a meaningful cool down in price growth but would still be a third year straight of too much price growth for my taste.
The backstory
My biggest fear for the housing market during the years 2020 to 2024 was that real home-price growth can be unhealthy. When you have the best housing demographic patch ever recorded in history occurring at the same time as the lowest mortgage rates ever, with housing tenure doubling as it has in the last 12 years, it’s the perfect storm for unhealthy price growth.
Housing inventory has been falling since 2014 and mortgage purchase applications have been rising since then. As you can see below, 2021 wasn’t looking good for me regarding my fear for home prices rising too much.
The X factor
When I talk about real home-price growth being too hot, I mean that nominal home price growth is above 4.6% each year during the five-year period of 2020 to 2024, for a cumulative 23% growth. This would not be a positive for the housing market. If we end 2021 with 13% home price growth, (and it looks like we will do that or higher), then we have already achieved 23% of the price growth that I am comfortable with in just two years.
While I do believe home-price growth is cooling from the extreme high rate of growth we had earlier in the year, I would very much like to see prices get back in line with my model for a healthy market. In order for this to happen, we would need to have no increase in home prices for the next three years. Because inventory levels are falling again, and we are at risk of starting the 2022 spring season at fresh new all-time lows, this outcome is very unlikely.
Early in 2021, I had raised concerns that prices overheating should be the main concern, not forbearance crashing the market. When demand is stable, it’s extremely rare for inventory to skyrocket and American homeowners have never looked better on paper. In fact, a few months ago I talked about inventory falling again should be the concern going out.
Housing demand
The forecast
Everyone is talking about rates going higher and no one, it seems, is talking about the possibility that mortgage rates could go under 3% in 2022, except me. This is front and center in my mind. I want to see a B&B housing market: boring and balanced. In a B&B market, buyers have choices, sales move at a reasonable pace without bidding wars, and the whole home-buying experience is less stressful and more sane. I would like to see inventory get toward 1.52 – 1.93 million, (which is still historically low). However, this will be a more stable housing market.
The backstory
Millions of people buy homes each year. The only thing that cooled demand for housing in the previous expansion was mortgage rates going over 4% with duration. The increase in rates didn’t crash the market or even facilitated negative year-over-year home price declines; but it did increase the number of days homes stayed on the market.
Currently the biggest demographic patch ever recorded in U.S. history are ages 28-34, the first-time homebuyer median age is 33. When you add move-up, move-down, cash and investor demand together, demand will be stable and hard to break under the post-1996 trend of 4 million plus total sales every year in the years 2020-2024.
The X factor
Frankly, I’m getting tired of calling this market the unhealthiest since 2010. This is not due to a massive credit boom or exotic loan products contaminating the market with excess risk — it’s the lack of choice for buyers. If mortgage rates go under 3%, which I believe they can, it just keeps the low inventory story going on. The Federal Reserves wants to cool down the economy, the government is no longer providing disaster relief anymore and the world economies should get hit if the U.S. dollar gets too strong. So, my concern is about rates falling in year three of my 2020-2024 period. This is also a first-world problem to have and we aren’t dealing with the housing market of 2005-2008 when sales were declining and the U.S. consumer was already filing for bankruptcy and having foreclosures before the great recession started in 2008. This is to give you some perspectives here with my thinking.
The economy
The forecast
I expect the rate of change to slow in 2022 but the economy will still be expansionary. Retail sales have been off the charts, and this data line, which I expected to moderate, still hasn’t. The rate of growth will cool. Replicating the growth we saw in 2021 will be nearly impossible. As the excess savings have been drawn down and the additional checks that people got are no longer coming, this data line will find a more suitable and sustainable trend in 2022. Still I am shocked that moderation hasn’t happened already and I was the year 2020-2024 household formation spending guy, too.
The backstory
The U.S. economy has been on fire this year. Even with the excess savings, good demographics, and low rates, not even I thought we would see economic growth like we did in 2021. However, like all things in life, despite the peaks and valleys, the overall trend will prevail.
The X factor
I recently raised one of my six recession red flags after the most recent jobs report as the unemployment rate got to a key level for myself. These red flags are more of a progress checklist in the economic expansion, and when all six of my flags are raised, I go into recession watch. The economy is in a more mature phase of expansion since the recovery was so fast. Like everything with me, it’s a process to show you the path of this expansion to the next recession.
For housing, a strong labor market means more people are getting off forbearance, which is already under 1 million, much smaller than the nearly 5 million we had early in the crisis. I want to wish a Merry Christmas to all my forbearance crash bros who promised a housing crash in 2020 and 2021. You guys are the best trolling grifters ever!
More jobs and more robust wage growth mean the need for shelter will grow. The housing market is already dealing with too much rent inflation, but as wage growth picks up on the lower end, this means landlords will charge more rent. Again, this the problem you want to have, a tighter labor market means wage growth will pick up and we have 11 million job openings currently.
So, look for the rent inflation story to be part of the 2022 storyline, as well as the rate of growth of home prices cooling down.
There is nothing like a fifth wave of COVID-19 and a new highly transmissible variant to crank up the personal stress meter. While the continuing COVID crisis can cause havoc on some short-term data lines for the economy, we will, as we have done, get through this and move forward. Our reality is that, as a nation, we have learned to consume goods and services with an active virus infecting and killing us every day.
The St. Louis Financial Stress Index, which was a key data line to track for the America Is Back recovery model, has still been in a calm zone for the entire year, currently at -0.8564. When we break over zero — which is considered normal stress — then we have some market drama. However, that wasn’t the storyline in 2021 and we didn’t have a single day where the S&P 500 was in correction mode. It’s not normal to not have a stock correction, so a stock market correction in 2022 is in the works and this can lead more money into bonds and drive rates lower.
For more discussion on this index and the America is Back recovery model, this podcast goes over everything that has happened in 2020-2021.
Conclusion
What a ride it has been for all of us since April 7, 2020 when I wrote the America Is Back economic recovery model for HousingWire. We end 2021 with one of the greatest economic recovery stories ever in the history of the United States of America, and a terrible, dark, two-year period of failure for the extreme housing bears. Now we are well into a recovery and looking forward to a new year with its new challenges.
The job of the analyst is to forecast the positive or negative impacts that a whole slew of variables have on the economy based on carefully formulated economic models. The variables, such as demographics, the unemployment rate, what the Federal Reserve is doing, commodity prices and so many others, are constantly in flux and feed off of and influence one another. Additionally, new economic variables pop up all the time. My job, with every podcast and article, is to show you how the changes in these variables light the path to where the economy and the housing market is heading.
Take a deep breath — in through the nose and out through the mouth. The last two years have been crazy, but I am glad you are here to read this. This is our country, our world and our universe, and everyone is part of team Life on Earth. Merry Christmas, Happy Holidays and have a wonderful Happy New Year. We will get through 2022 one data line at a time.
“We have always held to the hope, the belief, the conviction that there is a better life, a better world, beyond the horizon.” Franklin D. Roosevelt
Former Project Veritas & O’Keefe Media Group operative and Pfizer formulation analyst scientist Justin Leslie revealed previously unpublished recordings showing Pfizer’s top vaccine researchers discussing major concerns surrounding COVID-19 vaccines. Leslie delivered these recordings to Veritas in late 2021, but they were never published:
Principal scientist at Pfizer, Kanwall Gill in 2021:
“We had no idea how it’s going to look like. MRNA vaccines have been there for 50 years, but nothing went to clinical trial because MRNA have been known to have side effects.”
Featured in Leslie’s footage is Kanwal Gill, a principal scientist at Pfizer. Gill was weary of MRNA technology given its long research history yet lack of approved commercial products. She called the vaccines “sneaky,” suggesting latent side effects could emerge in time.
Gill goes on to illustrate how the vaccine formulation process was dramatically rushed under the FDA’s Emergency Use Authorization and adds that profit incentives likely played a role:
Pfizer's principal scientist in 2021:
“It takes 10 year for a vaccine to come out. It takes years of observations... we are doing everything at the same time."
"It’s going to affect my heart, and I’m going to die. And nobody’s talking about that."
Leslie recorded another colleague, Pfizer’s pharmaceutical formulation scientist Ramin Darvari, who raised the since-validated concern that repeat booster intake could damage the cardiovascular system:
Pfizer's pharmaceutical formulation scientist, Ramin Darvari, in 2021:
“They’re engineering it specifically for me to take the next one, so increasing my consumption."
“It’s going to affect my heart, and I’m going to die. And nobody’s talking about that.”
None of these claims will be shocking to hear in 2024, but it is telling that high-level Pfizer researchers were discussing these topics in private while the company assured the public of “no serious safety concerns” upon the jab’s release:
Vaccine for Children is a Different Formulation
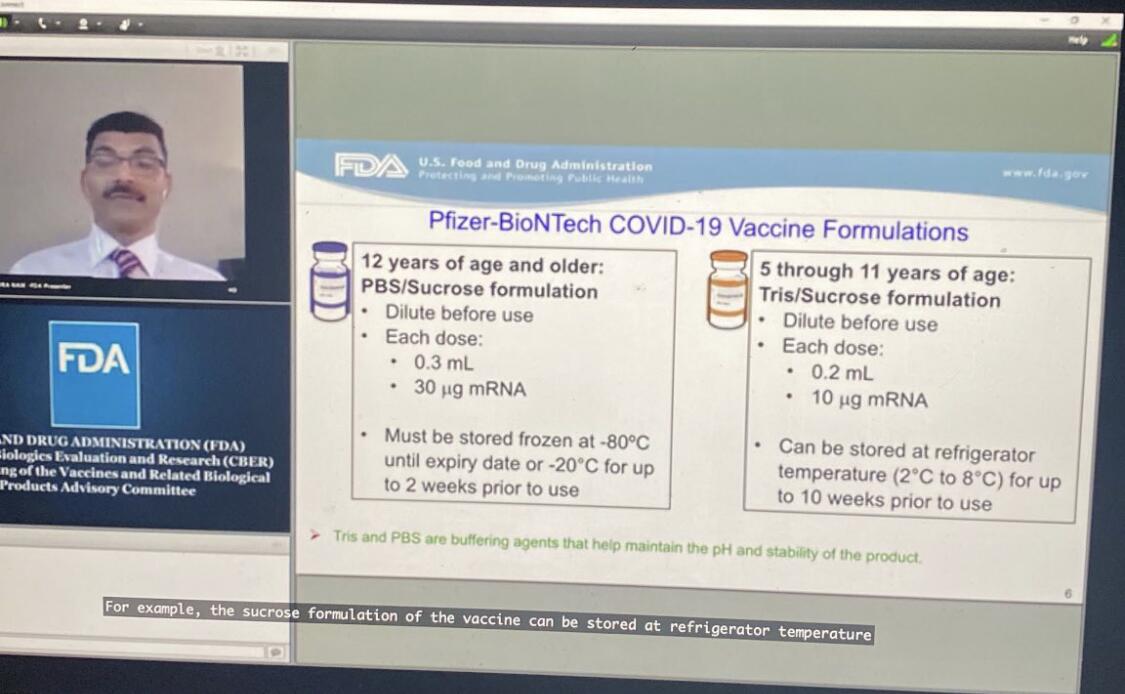
Leslie sent me a little-known FDA-Pfizer conference — a 7-hour Zoom meeting published in tandem with the approval of the vaccine for 5 – 11 year-olds — during which Pfizer’s vice presidents of vaccine research and development, Nicholas Warne and William Gruber, discussed a last-minute change to the vaccine’s “buffer” — from “PBS” to “Tris” — to improve its shelf life. For about 30 seconds of these 7 hours, Gruber acknowledged that the new formula was NOT the one used in clinical trials (emphasis mine):
“The studies were done using the same volume… but contained the PBS buffer. We obviously had extensive consultations with the FDA and it was determined that the clinical studies were not required because, again, the LNP and the MRNA are the same and the behavior — in terms of reactogenicity and efficacy — are expected to be the same.”
According to Leslie, the tweaked “buffer” dramatically changed the temperature needed for storage: “Before they changed this last step of the formulation, the formula was to be kept at -80 degrees Celsius. After they changed the last step, we kept them at 2 to 8 degrees celsius,” Leslie told me.
The claims are backed up in the referenced video presentation:
I’m no vaccinologist but an 80-degree temperature delta — and a 5x shelf-life in a warmer climate — seems like a significant change that might warrant clinical trials before commercial release.
Despite this information technically being public, there has been virtually no media scrutiny or even coverage — and in fact, most were told the vaccine for children was the same formula but just a smaller dose — which is perhaps due to a combination of the information being buried within a 7-hour jargon-filled presentation and our media being totally dysfunctional.
Bohemian Grove?
Leslie’s 2-hour long documentary on his experience at both Pfizer and O’Keefe’s companies concludes on an interesting note: James O’Keefe attended an outing at the Bohemian Grove.
Leslie offers this photo of James’ Bohemian Grove “GATE” slip as evidence, left on his work desk atop a copy of his book, “American Muckraker”:
My thoughts on the Bohemian Grove: my good friend’s dad was its general manager for several decades. From what I have gathered through that connection, the Bohemian Grove is not some version of the Illuminati, at least not in the institutional sense.
Do powerful elites hangout there? Absolutely. Do they discuss their plans for the world while hanging out there? I’m sure it has happened. Do they have a weird ritual with a giant owl? Yep, Alex Jones showed that to the world.
My perspective is based on conversations with my friend and my belief that his father is not lying to him. I could be wrong and am open to evidence — like if boxer Ryan Garcia decides to produce evidence regarding his rape claims — and I do find it a bit strange the club would invite O’Keefe who is notorious for covertly filming, but Occam’s razor would lead me to believe the club is — as it was under my friend’s dad — run by boomer conservatives the extent of whose politics include disliking wokeness, immigration, and Biden (common subjects of O’Keefe’s work).
Therefore, I don’t find O’Keefe’s visit to the club indicative that he is some sort of Operation Mockingbird asset as Leslie tries to depict (however Mockingbird is a 100% legitimate conspiracy). I have also met James several times and even came close to joining OMG. While I disagreed with James on the significance of many of his stories — finding some to be overhyped and showy — I never doubted his conviction in them.
As for why Leslie’s story was squashed… all my sources told me it was to avoid jail time for Veritas executives.
Feel free to watch Leslie’s full documentary here and decide for yourself.
Fun fact — Justin Leslie was also the operative behind this mega-viral Project Veritas story where Pfizer’s director of R&D claimed the company was privately mutating COVID-19 behind closed doors:
BREAKING: @Pfizer Exploring "Mutating" COVID-19 Virus For New Vaccines
"Don't tell anyone this...There is a risk...have to be very controlled to make sure this virus you mutate doesn't create something...the way that the virus started in Wuhan, to be honest."#DirectedEvolutionpic.twitter.com/xaRvlD5qTo
“[…] our findings support the hypothesis that the intrauterine environment, particularly essential and non-essential metals, affect epigenetic aging biomarkers across the life course.”
Credit: 2024 Bozack et al.
“[…] our findings support the hypothesis that the intrauterine environment, particularly essential and non-essential metals, affect epigenetic aging biomarkers across the life course.”
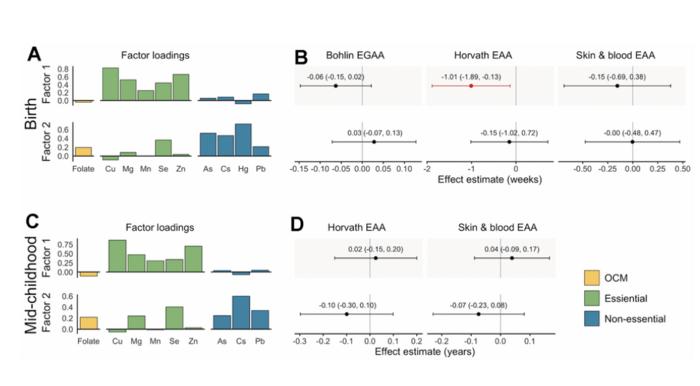
BUFFALO, NY- March 12, 2024 – A new research paper was published inAging (listed by MEDLINE/PubMed as “Aging (Albany NY)” and “Aging-US” by Web of Science) Volume 16, Issue 4, entitled, “Associations of prenatal one-carbon metabolism nutrients and metals with epigenetic aging biomarkers at birth and in childhood in a US cohort.”
Epigenetic gestational age acceleration (EGAA) at birth and epigenetic age acceleration (EAA) in childhood may be biomarkers of the intrauterine environment. In this new study, researchers Anne K. Bozack, Sheryl L. Rifas-Shiman, Andrea A. Baccarelli, Robert O. Wright, Diane R. Gold, Emily Oken, Marie-France Hivert, and Andres Cardenas from Stanford University School of Medicine, Harvard Medical School, Harvard T.H. Chan School of Public Health, Columbia University, and Icahn School of Medicine at Mount Sinai investigated the extent to which first-trimester folate, B12, 5 essential and 7 non-essential metals in maternal circulation are associated with EGAA and EAA in early life.
“[…] we hypothesized that OCM [one-carbon metabolism] nutrients and essential metals would be positively associated with EGAA and non-essential metals would be negatively associated with EGAA. We also investigated nonlinear associations and associations with mixtures of micronutrients and metals.”
Bohlin EGAA and Horvath pan-tissue and skin and blood EAA were calculated using DNA methylation measured in cord blood (N=351) and mid-childhood blood (N=326; median age = 7.7 years) in the Project Viva pre-birth cohort. A one standard deviation increase in individual essential metals (copper, manganese, and zinc) was associated with 0.94-1.2 weeks lower Horvath EAA at birth, and patterns of exposures identified by exploratory factor analysis suggested that a common source of essential metals was associated with Horvath EAA. The researchers also observed evidence of nonlinear associations of zinc with Bohlin EGAA, magnesium and lead with Horvath EAA, and cesium with skin and blood EAA at birth. Overall, associations at birth did not persist in mid-childhood; however, arsenic was associated with greater EAA at birth and in childhood.
“Prenatal metals, including essential metals and arsenic, are associated with epigenetic aging in early life, which might be associated with future health.”
Read the full paper: DOI:https://doi.org/10.18632/aging.205602
Corresponding Author: Andres Cardenas
Corresponding Email:andres.cardenas@stanford.edu
Keywords: epigenetic age acceleration, metals, folate, B12, prenatal exposures
Click here to sign up for free Altmetric alerts about this article.
About Aging:
Launched in 2009, Aging publishes papers of general interest and biological significance in all fields of aging research and age-related diseases, including cancer—and now, with a special focus on COVID-19 vulnerability as an age-dependent syndrome. Topics in Aging go beyond traditional gerontology, including, but not limited to, cellular and molecular biology, human age-related diseases, pathology in model organisms, signal transduction pathways (e.g., p53, sirtuins, and PI-3K/AKT/mTOR, among others), and approaches to modulating these signaling pathways.
Please visit our website at www.Aging-US.com and connect with us:
National insurance, income tax, VAT, capital gains tax, inheritance tax… it’s easy to get confused about the many different ways we contribute to the cost of running the country. The budget announcement is the key time each year when the government shares its financial plans with us all, and announces changes that may make a tangible difference to what you pay.
But you’ll likely be hearing a lot more about taxes in the coming months – promises to cut or raise them are an easy win (or lose) for politicians in an election year. We may even get at least one “mini-budget”.
If you’ve recently entered the workforce or the housing market, you may still be wrapping your mind around all of these terms. Here is what you need to know about the different types of taxes and how they affect you.
The UK broadly uses three ways to collect tax:
1. When you earn money
If you are an employee or own a business, taxes are deducted from your salary or profits you make. For most people, this happens in two ways: income tax, and national insurance contributions (or NICs).
If you are self-employed, you will have to pay your taxes via an annual tax return assessment. You might also have to pay taxes this way for interest you earn on savings, dividends (distribution of profits from a company or shares you own) received and most other forms of income not taxed before you get it.
VAT and excise duties are taxes on most goods and services you buy, with some exceptions like books and children’s clothing. About 20% of the total tax collected is VAT.
3. Taxes on wealth and assets
These are mainly taxes on the money you earn if you sell assets (like property or stocks) for more than you bought them for, or when you pass on assets in an inheritance. In the latter case in the UK, the recipient doesn’t pay this, it is the estate paying it out that must cover this if due. These taxes contribute only about 3% to the total tax collected.
You also likely have to pay council tax, which is set by the council you live in based on the value of your house or flat. It is paid by the user of the property, no matter if you own or rent. If you are a full-time student or on some apprenticeship schemes, you may get a deduction or not have to pay council tax at all.
This article is part of Quarter Life, a series about issues affecting those of us in our 20s and 30s. From the challenges of beginning a career and taking care of our mental health, to the excitement of starting a family, adopting a pet or just making friends as an adult. The articles in this series explore the questions and bring answers as we navigate this turbulent period of life.
Put together, these totalled almost £790 billion in 2022-23, which the government spends on public services such as the NHS, schools and social care. The government collects taxes from all sources and sets its spending plans accordingly, borrowing to make up any difference between the two.
Income tax
The amount of income tax you pay is determined by where your income sits in a series of “bands” set by the government. Almost everyone is entitled to a “personal allowance”, currently £12,570, which you can earn without needing to pay any income tax.
You then pay 20% in tax on each pound of income you earn (across all sources) from £12,570-£50,270. You pay 40% on each extra pound up to £125,140 and 45% over this. If you earn more than £100,000, the personal allowance (amount of untaxed income) starts to decrease.
If you are self-employed, the same rates apply to you. You just don’t have an employer to take this off your salary each month. Instead, you have to make sure you have enough money at the end of the year to pay this directly to the government.
The government can increase the threshold limits to adjust for inflation. This tries to ensure any wage rise you get in response to higher prices doesn’t lead to you having to pay a higher tax rate. However, the government announced in 2021 that they would freeze these thresholds until 2026 (extended now to 2028), arguing that it would help repay the costs of the pandemic.
Given wages are now rising for many to help with the cost of living crisis, this means many people will pay more income tax this coming year than they did before. This is sometimes referred to as “fiscal drag” – where lower earners are “dragged” into paying higher tax rates, or being taxed on more of their income.
National insurance
National insurance contributions (NICs) are a second “tax” you pay on your income – or to be precise, on your earned income (your salary). You don’t pay this on some forms of income, including savings or dividends, and you also don’t pay it once you reach state retirement age (currently 66).
While Jeremy Hunt, the current chancellor of the exchequer, didn’t adjust income tax meaningfully in this year’s budget, he did announce a cut to NICs. This was a surprise to many, as we had already seen rates fall from 12% to 10% on incomes higher than £242/week in January. It will now fall again to 8% from April.
While this is charged separately to income tax, in reality it all just goes into one pot with other taxes. Some, including the chancellor, say it is time to merge these two deductions and make this simpler for everyone. In his budget speech this year, Hunt said he’d like to see this tax go entirely. He thinks this isn’t fair on those who have to pay it, as it is only charged on some forms of income and on some workers.
I wouldn’t hold my breath for this to happen however, and even if it did, there are huge sums linked to NICs (nearly £180bn last year) so it would almost certainly have to be collected from elsewhere (such as via an increase in income taxes, or a lot more borrowing) to make sure the government could still balance its books.
There are likely to be further tweaks to the UK’s tax system soon, perhaps by the current government before the election – and almost certainly if there is a change of government.
Wealth taxes may be in line for a change. In the budget, the chancellor reduced capital gains taxes on sales of assets such as second properties (from 28% to 24%). These types of taxes provide only a limited amount of money to the government, as quite high thresholds apply for inheritance tax (up to £1 million if you are passing on a family home).
There are calls from many quarters though to look again at these types of taxes. Wealth inequality (the differences between total wealth held by the richest compared to the poorest) in the UK is very high (much higher than income inequality) and rising.
But how to do this effectively is a matter of much debate. A recent study suggested a one-off tax on total wealth held over a certain threshold might work. But wealth taxes are challenging to make work in practice, and both main political parties have already said this isn’t an option they are considering currently.
Andy Lymer and his colleagues at the Centre for Personal Financial Wellbeing at Aston University currently or have recently received funding for their research work from a variety of funding bodies including the UK's Money and Pension Service, the Aviva Foundation, Fair4All Finance, NEST Insight, the Gambling Commission, Vivid Housing and the ESRC, amongst others.
We use cookies on our website to give you the most relevant experience by remembering your preferences and repeat visits. By clicking “Accept”, you consent to the use of ALL the cookies.
This website uses cookies to improve your experience while you navigate through the website. Out of these, the cookies that are categorized as necessary are stored on your browser as they are essential for the working of basic functionalities of the website. We also use third-party cookies that help us analyze and understand how you use this website. These cookies will be stored in your browser only with your consent. You also have the option to opt-out of these cookies. But opting out of some of these cookies may affect your browsing experience.
Necessary cookies are absolutely essential for the website to function properly. These cookies ensure basic functionalities and security features of the website, anonymously.
Cookie
Duration
Description
cookielawinfo-checbox-analytics
11 months
This cookie is set by GDPR Cookie Consent plugin. The cookie is used to store the user consent for the cookies in the category "Analytics".
cookielawinfo-checbox-functional
11 months
The cookie is set by GDPR cookie consent to record the user consent for the cookies in the category "Functional".
cookielawinfo-checbox-others
11 months
This cookie is set by GDPR Cookie Consent plugin. The cookie is used to store the user consent for the cookies in the category "Other.
cookielawinfo-checkbox-necessary
11 months
This cookie is set by GDPR Cookie Consent plugin. The cookies is used to store the user consent for the cookies in the category "Necessary".
cookielawinfo-checkbox-performance
11 months
This cookie is set by GDPR Cookie Consent plugin. The cookie is used to store the user consent for the cookies in the category "Performance".
viewed_cookie_policy
11 months
The cookie is set by the GDPR Cookie Consent plugin and is used to store whether or not user has consented to the use of cookies. It does not store any personal data.
Functional cookies help to perform certain functionalities like sharing the content of the website on social media platforms, collect feedbacks, and other third-party features.
Performance cookies are used to understand and analyze the key performance indexes of the website which helps in delivering a better user experience for the visitors.
Analytical cookies are used to understand how visitors interact with the website. These cookies help provide information on metrics the number of visitors, bounce rate, traffic source, etc.
Advertisement cookies are used to provide visitors with relevant ads and marketing campaigns. These cookies track visitors across websites and collect information to provide customized ads.


