Government
Latinos support Democrats over Republicans 2-1 in House and Senate elections
The Latino electorate was once again pivotal to election outcomes across the nation, including key Senate races in Nevada, Arizona, and Colorado. The 2022…
Share this:

By Gabriel R. Sanchez
The Latino electorate was once again pivotal to election outcomes across the nation, including key Senate races in Nevada, Arizona, and Colorado. The 2022 Midterm Voter Election Poll, conducted by the African American Research Collaborative (AARC), has a large sample of Latino voters with enough samples from key states (n-400 per state) to explore important differences across the diverse Latino electorate.
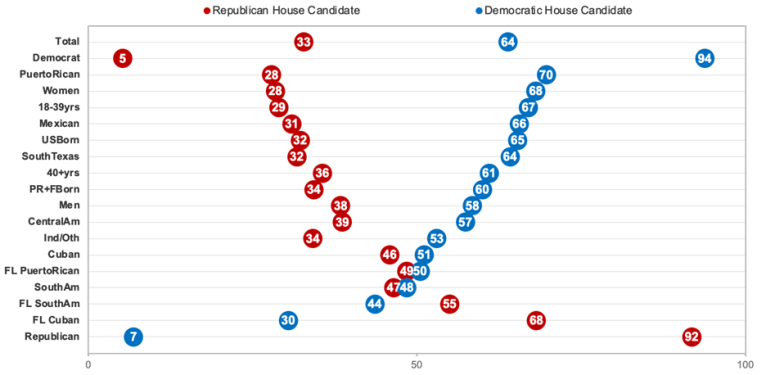
Latino voters remained solidly Democratic in their voting preferences in 2022, with 64% of Latinos reporting that they voted for a Democratic house candidate, compared to 33% who reported they voted for Republican candidates. The final 3% voted for a candidate from another party. As reflected in the figure below, there was a similar distribution among Latino voters across Senate races.
Latinos support for Democratic house candidates decreased by 5% from 2020, but the movement toward the GOP was not as pronounced as pre-election surveys suggested it might be this cycle. This analysis points to a small but consistent shift among Latinos toward the Republican Party across most sub-groups of the overall Latino electorate. This modest shift was nowhere near large enough to help the ‘red wave’ materialize in 2022 and is consistent with historic shifts in vote choice away from the president’s party in off-year elections during their first term in office.
The Role of Latinas in the 2022 Midterms
My pre-election analysis suggested that Latinas were a key sub-group of the Latino electorate whose movement toward the Republican Party was noticeable over time. Latinas defied pre-election surveys and once again voted for Democratic candidates at a high level, with 68% of Latinas casting ballots for Democratic House candidates, higher than the 58% for Latino men. The 10% gender gap among Latinos in 2022 mirrors the gap in the 2016 election.
Latinas were twice as likely to indicate that the most important issue driving their voting decision this cycle was women’s reproductive health and abortion relative to Latino men, with 16% of Latinas across the country noting that this was the most important issue that drove their decision for who to vote for in their congressional district. Conversely, Latino men were twice as likely to indicate that they “always vote Republican” in congressional races relative to Latinas (17% for Latino men/9% for Latinas). The survey numbers suggest that the Democrats’ focus on access to abortion helped stall the movement toward the GOP among Latinas.
Latinos Partisan Preferences by Age, Origin, and Religion
Latinos’ voting differences across age groups also show stark differences and important trends. Latinos under the age of 40 were more likely to vote for a Democratic candidate in 2022 (67%) compared to 60% among Latinos over 40. This is almost identical to the Democratic voting percentages for Latinos under 40 years of age in 2020. However, there was a noticeable decrease in the Democratic vote share among Latinos over the age of 60, 74% of whom voted for a Democratic House candidate in 2020 compared to 61% in 2022. Biden’s approval rating of 59% among Latinos 60 years of age or older was lower than Latinos of younger ages, and Latinos 60 or older were the most likely to identify “inflation and cost of living” as the most important issue that drove their congressional vote at 21%.
Latino House Vote by Demographic Profile
Source: 2022 AARC Midterm Voter Election Poll
Democrats did not do as well in the battle for Independent voters in 2022, with 53% of self-identified Latino Independents voting for a Democratic candidate in 2022 compared to 60% in 2020. Gas prices were particularly salient to Latino Independents who were twice as likely as Latino Democrats or Republicans to identify gas prices as the most important issue that drove their congressional voting decision. Democrats also lost some ground among partisans, with 94% of self-identified Democrats voting for a candidate from their party in 2022 compared to 96% in 2020. Similarly, 7% of self-identified Republicans voted for a Democratic candidate in 2022 compared to 10% in 2020.
Although there were no major national-origin groups among Latinos that had higher Republican support than Democratic, there were razor thin margins for Cuban American and South American Latinos who supported Republicans at rates of 46% and 47%, respectively. Cuban Americans were one of the few sub-groups of Latino voters who shifted toward the Democrats in 2022—55% Republican in 2020. However, South Americans increased their Republican percentage by a large margin, +18% from 2020.
In an election season where abortion policy was a major theme, we wanted to explore variation based on religiosity. Given media narratives about Latinos being more religious and thus socially conservative on issues such as abortion, 2022 was an important election to examine those claims. Support for Republican candidates increased with the importance of religion in Latinos’ daily lives; only 24% of Latinos who indicated that religion was not important to their daily lives voting for a Republican House candidate, compared to 33% for those for whom religion is somewhat important, and 37% for Latinos whose religion is very important to their daily lives.
Latino Voting Preferences by State
Democratic support among Latinos in the critical states of Michigan (74%), Pennsylvania (73%) and Colorado (71%) proved vital in Senate and governors races. Florida was the lone state where the majority of Latino voters supported Republican house candidates (54%), and the Latino vote mirrored the overall electorate in the state of Florida which was one of the few states where Republicans performed up to pre-election expectations.

Source: 2022 AARC Midterm Voter Election Poll
The electoral consequences of the shift in Latino voting behavior from 2020 is most apparent when we look at state level variation. Georgia had the most dramatic shift across key states this cycle with a 13% decrease in Latino Democratic vote relative to 2020, and Pennsylvania also saw a significant decrease of 9%. Although votes are still being counted in Georgia, it does not appear as though this Latino movement in 2022 cost Democrats valuable Senate seats.

Source: 2022 AARC Midterm Voter Election Poll; 2020 American Election Eve Poll
Similarly, although Latinos in Colorado were more balanced in their voting behavior in 2022, the solid 71% Democratic support among Latinos in Colorado helped make this a big night for Democrats in the state. Fresh survey data from Colorado reveals that Latino voters overwhelmingly supported Democratic Latina candidate Yadira Caraveo at 75%, with higher Democratic vote support in this district than the state overall.
Latinos comprised 1 in 5 of Nevada’s electorate this fall, making the Latino vote critical to the surprisingly tight Senate race in the state featuring incumbent Cortez-Masto, the first Latina elected to the U.S. Senate. Nevada was a state where Democrats saw a slight but important gain in Latino support which may prove to be consequential in a too-close-to-call Senate race. Latinos supported Cortez-Masto to Republican nominee Adam Laxalt 63% to 35%, a margin which may prove to be enough to help the Latina senator keep her seat, if Latino turnout is sufficiently high.
The Economy and Abortion Drove Voting Decisions for Latinos in House Races
Latinos have faced tremendous financial challenges over the past year, including disproportionately high unemployment rates that at one point were nearly three times as high as the national average. It is, therefore, not surprising that when asked to identify the most important policy issues that drove their congressional voting decision in 2022, “inflation/cost of living” was the leading issue for Latinos at 18%. When you add the “price of gas” at 5% and the “cost of healthcare” also at 5%, it was clear that the economy was the dominant theme for Latino voters in 2022.
The fact that jobs and the economy was second only to the COVID pandemic among Latino voters in 2020 speaks to just how difficult the last two years have been on the economic well-being of the Latino community. The party who can gain Latinos’ trust in improving their personal economic standing will stand to do well with Latino voters in 2024.
One of the dominant themes in this year’s race following the Dobbs decision was abortion policy. This led 9% of Latinos to identify “women’s reproductive and abortion rights” as their most important issue that impacted their House vote, second only to inflation/cost of living across all policy issues.
President Biden and major Democratic surrogates’ (including former President Obama) closing message to voters focusing on the protection of democracy, did not gain high traction with Latino voters. Only 1% of Latino voters identified “election reform and protecting voting rights” as the policy that drove their voting decision.
The Latino Policy Agenda and Looking Ahead to 2024
In sum, the policy priorities of the Latino electorate gives both parties a clear idea of the Latino policy agenda at this point in time. When asked to identify the most important issues that they want Congress and the president to address moving forward, Latino voters want to see action taken on the rising cost of living and inflation, including a particular focus on lowering the cost of gas. Protecting women’s reproductive health care rights is the next most commonly identified policy priority among Latinos. Latinos also want to see policy action to address gun violence and mass shootings (23%) and the cost of health care (22%). Rounding out the top policies on the Latino agenda is climate change/extreme weather (16%).
As we concluded the campaign season, our attention immediately turned to the implications of the 2022 midterm election on the presidential race that will come in two years. When asked if they would be worried if “Donald Trump becomes President again he will promote hate and division and our country will fall apart” a majority of 59% of Latino voters are worried, 43% are very worried. If Trump does represent the GOP in 2024, it is likely that this high concern among Latinos will generate even higher turnout and Democratic support than what we observed in 2022.
unemployment pandemic congress senate trump unemploymentGovernment
Are Voters Recoiling Against Disorder?
Are Voters Recoiling Against Disorder?
Authored by Michael Barone via The Epoch Times (emphasis ours),
The headlines coming out of the Super…
Share this:


Authored by Michael Barone via The Epoch Times (emphasis ours),
The headlines coming out of the Super Tuesday primaries have got it right. Barring cataclysmic changes, Donald Trump and Joe Biden will be the Republican and Democratic nominees for president in 2024.
With Nikki Haley’s withdrawal, there will be no more significantly contested primaries or caucuses—the earliest both parties’ races have been over since something like the current primary-dominated system was put in place in 1972.
The primary results have spotlighted some of both nominees’ weaknesses.
Donald Trump lost high-income, high-educated constituencies, including the entire metro area—aka the Swamp. Many but by no means all Haley votes there were cast by Biden Democrats. Mr. Trump can’t afford to lose too many of the others in target states like Pennsylvania and Michigan.
Majorities and large minorities of voters in overwhelmingly Latino counties in Texas’s Rio Grande Valley and some in Houston voted against Joe Biden, and even more against Senate nominee Rep. Colin Allred (D-Texas).
Returns from Hispanic precincts in New Hampshire and Massachusetts show the same thing. Mr. Biden can’t afford to lose too many Latino votes in target states like Arizona and Georgia.
When Mr. Trump rode down that escalator in 2015, commentators assumed he’d repel Latinos. Instead, Latino voters nationally, and especially the closest eyewitnesses of Biden’s open-border policy, have been trending heavily Republican.
High-income liberal Democrats may sport lawn signs proclaiming, “In this house, we believe ... no human is illegal.” The logical consequence of that belief is an open border. But modest-income folks in border counties know that flows of illegal immigrants result in disorder, disease, and crime.
There is plenty of impatience with increased disorder in election returns below the presidential level. Consider Los Angeles County, America’s largest county, with nearly 10 million people, more people than 40 of the 50 states. It voted 71 percent for Mr. Biden in 2020.
Current returns show county District Attorney George Gascon winning only 21 percent of the vote in the nonpartisan primary. He’ll apparently face Republican Nathan Hochman, a critic of his liberal policies, in November.
Gascon, elected after the May 2020 death of counterfeit-passing suspect George Floyd in Minneapolis, is one of many county prosecutors supported by billionaire George Soros. His policies include not charging juveniles as adults, not seeking higher penalties for gang membership or use of firearms, and bringing fewer misdemeanor cases.
The predictable result has been increased car thefts, burglaries, and personal robberies. Some 120 assistant district attorneys have left the office, and there’s a backlog of 10,000 unprosecuted cases.
More than a dozen other Soros-backed and similarly liberal prosecutors have faced strong opposition or have left office.
St. Louis prosecutor Kim Gardner resigned last May amid lawsuits seeking her removal, Milwaukee’s John Chisholm retired in January, and Baltimore’s Marilyn Mosby was defeated in July 2022 and convicted of perjury in September 2023. Last November, Loudoun County, Virginia, voters (62 percent Biden) ousted liberal Buta Biberaj, who declined to prosecute a transgender student for assault, and in June 2022 voters in San Francisco (85 percent Biden) recalled famed radical Chesa Boudin.
Similarly, this Tuesday, voters in San Francisco passed ballot measures strengthening police powers and requiring treatment of drug-addicted welfare recipients.
In retrospect, it appears the Floyd video, appearing after three months of COVID-19 confinement, sparked a frenzied, even crazed reaction, especially among the highly educated and articulate. One fatal incident was seen as proof that America’s “systemic racism” was worse than ever and that police forces should be defunded and perhaps abolished.
2020 was “the year America went crazy,” I wrote in January 2021, a year in which police funding was actually cut by Democrats in New York, Los Angeles, San Francisco, Seattle, and Denver. A year in which young New York Times (NYT) staffers claimed they were endangered by the publication of Sen. Tom Cotton’s (R-Ark.) opinion article advocating calling in military forces if necessary to stop rioting, as had been done in Detroit in 1967 and Los Angeles in 1992. A craven NYT publisher even fired the editorial page editor for running the article.
Evidence of visible and tangible discontent with increasing violence and its consequences—barren and locked shelves in Manhattan chain drugstores, skyrocketing carjackings in Washington, D.C.—is as unmistakable in polls and election results as it is in daily life in large metropolitan areas. Maybe 2024 will turn out to be the year even liberal America stopped acting crazy.
Chaos and disorder work against incumbents, as they did in 1968 when Democrats saw their party’s popular vote fall from 61 percent to 43 percent.
Views expressed in this article are opinions of the author and do not necessarily reflect the views of The Epoch Times or ZeroHedge.
Government
Veterans Affairs Kept COVID-19 Vaccine Mandate In Place Without Evidence
Veterans Affairs Kept COVID-19 Vaccine Mandate In Place Without Evidence
Authored by Zachary Stieber via The Epoch Times (emphasis ours),
The…
Share this:


Authored by Zachary Stieber via The Epoch Times (emphasis ours),
The U.S. Department of Veterans Affairs (VA) reviewed no data when deciding in 2023 to keep its COVID-19 vaccine mandate in place.
VA Secretary Denis McDonough said on May 1, 2023, that the end of many other federal mandates “will not impact current policies at the Department of Veterans Affairs.”
He said the mandate was remaining for VA health care personnel “to ensure the safety of veterans and our colleagues.”
Mr. McDonough did not cite any studies or other data. A VA spokesperson declined to provide any data that was reviewed when deciding not to rescind the mandate. The Epoch Times submitted a Freedom of Information Act for “all documents outlining which data was relied upon when establishing the mandate when deciding to keep the mandate in place.”
The agency searched for such data and did not find any.
“The VA does not even attempt to justify its policies with science, because it can’t,” Leslie Manookian, president and founder of the Health Freedom Defense Fund, told The Epoch Times.
“The VA just trusts that the process and cost of challenging its unfounded policies is so onerous, most people are dissuaded from even trying,” she added.
The VA’s mandate remains in place to this day.
The VA’s website claims that vaccines “help protect you from getting severe illness” and “offer good protection against most COVID-19 variants,” pointing in part to observational data from the U.S. Centers for Disease Control and Prevention (CDC) that estimate the vaccines provide poor protection against symptomatic infection and transient shielding against hospitalization.
There have also been increasing concerns among outside scientists about confirmed side effects like heart inflammation—the VA hid a safety signal it detected for the inflammation—and possible side effects such as tinnitus, which shift the benefit-risk calculus.
President Joe Biden imposed a slate of COVID-19 vaccine mandates in 2021. The VA was the first federal agency to implement a mandate.
President Biden rescinded the mandates in May 2023, citing a drop in COVID-19 cases and hospitalizations. His administration maintains the choice to require vaccines was the right one and saved lives.
“Our administration’s vaccination requirements helped ensure the safety of workers in critical workforces including those in the healthcare and education sectors, protecting themselves and the populations they serve, and strengthening their ability to provide services without disruptions to operations,” the White House said.
Some experts said requiring vaccination meant many younger people were forced to get a vaccine despite the risks potentially outweighing the benefits, leaving fewer doses for older adults.
“By mandating the vaccines to younger people and those with natural immunity from having had COVID, older people in the U.S. and other countries did not have access to them, and many people might have died because of that,” Martin Kulldorff, a professor of medicine on leave from Harvard Medical School, told The Epoch Times previously.
The VA was one of just a handful of agencies to keep its mandate in place following the removal of many federal mandates.
“At this time, the vaccine requirement will remain in effect for VA health care personnel, including VA psychologists, pharmacists, social workers, nursing assistants, physical therapists, respiratory therapists, peer specialists, medical support assistants, engineers, housekeepers, and other clinical, administrative, and infrastructure support employees,” Mr. McDonough wrote to VA employees at the time.
“This also includes VA volunteers and contractors. Effectively, this means that any Veterans Health Administration (VHA) employee, volunteer, or contractor who works in VHA facilities, visits VHA facilities, or provides direct care to those we serve will still be subject to the vaccine requirement at this time,” he said. “We continue to monitor and discuss this requirement, and we will provide more information about the vaccination requirements for VA health care employees soon. As always, we will process requests for vaccination exceptions in accordance with applicable laws, regulations, and policies.”
The version of the shots cleared in the fall of 2022, and available through the fall of 2023, did not have any clinical trial data supporting them.
A new version was approved in the fall of 2023 because there were indications that the shots not only offered temporary protection but also that the level of protection was lower than what was observed during earlier stages of the pandemic.
Ms. Manookian, whose group has challenged several of the federal mandates, said that the mandate “illustrates the dangers of the administrative state and how these federal agencies have become a law unto themselves.”
Government
Low Iron Levels In Blood Could Trigger Long COVID: Study
Low Iron Levels In Blood Could Trigger Long COVID: Study
Authored by Amie Dahnke via The Epoch Times (emphasis ours),
People with inadequate…
Share this:


Authored by Amie Dahnke via The Epoch Times (emphasis ours),
People with inadequate iron levels in their blood due to a COVID-19 infection could be at greater risk of long COVID.
A new study indicates that problems with iron levels in the bloodstream likely trigger chronic inflammation and other conditions associated with the post-COVID phenomenon. The findings, published on March 1 in Nature Immunology, could offer new ways to treat or prevent the condition.
Long COVID Patients Have Low Iron Levels
Researchers at the University of Cambridge pinpointed low iron as a potential link to long-COVID symptoms thanks to a study they initiated shortly after the start of the pandemic. They recruited people who tested positive for the virus to provide blood samples for analysis over a year, which allowed the researchers to look for post-infection changes in the blood. The researchers looked at 214 samples and found that 45 percent of patients reported symptoms of long COVID that lasted between three and 10 months.
In analyzing the blood samples, the research team noticed that people experiencing long COVID had low iron levels, contributing to anemia and low red blood cell production, just two weeks after they were diagnosed with COVID-19. This was true for patients regardless of age, sex, or the initial severity of their infection.
According to one of the study co-authors, the removal of iron from the bloodstream is a natural process and defense mechanism of the body.
But it can jeopardize a person’s recovery.
“When the body has an infection, it responds by removing iron from the bloodstream. This protects us from potentially lethal bacteria that capture the iron in the bloodstream and grow rapidly. It’s an evolutionary response that redistributes iron in the body, and the blood plasma becomes an iron desert,” University of Oxford professor Hal Drakesmith said in a press release. “However, if this goes on for a long time, there is less iron for red blood cells, so oxygen is transported less efficiently affecting metabolism and energy production, and for white blood cells, which need iron to work properly. The protective mechanism ends up becoming a problem.”
The research team believes that consistently low iron levels could explain why individuals with long COVID continue to experience fatigue and difficulty exercising. As such, the researchers suggested iron supplementation to help regulate and prevent the often debilitating symptoms associated with long COVID.
“It isn’t necessarily the case that individuals don’t have enough iron in their body, it’s just that it’s trapped in the wrong place,” Aimee Hanson, a postdoctoral researcher at the University of Cambridge who worked on the study, said in the press release. “What we need is a way to remobilize the iron and pull it back into the bloodstream, where it becomes more useful to the red blood cells.”
The research team pointed out that iron supplementation isn’t always straightforward. Achieving the right level of iron varies from person to person. Too much iron can cause stomach issues, ranging from constipation, nausea, and abdominal pain to gastritis and gastric lesions.
1 in 5 Still Affected by Long COVID
COVID-19 has affected nearly 40 percent of Americans, with one in five of those still suffering from symptoms of long COVID, according to the U.S. Centers for Disease Control and Prevention (CDC). Long COVID is marked by health issues that continue at least four weeks after an individual was initially diagnosed with COVID-19. Symptoms can last for days, weeks, months, or years and may include fatigue, cough or chest pain, headache, brain fog, depression or anxiety, digestive issues, and joint or muscle pain.


Veterans Affairs Kept COVID-19 Vaccine Mandate In Place Without Evidence


When Military Rule Supplants Democracy


The Digest #187


Redefining Poverty: Towards a Transpartisan Approach


Students lose out as cities and states give billions in property tax breaks to businesses − draining school budgets and especially hurting the poorest students


Is the United States overestimating China’s power?


Biden to call for first-time homebuyer tax credit, construction of 2 million homes


GBPINR: Analysis and Projections for 2024


Low Iron Levels In Blood Could Trigger Long COVID: Study


Walmart has really good news for shoppers (and Joe Biden)
-

 Uncategorized2 weeks ago
All Of The Elements Are In Place For An Economic Crisis Of Staggering Proportions
-

 Uncategorized1 month ago
Cathie Wood sells a major tech stock (again)
-

 Uncategorized3 weeks ago
California Counties Could Be Forced To Pay $300 Million To Cover COVID-Era Program
-

 Uncategorized2 weeks ago
Apparel Retailer Express Moving Toward Bankruptcy
-

 Uncategorized3 weeks ago
Industrial Production Decreased 0.1% in January
-

 International2 days ago
Walmart launches clever answer to Target’s new membership program
-

 International2 days ago
EyePoint poaches medical chief from Apellis; Sandoz CFO, longtime BioNTech exec to retire
-

 Uncategorized3 weeks ago
RFK Jr: The Wuhan Cover-Up & The Rise Of The Biowarfare-Industrial Complex