Connect with us

Uncategorized

Lab-grown mini lungs could accelerate the study of respiratory diseases

When we’re driving to a new destination, we often turn down the stereo as we follow the directions. What had been music suddenly sounds like noise, and…

Published

on

When we’re driving to a new destination, we often turn down the stereo as we follow the directions. What had been music suddenly sounds like noise, and it interferes with our focus.

Credit: Laboratory of Synthetic Biology at The Rockefeller University

When we’re driving to a new destination, we often turn down the stereo as we follow the directions. What had been music suddenly sounds like noise, and it interferes with our focus.

Our understanding of how infectious diseases like COVID affect human lungs has been similarly confounded by noise. Data from patient lung tissues greatly varies from person to person, obscuring the basic mechanisms of how, exactly, SARS-Co-V2 first infects lung cells. It’s also an after-the-fact analysis—as if we’re trying to map the route the virus took three states back.

Turning down the noise of variability by studying genetically identical tissues from the first moment of infection could light up the route the pathogen takes. Which cells are infected, and when? What is the level of infection, and how does it differ depending on cell type? How does it change in different conditions?

And what if it were possible to track thousands of these infections at once? It might revolutionize our understanding of both infections and the drug treatments used to combat them.

That’s the hope for new advanced tech capable of growing mini organs on microchips. The labs of Rockefeller’s Ali Brivanlou and Charles M. Rice collaborated to refine a cell culture technology platform that grows genetically identical lung buds—the embryonic structures that give rise to our breathing organs—from human embryonic stem cells (hESCs). Their findings were recently published in Stem Cell Reports.

When placed on an array of microchips and carefully dosed with a custom cocktail of signaling molecules, the hESCs rapidly organize themselves into “micro lungs” that have full tissue complexity. These buds can be cultured by the thousands, allowing for an unprecedented high-throughput analysis of lung tissue infection without all the noisy variables.

The result is unlimited, fast, and scalable access to lung tissue that has the key hallmarks of human lung development and can be used to track lung infections and identify candidate therapeutics.

“These lungs are basically clones,” says Ali Brivanlou. “They have the exact same DNA signature. That way we don’t have to worry about one patient responding differently from another. Quantification allows us to keep the genetic information constant and measure the key variable—the virus.”

Building a better mini lung

Embryonic stem cells are the Ur-cells of the human body. They can infinitely divide to create more stem cells or to differentiate into any other tissue. Brivanlou’s Laboratory of Synthetic Biology has long explored their potential.

Brivanlou joined forces with Rockefeller colleague Charles M. Rice during the COVID pandemic: his lab had the microchip technology to grow lung buds, and Rice’s lab had the necessary biosafety clearance required to infect them with SARS-Co-V2 and study the outcome.

In 2021, first authors Edwin Rosado-Olivieri, a stem cell biologist in Brivanlou’s lab, and Brandon Razooky, then a postdoc in Rice’s Laboratory of Virology and Infectious Disease, began coaxing the cells to organize into more specialized forms. Stem cells don’t just organize on their own. They need a confined space—such as a microchip well—and stimuli to spark change. The stimuli come from four main signaling pathways that induce stem cells to differentiate into specific cell types.

After about two weeks, the group’s lung cells had formed identical buds whose molecular profiles closely matched those seen in the earliest stages of fetal lung development—including the formation of airways and alveoli, structures known to be damaged in many people with severe COVID.

Identifying a key culprit

Since then, they’ve used the platform to understand how SARS-Co-V2 infects different lung cells.

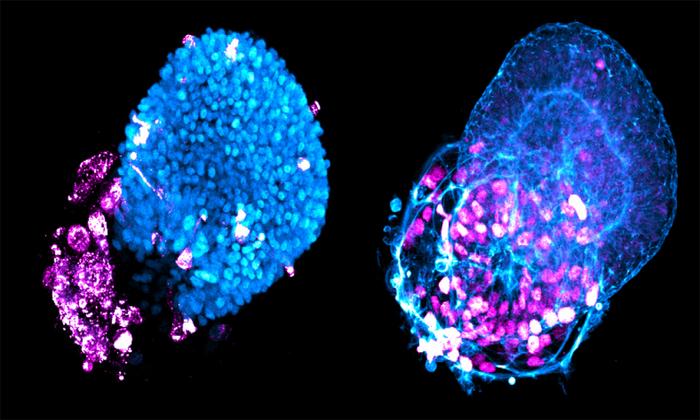
Alveoli are tiny sacs at the end of the lung branches that manage the gas exchange performed with every breath: oxygen in, carbon dioxide out. By studying cloned alveoli cells en masse, the researchers discovered that alveoli were more susceptible to SARS-Co-V-2 infection than airway cells, which are the guardians of the organ—the first defense against all inhaled threats. If the virus got past them, the alveoli were sitting ducks.

Another view of virus particles (blue) infecting alveolar and airway tissues (red).

They also hit upon a winning combination of signaling proteins for creating the most robust batches of lung buds—a mix of keratinocyte growth factor (KGF) and bone morphogenetic protein 4 (BMP4). Both contribute to cell differentiation and growth.

Interestingly, the BMP pathway has a downside. When they compared infected lung buds to postmortem tissue of COVID patients, they found that the BMP signaling pathway was induced in both and rendered the tissues more vulnerable to infection. Blocking the BMP pathway made the cells less vulnerable.

Beyond COVID

The researchers note that the platform can also be used to investigate the mechanisms of influenza, RSV, pulmonary diseases, and lung cancer, among other diseases. Moreover, it can be used to screen for new drugs to treat them.

And lungs are far from the only organ of interest. “The broader focus of our work is understanding cellular development to make synthetic organs and tissues that we can use to model diseases and find therapeutic mechanisms,” says Rosado-Olivieri. The liver, kidney, and pancreas are all likely next targets.

“The platform will also allow us to respond to the next pandemic with much more speed and precision,” Brivanlou adds. “We can quickly capitalize on this platform to make a virus visible and develop therapies much faster than we did for COVID. It can be used to screen for drugs, compounds, vaccines, monoclonal antibodies, and more directly in human tissue. This technology is ready to confront all kinds of threats that may hit us in the future.”


Read More

Continue Reading

Uncategorized

Aging at AACR Annual Meeting 2024

BUFFALO, NY- March 11, 2024 – Impact Journals publishes scholarly journals in the biomedical sciences with a focus on all areas of cancer and aging…

Published

on

BUFFALO, NY- March 11, 2024 – Impact Journals publishes scholarly journals in the biomedical sciences with a focus on all areas of cancer and aging research. Aging is one of the most prominent journals published by Impact Journals

Credit: Impact Journals

BUFFALO, NY- March 11, 2024 – Impact Journals publishes scholarly journals in the biomedical sciences with a focus on all areas of cancer and aging research. Aging is one of the most prominent journals published by Impact Journals

Impact Journals will be participating as an exhibitor at the American Association for Cancer Research (AACR) Annual Meeting 2024 from April 5-10 at the San Diego Convention Center in San Diego, California. This year, the AACR meeting theme is “Inspiring Science • Fueling Progress • Revolutionizing Care.”

Visit booth #4159 at the AACR Annual Meeting 2024 to connect with members of the Aging team.

About Aging-US:

Aging publishes research papers in all fields of aging research including but not limited, aging from yeast to mammals, cellular senescence, age-related diseases such as cancer and Alzheimer’s diseases and their prevention and treatment, anti-aging strategies and drug development and especially the role of signal transduction pathways such as mTOR in aging and potential approaches to modulate these signaling pathways to extend lifespan. The journal aims to promote treatment of age-related diseases by slowing down aging, validation of anti-aging drugs by treating age-related diseases, prevention of cancer by inhibiting aging. Cancer and COVID-19 are age-related diseases.

Aging is indexed and archived by PubMed/Medline (abbreviated as “Aging (Albany NY)”), PubMed CentralWeb of Science: Science Citation Index Expanded (abbreviated as “Aging‐US” and listed in the Cell Biology and Geriatrics & Gerontology categories), Scopus (abbreviated as “Aging” and listed in the Cell Biology and Aging categories), Biological Abstracts, BIOSIS Previews, EMBASE, META (Chan Zuckerberg Initiative) (2018-2022), and Dimensions (Digital Science).

Please visit our website at www.Aging-US.com​​ and connect with us:

  • Aging X
  • Aging Facebook
  • Aging Instagram
  • Aging YouTube
  • Aging LinkedIn
  • Aging SoundCloud
  • Aging Pinterest
  • Aging Reddit

Click here to subscribe to Aging publication updates.

For media inquiries, please contact media@impactjournals.com.


Read More

Continue Reading

Uncategorized

NY Fed Finds Medium, Long-Term Inflation Expectations Jump Amid Surge In Stock Market Optimism

NY Fed Finds Medium, Long-Term Inflation Expectations Jump Amid Surge In Stock Market Optimism

One month after the inflation outlook tracked…

Published

on

NY Fed Finds Medium, Long-Term Inflation Expectations Jump Amid Surge In Stock Market Optimism

One month after the inflation outlook tracked by the NY Fed Consumer Survey extended their late 2023 slide, with 3Y inflation expectations in January sliding to a record low 2.4% (from 2.6% in December), even as 1 and 5Y inflation forecasts remained flat, moments ago the NY Fed reported that in February there was a sharp rebound in longer-term inflation expectations, rising to 2.7% from 2.4% at the three-year ahead horizon, and jumping to 2.9% from 2.5% at the five-year ahead horizon, while the 1Y inflation outlook was flat for the 3rd month in a row, stuck at 3.0%. 

The increases in both the three-year ahead and five-year ahead measures were most pronounced for respondents with at most high school degrees (in other words, the "really smart folks" are expecting deflation soon). The survey’s measure of disagreement across respondents (the difference between the 75th and 25th percentile of inflation expectations) decreased at all horizons, while the median inflation uncertainty—or the uncertainty expressed regarding future inflation outcomes—declined at the one- and three-year ahead horizons and remained unchanged at the five-year ahead horizon.

Going down the survey, we find that the median year-ahead expected price changes increased by 0.1 percentage point to 4.3% for gas; decreased by 1.8 percentage points to 6.8% for the cost of medical care (its lowest reading since September 2020); decreased by 0.1 percentage point to 5.8% for the cost of a college education; and surprisingly decreased by 0.3 percentage point for rent to 6.1% (its lowest reading since December 2020), and remained flat for food at 4.9%.

We find the rent expectations surprising because it is happening just asking rents are rising across the country.

At the same time as consumers erroneously saw sharply lower rents, median home price growth expectations remained unchanged for the fifth consecutive month at 3.0%.

Turning to the labor market, the survey found that the average perceived likelihood of voluntary and involuntary job separations increased, while the perceived likelihood of finding a job (in the event of a job loss) declined. "The mean probability of leaving one’s job voluntarily in the next 12 months also increased, by 1.8 percentage points to 19.5%."

Mean unemployment expectations - or the mean probability that the U.S. unemployment rate will be higher one year from now - decreased by 1.1 percentage points to 36.1%, the lowest reading since February 2022. Additionally, the median one-year-ahead expected earnings growth was unchanged at 2.8%, remaining slightly below its 12-month trailing average of 2.9%.

Turning to household finance, we find the following:

  • The median expected growth in household income remained unchanged at 3.1%. The series has been moving within a narrow range of 2.9% to 3.3% since January 2023, and remains above the February 2020 pre-pandemic level of 2.7%.
  • Median household spending growth expectations increased by 0.2 percentage point to 5.2%. The increase was driven by respondents with a high school degree or less.
  • Median year-ahead expected growth in government debt increased to 9.3% from 8.9%.
  • The mean perceived probability that the average interest rate on saving accounts will be higher in 12 months increased by 0.6 percentage point to 26.1%, remaining below its 12-month trailing average of 30%.
  • Perceptions about households’ current financial situations deteriorated somewhat with fewer respondents reporting being better off than a year ago. Year-ahead expectations also deteriorated marginally with a smaller share of respondents expecting to be better off and a slightly larger share of respondents expecting to be worse off a year from now.
  • The mean perceived probability that U.S. stock prices will be higher 12 months from now increased by 1.4 percentage point to 38.9%.
  • At the same time, perceptions and expectations about credit access turned less optimistic: "Perceptions of credit access compared to a year ago deteriorated with a larger share of respondents reporting tighter conditions and a smaller share reporting looser conditions compared to a year ago."

Also, a smaller percentage of consumers, 11.45% vs 12.14% in prior month, expect to not be able to make minimum debt payment over the next three months

Last, and perhaps most humorous, is the now traditional cognitive dissonance one observes with these polls, because at a time when long-term inflation expectations jumped, which clearly suggests that financial conditions will need to be tightened, the number of respondents expecting higher stock prices one year from today jumped to the highest since November 2021... which incidentally is just when the market topped out during the last cycle before suffering a painful bear market.

Tyler Durden Mon, 03/11/2024 - 12:40

Read More

Continue Reading

Uncategorized

Homes listed for sale in early June sell for $7,700 more

New Zillow research suggests the spring home shopping season may see a second wave this summer if mortgage rates fall
The post Homes listed for sale in…

Published

on

  • A Zillow analysis of 2023 home sales finds homes listed in the first two weeks of June sold for 2.3% more. 
  • The best time to list a home for sale is a month later than it was in 2019, likely driven by mortgage rates.
  • The best time to list can be as early as the second half of February in San Francisco, and as late as the first half of July in New York and Philadelphia. 

Spring home sellers looking to maximize their sale price may want to wait it out and list their home for sale in the first half of June. A new Zillow® analysis of 2023 sales found that homes listed in the first two weeks of June sold for 2.3% more, a $7,700 boost on a typical U.S. home.  

The best time to list consistently had been early May in the years leading up to the pandemic. The shift to June suggests mortgage rates are strongly influencing demand on top of the usual seasonality that brings buyers to the market in the spring. This home-shopping season is poised to follow a similar pattern as that in 2023, with the potential for a second wave if the Federal Reserve lowers interest rates midyear or later. 

The 2.3% sale price premium registered last June followed the first spring in more than 15 years with mortgage rates over 6% on a 30-year fixed-rate loan. The high rates put home buyers on the back foot, and as rates continued upward through May, they were still reassessing and less likely to bid boldly. In June, however, rates pulled back a little from 6.79% to 6.67%, which likely presented an opportunity for determined buyers heading into summer. More buyers understood their market position and could afford to transact, boosting competition and sale prices.

The old logic was that sellers could earn a premium by listing in late spring, when search activity hit its peak. Now, with persistently low inventory, mortgage rate fluctuations make their own seasonality. First-time home buyers who are on the edge of qualifying for a home loan may dip in and out of the market, depending on what’s happening with rates. It is almost certain the Federal Reserve will push back any interest-rate cuts to mid-2024 at the earliest. If mortgage rates follow, that could bring another surge of buyers later this year.

Mortgage rates have been impacting affordability and sale prices since they began rising rapidly two years ago. In 2022, sellers nationwide saw the highest sale premium when they listed their home in late March, right before rates barreled past 5% and continued climbing. 

Zillow’s research finds the best time to list can vary widely by metropolitan area. In 2023, it was as early as the second half of February in San Francisco, and as late as the first half of July in New York. Thirty of the top 35 largest metro areas saw for-sale listings command the highest sale prices between May and early July last year. 

Zillow also found a wide range in the sale price premiums associated with homes listed during those peak periods. At the hottest time of the year in San Jose, homes sold for 5.5% more, a $88,000 boost on a typical home. Meanwhile, homes in San Antonio sold for 1.9% more during that same time period.  


Metropolitan Area Best Time to List Price Premium Dollar Boost
United States First half of June 2.3% $7,700
New York, NY First half of July 2.4% $15,500
Los Angeles, CA First half of May 4.1% $39,300
Chicago, IL First half of June 2.8% $8,800
Dallas, TX First half of June 2.5% $9,200
Houston, TX Second half of April 2.0% $6,200
Washington, DC Second half of June 2.2% $12,700
Philadelphia, PA First half of July 2.4% $8,200
Miami, FL First half of June 2.3% $12,900
Atlanta, GA Second half of June 2.3% $8,700
Boston, MA Second half of May 3.5% $23,600
Phoenix, AZ First half of June 3.2% $14,700
San Francisco, CA Second half of February 4.2% $50,300
Riverside, CA First half of May 2.7% $15,600
Detroit, MI First half of July 3.3% $7,900
Seattle, WA First half of June 4.3% $31,500
Minneapolis, MN Second half of May 3.7% $13,400
San Diego, CA Second half of April 3.1% $29,600
Tampa, FL Second half of June 2.1% $8,000
Denver, CO Second half of May 2.9% $16,900
Baltimore, MD First half of July 2.2% $8,200
St. Louis, MO First half of June 2.9% $7,000
Orlando, FL First half of June 2.2% $8,700
Charlotte, NC Second half of May 3.0% $11,000
San Antonio, TX First half of June 1.9% $5,400
Portland, OR Second half of April 2.6% $14,300
Sacramento, CA First half of June 3.2% $17,900
Pittsburgh, PA Second half of June 2.3% $4,700
Cincinnati, OH Second half of April 2.7% $7,500
Austin, TX Second half of May 2.8% $12,600
Las Vegas, NV First half of June 3.4% $14,600
Kansas City, MO Second half of May 2.5% $7,300
Columbus, OH Second half of June 3.3% $10,400
Indianapolis, IN First half of July 3.0% $8,100
Cleveland, OH First half of July  3.4% $7,400
San Jose, CA First half of June 5.5% $88,400


The post Homes listed for sale in early June sell for $7,700 more appeared first on Zillow Research.

Read More

Continue Reading

Trending