Spread & Containment
Kids missing school: Why it’s happening — and how to stop it
About 10 million US children are chronically absent from school.
Share this:


Chronic absenteeism – defined as a student’s missing approximately 18 days of the school year – is on the rise. Compared with the years preceding the COVID-19 pandemic, almost three-quarters of U.S. public schools are now showing significant increases.
SciLine interviewed Dr. Joshua Childs, assistant professor of educational leadership and policy at the University of Texas at Austin, who shared his thoughts on why students become chronically absent, the academic and social losses they incur by missing school, and the strategies available to boost student attendance, including the relationship between absenteeism and school athletics.
Below are some highlights from the discussion. Answers have been edited for brevity and clarity.
What is chronic absenteeism?
Joshua Childs: Chronic absenteeism is missing 10% or more of the school year for any reason. That includes excused absences, like a doctor’s visit or a class field trip, and unexcused absences, such as skipping or being truant from school, and being expelled or suspended from school for behavioral reasons.
How common is chronic absenteeism?
Joshua Childs: On average, around 7.5 million to 8 million students are chronically absent each year. That’s a significant number of students who are missing school for a variety of reasons.
But since the start of the pandemic in March of 2020, the latest national data from the U.S. Department of Education has shown that the number has increased to around 10 million students being identified as chronically absent from school.
How does missing lots of school affect kids?
Joshua Childs: Academically, we know that students who are chronically absent are more likely to drop out and less likely to graduate from high school.
Socially, for students who are chronically absent, they tend to feel less connected to the school and the overall school environment or community, less likely to build connections with the adults or educators within the school building, and also least likely to build connections with their peers.
Developmentally, we know that students who are chronically absent tend to fall behind academically from their peers, and tend to be behind when it comes to math and reading or language arts testing outcomes.
What barriers keep kids out of school?
Joshua Childs: When it comes to physical health, we know that asthma followed by obesity and dental issues are the leading cause for students to miss school. And so not having adequate access to health care to be able to address some of those physical ailments can lead to students’ missing school consistently.
Mental health issues and concerns, particularly or specifically since the pandemic, have increased for students and can lead to their missing school.
Next: the neighborhood context. Are there safe routes, safe transportation, adequate busing options for students to attend school? And attend school not only every day, but on time?
Then there’s the overall school environment. Is it welcoming and engaging for students? Is the school environment physically safe – not only in terms of interactions with peers and the adults, but are there issues with asbestos, or having adequate and reliable desks and textbooks and safe infrastructure within the school building? If not, that can lead to chronic absenteeism rates increasing.
And finally … the family. Do families feel connected and a part of the school environment? Is there constant communication about the importance of attending school and being engaged with the overall school community? Do families understand the value of what the school environment can do for their child, and how consistently showing up can lead to outcomes that are beneficial?
What’s the link between attendance and sports?
Joshua Childs: In many states, coaches have to be full-time employees of the district in which they’re coaching. And so many times coaches are teachers, whether it’s in science, history, math or reading. So they spend significant hours of the school day with students, and also before and after school and weekends over the summer due to the different types of sports that students could be involved in.
One of the most important aspects when it comes to improving student attendance is a connection that students make with adults, particularly those adults engaged with them on a daily basis. And so there’s a role for the coaches to play.
Watch the full interview to hear about how to reduce chronic absenteeism in schools.
SciLine is a free service based at the nonprofit American Association for the Advancement of Science that helps journalists include scientific evidence and experts in their news stories.
Joshua Childs does not work for, consult, own shares in or receive funding from any company or organisation that would benefit from this article, and has disclosed no relevant affiliations beyond their academic appointment.
link pandemic covid-19 testingSpread & Containment
‘I couldn’t stand the pain’: the Turkish holiday resort that’s become an emergency dental centre for Britons who can’t get treated at home
The crisis in NHS dentistry is driving increasing numbers abroad for treatment. Here are some of their stories.
Share this:


It’s a hot summer day in the Turkish city of Antalya, a Mediterranean resort with golden beaches, deep blue sea and vibrant nightlife. The pool area of the all-inclusive resort is crammed with British people on sun loungers – but they aren’t here for a holiday. This hotel is linked to a dental clinic that organises treatment packages, and most of these guests are here to see a dentist.
From Norwich, two women talk about gums and injections. A man from Wales holds a tissue close to his mouth and spits blood – he has just had two molars extracted.
The dental clinic organises everything for these dental “tourists” throughout their treatment, which typically lasts from three to 15 days. The stories I hear of what has caused them to travel to Turkey are strikingly similar: all have struggled to secure dental treatment at home on the NHS.
“The hotel is nice and some days I go to the beach,” says Susan*, a hairdresser in her mid-30s from Norwich. “But really, we aren’t tourists like in a proper holiday. We come here because we have no choice. I couldn’t stand the pain.”

This is Susan’s second visit to Antalya. She explains that her ordeal started two years earlier:
I went to an NHS dentist who told me I had gum disease … She did some cleaning to my teeth and gums but it got worse. When I ate, my teeth were moving … the gums were bleeding and it was very painful. I called to say I was in pain but the clinic was not accepting NHS patients any more.
The only option the dentist offered Susan was to register as a private patient:
I asked how much. They said £50 for x-rays and then if the gum disease got worse, £300 or so for extraction. Four of them were moving – imagine: £1,200 for losing your teeth! Without teeth I’d lose my clients, but I didn’t have the money. I’m a single mum. I called my mum and cried.
Susan’s mother told her about a friend of hers who had been to Turkey for treatment, then together they found a suitable clinic:
The prices are so much cheaper! Tooth extraction, x-rays, consultations – it all comes included. The flight and hotel for seven days cost the same as losing four teeth in Norwich … I had my lower teeth removed here six months ago, now I’ve got implants … £2,800 for everything – hotel, transfer, treatments. I only paid the flights separately.
In the UK, roughly half the adult population suffers from periodontitis – inflammation of the gums caused by plaque bacteria that can lead to irreversible loss of gums, teeth, and bone. Regular reviews by a dentist or hygienist are required to manage this condition. But nine out of ten dental practices cannot offer NHS appointments to new adult patients, while eight in ten are not accepting new child patients.
Some UK dentists argue that Britons who travel abroad for treatment do so mainly for cosmetic procedures. They warn that dental tourism is dangerous, and that if their treatment goes wrong, dentists in the UK will be unable to help because they don’t want to be responsible for further damage. Susan shrugs this off:
Dentists in England say: ‘If you go to Turkey, we won’t touch you [afterwards].’ But I don’t worry because there are no appointments at home anyway. They couldn’t help in the first place, and this is why we are in Turkey.
‘How can we pay all this money?’
As a social anthropologist, I travelled to Turkey a number of times in 2023 to investigate the crisis of NHS dentistry, and the journeys abroad that UK patients are increasingly making as a result. I have relatives in Istanbul and have been researching migration and trading patterns in Turkey’s largest city since 2016.
In August 2023, I visited the resort in Antalya, nearly 400 miles south of Istanbul. As well as Susan, I met a group from a village in Wales who said there was no provision of NHS dentistry back home. They had organised a two-week trip to Turkey: the 12-strong group included a middle-aged couple with two sons in their early 20s, and two couples who were pensioners. By going together, Anya tells me, they could support each other through their different treatments:
I’ve had many cavities since I was little … Before, you could see a dentist regularly – you didn’t even think about it. If you had pain or wanted a regular visit, you phoned and you went … That was in the 1990s, when I went to the dentist maybe every year.
Anya says that once she had children, her family and work commitments meant she had no time to go to the dentist. Then, years later, she started having serious toothache:
Every time I chewed something, it hurt. I ate soups and soft food, and I also lost weight … Even drinking was painful – tea: pain, cold water: pain. I was taking paracetamol all the time! I went to the dentist to fix all this, but there were no appointments.
Anya was told she would have to wait months, or find a dentist elsewhere:
A private clinic gave me a list of things I needed done. Oh my God, almost £6,000. My husband went too – same story. How can we pay all this money? So we decided to come to Turkey. Some people we know had been here, and others in the village wanted to come too. We’ve brought our sons too – they also need to be checked and fixed. Our whole family could be fixed for less than £6,000.
By the time they travelled, Anya’s dental problems had turned into a dental emergency. She says she could not live with the pain anymore, and was relying on paracetamol.
In 2023, about 6 million adults in the UK experienced protracted pain (lasting more than two weeks) caused by toothache. Unintentional paracetamol overdose due to dental pain is a significant cause of admissions to acute medical units. If left untreated, tooth infections can spread to other parts of the body and cause life-threatening complications – and on rare occasions, death.
In February 2024, police were called to manage hundreds of people queuing outside a newly opened dental clinic in Bristol, all hoping to be registered or seen by an NHS dentist. One in ten Britons have admitted to performing “DIY dentistry”, of which 20% did so because they could not find a timely appointment. This includes people pulling out their teeth with pliers and using superglue to repair their teeth.
In the 1990s, dentistry was almost entirely provided through NHS services, with only around 500 solely private dentists registered. Today, NHS dentist numbers in England are at their lowest level in a decade, with 23,577 dentists registered to perform NHS work in 2022-23, down 695 on the previous year. Furthermore, the precise division of NHS and private work that each dentist provides is not measured.
The COVID pandemic created longer waiting lists for NHS treatment in an already stretched public service. In Bridlington, Yorkshire, people are now reportedly having to wait eight-to-nine years to get an NHS dental appointment with the only remaining NHS dentist in the town.
In his book Patients of the State (2012), Argentine sociologist Javier Auyero describes the “indignities of waiting”. It is the poor who are mostly forced to wait, he writes. Queues for state benefits and public services constitute a tangible form of power over the marginalised. There is an ethnic dimension to this story, too. Data suggests that in the UK, patients less likely to be effective in booking an NHS dental appointment are non-white ethnic groups and Gypsy or Irish travellers, and that it is particularly challenging for refugees and asylum-seekers to access dental care.

This article is part of Conversation Insights
The Insights team generates long-form journalism derived from interdisciplinary research. The team is working with academics from different backgrounds who have been engaged in projects aimed at tackling societal and scientific challenges.
In 2022, I experienced my own dental emergency. An infected tooth was causing me debilitating pain, and needed root canal treatment. I was advised this would cost £71 on the NHS, plus £307 for a follow-up crown – but that I would have to wait months for an appointment. The pain became excruciating – I could not sleep, let alone wait for months. In the same clinic, privately, I was quoted £1,300 for the treatment (more than half my monthly income at the time), or £295 for a tooth extraction.
I did not want to lose my tooth because of lack of money. So I bought a flight to Istanbul immediately for the price of the extraction in the UK, and my tooth was treated with root canal therapy by a private dentist there for £80. Including the costs of travelling, the total was a third of what I was quoted to be treated privately in the UK. Two years on, my treated tooth hasn’t given me any more problems.
A better quality of life
Not everyone is in Antalya for emergency procedures. The pensioners from Wales had contacted numerous clinics they found on the internet, comparing prices, treatments and hotel packages at least a year in advance, in a carefully planned trip to get dental implants – artificial replacements for tooth roots that help support dentures, crowns and bridges.

In Turkey, all the dentists I speak to (most of whom cater mainly for foreigners, including UK nationals) consider implants not a cosmetic or luxurious treatment, but a development in dentistry that gives patients who are able to have the procedure a much better quality of life. This procedure is not available on the NHS for most of the UK population, and the patients I meet in Turkey could not afford implants in private clinics back home.
Paul is in Antalya to replace his dentures, which have become uncomfortable and irritating to his gums, with implants. He says he couldn’t find an appointment to see an NHS dentist. His wife Sonia went through a similar procedure the year before and is very satisfied with the results, telling me: “Why have dentures that you need to put in a glass overnight, in the old style? If you can have implants, I say, you’re better off having them.”
Most of the dental tourists I meet in Antalya are white British: this city, known as the Turkish Riviera, has developed an entire economy catering to English-speaking tourists. In 2023, more than 1.3 million people visited the city from the UK, up almost 15% on the previous year.
Read more: NHS dentistry is in crisis – are overseas dentists the answer?
In contrast, the Britons I meet in Istanbul are predominantly from a non-white ethnic background. Omar, a pensioner of Pakistani origin in his early 70s, has come here after waiting “half a year” for an NHS appointment to fix the dental bridge that is causing him pain. Omar’s son had been previously for a hair transplant, and was offered a free dental checkup by the same clinic, so he suggested it to his father. Having worked as a driver for a manufacturing company for two decades in Birmingham, Omar says he feels disappointed to have contributed to the British economy for so long, only to be “let down” by the NHS:
At home, I must wait and wait and wait to get a bridge – and then I had many problems with it. I couldn’t eat because the bridge was uncomfortable and I was in pain, but there were no appointments on the NHS. I asked a private dentist and they recommended implants, but they are far too expensive [in the UK]. I started losing weight, which is not a bad thing at the beginning, but then I was worrying because I couldn’t chew and eat well and was losing more weight … Here in Istanbul, I got dental implants – US$500 each, problem solved! In England, each implant is maybe £2,000 or £3,000.
In the waiting area of another clinic in Istanbul, I meet Mariam, a British woman of Iraqi background in her late 40s, who is making her second visit to the dentist here. Initially, she needed root canal therapy after experiencing severe pain for weeks. Having been quoted £1,200 in a private clinic in outer London, Mariam decided to fly to Istanbul instead, where she was quoted £150 by a dentist she knew through her large family. Even considering the cost of the flight, Mariam says the decision was obvious:
Dentists in England are so expensive and NHS appointments so difficult to find. It’s awful there, isn’t it? Dentists there blamed me for my rotten teeth. They say it’s my fault: I don’t clean or I ate sugar, or this or that. I grew up in a village in Iraq and didn’t go to the dentist – we were very poor. Then we left because of war, so we didn’t go to a dentist … When I arrived in London more than 20 years ago, I didn’t speak English, so I still didn’t go to the dentist … I think when you move from one place to another, you don’t go to the dentist unless you are in real, real pain.
In Istanbul, Mariam has opted not only for the urgent root canal treatment but also a longer and more complex treatment suggested by her consultant, who she says is a renowned doctor from Syria. This will include several extractions and implants of back and front teeth, and when I ask what she thinks of achieving a “Hollywood smile”, Mariam says:
Who doesn’t want a nice smile? I didn’t come here to be a model. I came because I was in pain, but I know this doctor is the best for implants, and my front teeth were rotten anyway.
Dentists in the UK warn about the risks of “overtreatment” abroad, but Mariam appears confident that this is her opportunity to solve all her oral health problems. Two of her sisters have already been through a similar treatment, so they all trust this doctor.

The UK’s ‘dental deserts’
To get a fuller understanding of the NHS dental crisis, I’ve also conducted 20 interviews in the UK with people who have travelled or were considering travelling abroad for dental treatment.
Joan, a 50-year-old woman from Exeter, tells me she considered going to Turkey and could have afforded it, but that her back and knee problems meant she could not brave the trip. She has lost all her lower front teeth due to gum disease and, when I meet her, has been waiting 13 months for an NHS dental appointment. Joan tells me she is living in “shame”, unable to smile.
In the UK, areas with extremely limited provision of NHS dental services – known as as “dental deserts” – include densely populated urban areas such as Portsmouth and Greater Manchester, as well as many rural and coastal areas.
In Felixstowe, the last dentist taking NHS patients went private in 2023, despite the efforts of the activist group Toothless in Suffolk to secure better access to NHS dentists in the area. It’s a similar story in Ripon, Yorkshire, and in Dumfries & Galloway, Scotland, where nearly 25,000 patients have been de-registered from NHS dentists since 2021.
Data shows that 2 million adults must travel at least 40 miles within the UK to access dental care. Branding travel for dental care as “tourism” carries the risk of disguising the elements of duress under which patients move to restore their oral health – nationally and internationally. It also hides the immobility of those who cannot undertake such journeys.
The 90-year-old woman in Dumfries & Galloway who now faces travelling for hours by bus to see an NHS dentist can hardly be considered “tourism” – nor the Ukrainian war refugees who travelled back from West Sussex and Norwich to Ukraine, rather than face the long wait to see an NHS dentist.
Many people I have spoken to cannot afford the cost of transport to attend dental appointments two hours away – or they have care responsibilities that make it impossible. Instead, they are forced to wait in pain, in the hope of one day securing an appointment closer to home.

‘Your crisis is our business’
The indignities of waiting in the UK are having a big impact on the lives of some local and foreign dentists in Turkey. Some neighbourhoods are rapidly changing as dental and other health clinics, usually in luxurious multi-storey glass buildings, mushroom. In the office of one large Istanbul medical complex with sections for hair transplants and dentistry (plus one linked to a hospital for more extensive cosmetic surgery), its Turkish owner and main investor tells me:
Your crisis is our business, but this is a bazaar. There are good clinics and bad clinics, and unfortunately sometimes foreign patients do not know which one to choose. But for us, the business is very good.
This clinic only caters to foreign patients. The owner, an architect by profession who also developed medical clinics in Brazil, describes how COVID had a major impact on his business:
When in Europe you had COVID lockdowns, Turkey allowed foreigners to come. Many people came for ‘medical tourism’ – we had many patients for cosmetic surgery and hair transplants. And that was when the dental business started, because our patients couldn’t see a dentist in Germany or England. Then more and more patients started to come for dental treatments, especially from the UK and Ireland. For them, it’s very, very cheap here.
The reasons include the value of the Turkish lira relative to the British pound, the low cost of labour, the increasing competition among Turkish clinics, and the sheer motivation of dentists here. While most dentists catering to foreign patients are from Turkey, others have arrived seeking refuge from war and violence in Syria, Iraq, Afghanistan, Iran and beyond. They work diligently to rebuild their lives, careers and lost wealth.
Regardless of their origin, all dentists in Turkey must be registered and certified. Hamed, a Syrian dentist and co-owner of a new clinic in Istanbul catering to European and North American patients, tells me:
I know that you say ‘Syrian’ and people think ‘migrant’, ‘refugee’, and maybe think ‘how can this dentist be good?’ – but Syria, before the war, had very good doctors and dentists. Many of us came to Turkey and now I have a Turkish passport. I had to pass the exams to practise dentistry here – I study hard. The exams are in Turkish and they are difficult, so you cannot say that Syrian doctors are stupid.
Hamed talks excitedly about the latest technology that is coming to his profession: “There are always new materials and techniques, and we cannot stop learning.” He is about to travel to Paris to an international conference:
I can say my techniques are very advanced … I bet I put more implants and do more bone grafting and surgeries every week than any dentist you know in England. A good dentist is about practice and hand skills and experience. I work hard, very hard, because more and more patients are arriving to my clinic, because in England they don’t find dentists.

While there is no official data about the number of people travelling from the UK to Turkey for dental treatment, investors and dentists I speak to consider that numbers are rocketing. From all over the world, Turkey received 1.2 million visitors for “medical tourism” in 2022, an increase of 308% on the previous year. Of these, about 250,000 patients went for dentistry. One of the most renowned dental clinics in Istanbul had only 15 British patients in 2019, but that number increased to 2,200 in 2023 and is expected to reach 5,500 in 2024.
Like all forms of medical care, dental treatments carry risks. Most clinics in Turkey offer a ten-year guarantee for treatments and a printed clinical history of procedures carried out, so patients can show this to their local dentists and continue their regular annual care in the UK. Dental treatments, checkups and maintaining a good oral health is a life-time process, not a one-off event.
Many UK patients, however, are caught between a rock and a hard place – criticised for going abroad, yet unable to get affordable dental care in the UK before and after their return. The British Dental Association has called for more action to inform these patients about the risks of getting treated overseas – and has warned UK dentists about the legal implications of treating these patients on their return. But this does not address the difficulties faced by British patients who are being forced to go abroad in search of affordable, often urgent dental care.
A global emergency
The World Health Organization states that the explosion of oral disease around the world is a result of the “negligent attitude” that governments, policymakers and insurance companies have towards including oral healthcare under the umbrella of universal healthcare. It as if the health of our teeth and mouth is optional; somehow less important than treatment to the rest of our body. Yet complications from untreated tooth decay can lead to hospitalisation.
The main causes of oral health diseases are untreated tooth decay, severe gum disease, toothlessness, and cancers of the lip and oral cavity. Cases grew during the pandemic, when little or no attention was paid to oral health. Meanwhile, the global cosmetic dentistry market is predicted to continue growing at an annual rate of 13% for the rest of this decade, confirming the strong relationship between socioeconomic status and access to oral healthcare.
In the UK since 2018, there have been more than 218,000 admissions to hospital for rotting teeth, of which more than 100,000 were children. Some 40% of children in the UK have not seen a dentist in the past 12 months. The role of dentists in prevention of tooth decay and its complications, and in the early detection of mouth cancer, is vital. While there is a 90% survival rate for mouth cancer if spotted early, the lack of access to dental appointments is causing cases to go undetected.
The reasons for the crisis in NHS dentistry are complex, but include: the real-term cuts in funding to NHS dentistry; the challenges of recruitment and retention of dentists in rural and coastal areas; pay inequalities facing dental nurses, most of them women, who are being badly hit by the cost of living crisis; and, in England, the 2006 Dental Contract that does not remunerate dentists in a way that encourages them to continue seeing NHS patients.
The UK is suffering a mass exodus of the public dentistry workforce, with workers leaving the profession entirely or shifting to the private sector, where payments and life-work balance are better, bureaucracy is reduced, and prospects for career development look much better. A survey of general dental practitioners found that around half have reduced their NHS work since the pandemic – with 43% saying they were likely to go fully private, and 42% considering a career change or taking early retirement.
Reversing the UK’s dental crisis requires more commitment to substantial reform and funding than the “recovery plan” announced by Victoria Atkins, the secretary of state for health and social care, on February 7.
The stories I have gathered show that people travelling abroad for dental treatment don’t see themselves as “tourists” or vanity-driven consumers of the “Hollywood smile”. Rather, they have been forced by the crisis in NHS dentistry to seek out a service 1,500 miles away in Turkey that should be a basic, affordable right for all, on their own doorstep.
*Names in this article have been changed to protect the anonymity of the interviewees.

For you: more from our Insights series:
GP crisis: how did things go so wrong, and what needs to change?
Insomnia: how chronic sleep problems can lead to a spiralling decline in mental health
To hear about new Insights articles, join the hundreds of thousands of people who value The Conversation’s evidence-based news. Subscribe to our newsletter.
Diana Ibanez Tirado receives funding from the School of Global Studies, University of Sussex.
pound pandemic treatment therapy spread recovery iran brazil european europe uk germany ukraine world health organizationSpread & Containment
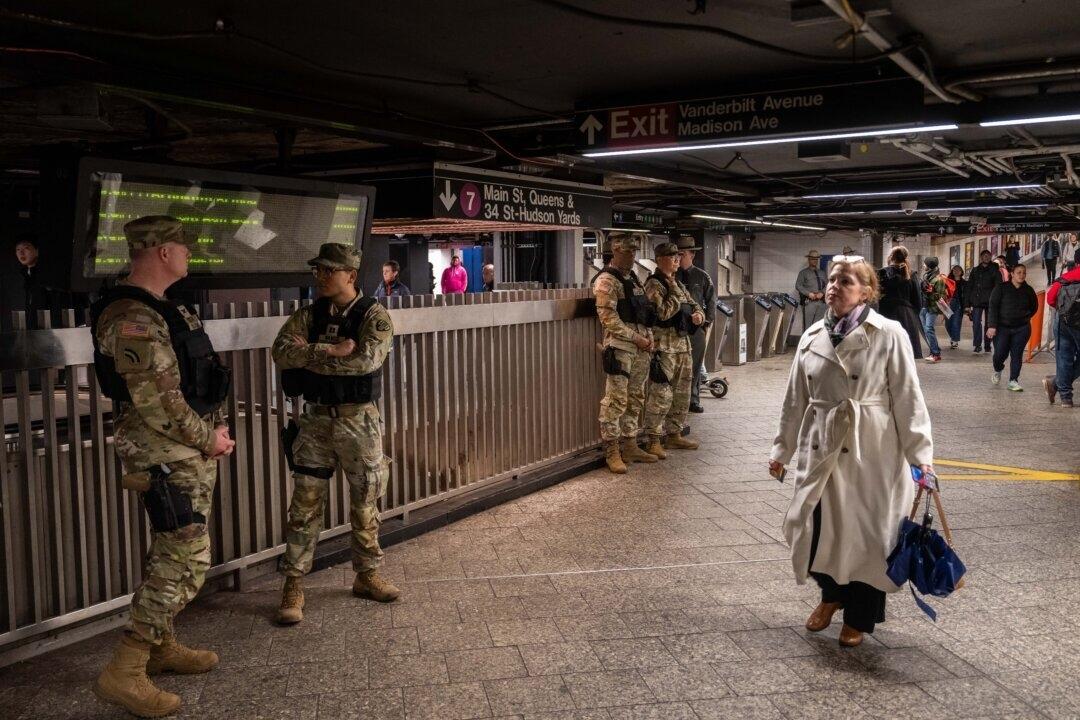
The Coming Of The Police State In America
The Coming Of The Police State In America
Authored by Jeffrey Tucker via The Epoch Times,
The National Guard and the State Police are now…
Share this:


Authored by Jeffrey Tucker via The Epoch Times,
The National Guard and the State Police are now patrolling the New York City subway system in an attempt to do something about the explosion of crime. As part of this, there are bag checks and new surveillance of all passengers. No legislation, no debate, just an edict from the mayor.
Many citizens who rely on this system for transportation might welcome this. It’s a city of strict gun control, and no one knows for sure if they have the right to defend themselves. Merchants have been harassed and even arrested for trying to stop looting and pillaging in their own shops.
The message has been sent: Only the police can do this job. Whether they do it or not is another matter.
Things on the subway system have gotten crazy. If you know it well, you can manage to travel safely, but visitors to the city who take the wrong train at the wrong time are taking grave risks.
In actual fact, it’s guaranteed that this will only end in confiscating knives and other things that people carry in order to protect themselves while leaving the actual criminals even more free to prey on citizens.
The law-abiding will suffer and the criminals will grow more numerous. It will not end well.
When you step back from the details, what we have is the dawning of a genuine police state in the United States. It only starts in New York City. Where is the Guard going to be deployed next? Anywhere is possible.
If the crime is bad enough, citizens will welcome it. It must have been this way in most times and places that when the police state arrives, the people cheer.
We will all have our own stories of how this came to be. Some might begin with the passage of the Patriot Act and the establishment of the Department of Homeland Security in 2001. Some will focus on gun control and the taking away of citizens’ rights to defend themselves.
My own version of events is closer in time. It began four years ago this month with lockdowns. That’s what shattered the capacity of civil society to function in the United States. Everything that has happened since follows like one domino tumbling after another.
It goes like this:
1) lockdown,
2) loss of moral compass and spreading of loneliness and nihilism,
3) rioting resulting from citizen frustration, 4) police absent because of ideological hectoring,
5) a rise in uncontrolled immigration/refugees,
6) an epidemic of ill health from substance abuse and otherwise,
7) businesses flee the city
8) cities fall into decay, and that results in
9) more surveillance and police state.
The 10th stage is the sacking of liberty and civilization itself.
It doesn’t fall out this way at every point in history, but this seems like a solid outline of what happened in this case. Four years is a very short period of time to see all of this unfold. But it is a fact that New York City was more-or-less civilized only four years ago. No one could have predicted that it would come to this so quickly.
But once the lockdowns happened, all bets were off. Here we had a policy that most directly trampled on all freedoms that we had taken for granted. Schools, businesses, and churches were slammed shut, with various levels of enforcement. The entire workforce was divided between essential and nonessential, and there was widespread confusion about who precisely was in charge of designating and enforcing this.
It felt like martial law at the time, as if all normal civilian law had been displaced by something else. That something had to do with public health, but there was clearly more going on, because suddenly our social media posts were censored and we were being asked to do things that made no sense, such as mask up for a virus that evaded mask protection and walk in only one direction in grocery aisles.
Vast amounts of the white-collar workforce stayed home—and their kids, too—until it became too much to bear. The city became a ghost town. Most U.S. cities were the same.
As the months of disaster rolled on, the captives were let out of their houses for the summer in order to protest racism but no other reason. As a way of excusing this, the same public health authorities said that racism was a virus as bad as COVID-19, so therefore it was permitted.
The protests had turned to riots in many cities, and the police were being defunded and discouraged to do anything about the problem. Citizens watched in horror as downtowns burned and drug-crazed freaks took over whole sections of cities. It was like every standard of decency had been zapped out of an entire swath of the population.
Meanwhile, large checks were arriving in people’s bank accounts, defying every normal economic expectation. How could people not be working and get their bank accounts more flush with cash than ever? There was a new law that didn’t even require that people pay rent. How weird was that? Even student loans didn’t need to be paid.
By the fall, recess from lockdown was over and everyone was told to go home again. But this time they had a job to do: They were supposed to vote. Not at the polling places, because going there would only spread germs, or so the media said. When the voting results finally came in, it was the absentee ballots that swung the election in favor of the opposition party that actually wanted more lockdowns and eventually pushed vaccine mandates on the whole population.
The new party in control took note of the large population movements out of cities and states that they controlled. This would have a large effect on voting patterns in the future. But they had a plan. They would open the borders to millions of people in the guise of caring for refugees. These new warm bodies would become voters in time and certainly count on the census when it came time to reapportion political power.
Meanwhile, the native population had begun to swim in ill health from substance abuse, widespread depression, and demoralization, plus vaccine injury. This increased dependency on the very institutions that had caused the problem in the first place: the medical/scientific establishment.
The rise of crime drove the small businesses out of the city. They had barely survived the lockdowns, but they certainly could not survive the crime epidemic. This undermined the tax base of the city and allowed the criminals to take further control.
The same cities became sanctuaries for the waves of migrants sacking the country, and partisan mayors actually used tax dollars to house these invaders in high-end hotels in the name of having compassion for the stranger. Citizens were pushed out to make way for rampaging migrant hordes, as incredible as this seems.
But with that, of course, crime rose ever further, inciting citizen anger and providing a pretext to bring in the police state in the form of the National Guard, now tasked with cracking down on crime in the transportation system.
What’s the next step? It’s probably already here: mass surveillance and censorship, plus ever-expanding police power. This will be accompanied by further population movements, as those with the means to do so flee the city and even the country and leave it for everyone else to suffer.
As I tell the story, all of this seems inevitable. It is not. It could have been stopped at any point. A wise and prudent political leadership could have admitted the error from the beginning and called on the country to rediscover freedom, decency, and the difference between right and wrong. But ego and pride stopped that from happening, and we are left with the consequences.
The government grows ever bigger and civil society ever less capable of managing itself in large urban centers. Disaster is unfolding in real time, mitigated only by a rising stock market and a financial system that has yet to fall apart completely.
Are we at the middle stages of total collapse, or at the point where the population and people in leadership positions wise up and decide to put an end to the downward slide? It’s hard to know. But this much we do know: There is a growing pocket of resistance out there that is fed up and refuses to sit by and watch this great country be sacked and taken over by everything it was set up to prevent.
Spread & Containment
Another beloved brewery files Chapter 11 bankruptcy
The beer industry has been devastated by covid, changing tastes, and maybe fallout from the Bud Light scandal.
Share this:


Before the covid pandemic, craft beer was having a moment. Most cities had multiple breweries and taprooms with some having so many that people put together the brewery version of a pub crawl.
It was a period where beer snobbery ruled the day and it was not uncommon to hear bar patrons discuss the makeup of the beer the beer they were drinking. This boom period always seemed destined for failure, or at least a retraction as many markets seemed to have more craft breweries than they could support.
Related: Fast-food chain closes more stores after Chapter 11 bankruptcy
The pandemic, however, hastened that downfall. Many of these local and regional craft breweries counted on in-person sales to drive their business.
And while many had local and regional distribution, selling through a third party comes with much lower margins. Direct sales drove their business and the pandemic forced many breweries to shut down their taprooms during the period where social distancing rules were in effect.
During those months the breweries still had rent and employees to pay while little money was coming in. That led to a number of popular beermakers including San Francisco's nationally-known Anchor Brewing as well as many regional favorites including Chicago’s Metropolitan Brewing, New Jersey’s Flying Fish, Denver’s Joyride Brewing, Tampa’s Zydeco Brew Werks, and Cleveland’s Terrestrial Brewing filing bankruptcy.
Some of these brands hope to survive, but others, including Anchor Brewing, fell into Chapter 7 liquidation. Now, another domino has fallen as a popular regional brewery has filed for Chapter 11 bankruptcy protection.
Image source: Shutterstock
Covid is not the only reason for brewery bankruptcies
While covid deserves some of the blame for brewery failures, it's not the only reason why so many have filed for bankruptcy protection. Overall beer sales have fallen driven by younger people embracing non-alcoholic cocktails, and the rise in popularity of non-beer alcoholic offerings,
Beer sales have fallen to their lowest levels since 1999 and some industry analysts
"Sales declined by more than 5% in the first nine months of the year, dragged down not only by the backlash and boycotts against Anheuser-Busch-owned Bud Light but the changing habits of younger drinkers," according to data from Beer Marketer’s Insights published by the New York Post.
Bud Light parent Anheuser Busch InBev (BUD) faced massive boycotts after it partnered with transgender social media influencer Dylan Mulvaney. It was a very small partnership but it led to a right-wing backlash spurred on by Kid Rock, who posted a video on social media where he chastised the company before shooting up cases of Bud Light with an automatic weapon.
Another brewery files Chapter 11 bankruptcy
Gizmo Brew Works, which does business under the name Roth Brewing Company LLC, filed for Chapter 11 bankruptcy protection on March 8. In its filing, the company checked the box that indicates that its debts are less than $7.5 million and it chooses to proceed under Subchapter V of Chapter 11.
"Both small business and subchapter V cases are treated differently than a traditional chapter 11 case primarily due to accelerated deadlines and the speed with which the plan is confirmed," USCourts.gov explained.
Roth Brewing/Gizmo Brew Works shared that it has 50-99 creditors and assets $100,000 and $500,000. The filing noted that the company does expect to have funds available for unsecured creditors.
The popular brewery operates three taprooms and sells its beer to go at those locations.
"Join us at Gizmo Brew Works Craft Brewery and Taprooms located in Raleigh, Durham, and Chapel Hill, North Carolina. Find us for entertainment, live music, food trucks, beer specials, and most importantly, great-tasting craft beer by Gizmo Brew Works," the company shared on its website.
The company estimates that it has between $1 and $10 million in liabilities (a broad range as the bankruptcy form does not provide a space to be more specific).
Gizmo Brew Works/Roth Brewing did not share a reorganization or funding plan in its bankruptcy filing. An email request for comment sent through the company's contact page was not immediately returned.
bankruptcy pandemic social distancing


The Coming Of The Police State In America


Another beloved brewery files Chapter 11 bankruptcy


‘I couldn’t stand the pain’: the Turkish holiday resort that’s become an emergency dental centre for Britons who can’t get treated at home
-

 Uncategorized2 weeks ago
All Of The Elements Are In Place For An Economic Crisis Of Staggering Proportions
-

 Uncategorized1 month ago
Cathie Wood sells a major tech stock (again)
-

 Uncategorized3 weeks ago
California Counties Could Be Forced To Pay $300 Million To Cover COVID-Era Program
-

 Uncategorized2 weeks ago
Apparel Retailer Express Moving Toward Bankruptcy
-

 Uncategorized3 weeks ago
Industrial Production Decreased 0.1% in January
-

 International2 days ago
Walmart launches clever answer to Target’s new membership program
-

 International3 days ago
EyePoint poaches medical chief from Apellis; Sandoz CFO, longtime BioNTech exec to retire
-

 Uncategorized3 weeks ago
RFK Jr: The Wuhan Cover-Up & The Rise Of The Biowarfare-Industrial Complex