Uncategorized
Jicama market to grow at a CAGR of 8.05% by 2027; Health benefits of jicama will drive growth – Technavio
Jicama market to grow at a CAGR of 8.05% by 2027; Health benefits of jicama will drive growth – Technavio
PR Newswire
NEW YORK, Feb. 17, 2023
NEW YORK, Feb. 17, 2023 /PRNewswire/ — Jicama market insights –
…
Share this:

Jicama market to grow at a CAGR of 8.05% by 2027; Health benefits of jicama will drive growth - Technavio
PR Newswire
NEW YORK, Feb. 17, 2023
NEW YORK, Feb. 17, 2023 /PRNewswire/ -- Jicama market insights -
- Vendors: 15+, Including Asia Seeds, Asian Veggies Inc., Eurofrutta Ltd., Fine Food Specialist Ltd., Friedas Inc., GOODBYNATURE Pvt. Ltd., Green Harvest Organic Gardening Supplies, John Vena Inc., Kitazawa Seed Co., Koerner Agro Export Center Co. Ltd., La Huerta Imports, Local Seeds, Specialty Produce, Succeed Heirlooms, The Seed Collection Pty Ltd., Valli Produce Inc., Vega produce LLC, VOLCANO KIMCHI, Whitwam Organics LLC, Wiffens, Zenxin Agri Organic Food Pte Ltd., among others
- Coverage: Parent market analysis; key drivers, major trends, and challenges; customer and vendor landscape; vendor product insights and recent developments; key vendors; and market positioning of vendors
- Segments: Product (Conventional and Organic), Distribution Channel (Offline and Online), and Geography (North America, APAC, Europe, South America, and Middle East and Africa)
To understand more about the jicama market, request a sample report
The jicama market report provides critical information and factual data, with a qualitative and quantitative study of the market based on market drivers and limitations as well as future prospects.
Why buy?
- Add credibility to strategy
- Analyzes competitor's offerings
- Get a holistic view of the market
Grow your profit margin with Technavio- Buy the Report
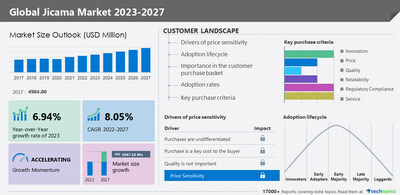
In 2017, the jicama market was valued at USD 4,984 million. From a regional perspective, North America held the largest market share, valued at USD 1,782.28 million. The jicama market size is estimated to grow by USD 3,067.18 million from 2022 to 2027 at a CAGR of 8.05% according to Technavio.
Jicama market - Customer landscape
To help companies evaluate and develop growth strategies, the report outlines –
- Key purchase criteria
- Adoption rates
- Adoption lifecycle
- Drivers of price sensitivity
- For highlights on customer landscape analysis, download a sample!
Jicama market - Vendor insights
The growing competition in the market is compelling vendors to adopt various growth strategies such as promotional activities and spending on advertisements to improve the visibility of their services. Technavio report analyzes the market's competitive landscape and offers information on several market vendors including –
- Fine Food Specialist Ltd. - The company's key offerings include Jicama roots under its unified segment. This segment also focuses on offering wagyu beef, caviar, specialist seafood, artisan cheese, truffles, edible flowers, micro-herbs, exotic fruits, and vegetables.
- Friedas Inc. - The company offers jicama under its brand Friedas. It also focuses on providing fruits and vegetables such as pears, mushrooms, ginger root, cabbage, coconut, lychees, lemongrass, pepper and potatoes.
- John Vena Inc. - The company's key offerings include jicama namely Mexican potato. Under its unified segment, the company also focuses on producing and distributing fruits, vegetables, herbs.
- Kitazawa Seed Co. - The company offers jicama such as Thai jicama seeds. The company also provides more than 500 varieties of Asian seeds to its diverse range of customers.
Jicama market – Market dynamics
Major drivers –
- Health benefits of jicama
- Increasing production of jicama
- Increasing global vegan population
Key challenges –
- Fluctuating price of jicama
- Effect of natural calamities
- Distribution challenges
What are the key data covered in this jicama market report?
- CAGR of the market during the forecast period
- Detailed information on factors that will drive the growth of the jicama market between 2023 and 2027
- Precise estimation of the jicama market size and its contribution to the market in focus on the parent market
- Accurate predictions about upcoming trends and changes in consumer behavior
- Growth of the jicama industry across North America, APAC, Europe, South America, and Middle East and Africa
- A thorough analysis of the market's competitive landscape and detailed information about vendors
- Comprehensive analysis of factors that will challenge the growth of jicama market vendors
Gain instant access to 17,000+ market research reports.
Technavio's SUBSCRIPTION platform
Related Reports:
The durian fruit market is estimated to grow at a CAGR of 8.12% between 2022 and 2027. The size of the market is forecast to increase by USD 9,891.81 million. This report extensively covers market segmentation by product (frozen pulp and paste and whole fruit), distribution channel (offline and online), and geography (APAC, North America, Europe, Middle East and Africa, and South America).
The organic fresh food market share is expected to increase to USD 88.35 billion from 2021 to 2026, and the market's growth momentum will accelerate at a CAGR of 15.29%. Furthermore, this report extensively covers organic fresh food market segmentation by product (fruits and vegetables and meat) and geography (North America, Europe, APAC, Middle East and Africa, and South America).
Jicama Market Scope | |
Report Coverage | Details |
Page number | 149 |
Base year | 2022 |
Historic period | 2017-2021 |
Forecast period | 2023-2027 |
Growth momentum & CAGR | Accelerate at a CAGR of 8.05% |
Market growth 2023-2027 | USD 3067.18 million |
Market structure | Fragmented |
YoY growth 2022-2023 (%) | 6.94 |
Regional analysis | North America, APAC, Europe, South America, and Middle East and Africa |
Performing market contribution | North America at 38% |
Key countries | US, Japan, Germany, France, and UK |
Competitive landscape | Leading Vendors, Market Positioning of Vendors, Competitive Strategies, and Industry Risks |
Key companies profiled | Asia Seeds, Asian Veggies Inc., Eurofrutta Ltd., Fine Food Specialist Ltd., Friedas Inc., GOODBYNATURE Pvt. Ltd., Green Harvest Organic Gardening Supplies, John Vena Inc., Kitazawa Seed Co., Koerner Agro Export Center Co. Ltd., La Huerta Imports, Local Seeds, Specialty Produce, Succeed Heirlooms, The Seed Collection Pty Ltd., Valli Produce Inc., Vega produce LLC, VOLCANO KIMCHI, Whitwam Organics LLC, Wiffens, and Zenxin Agri Organic Food Pte Ltd. |
Market dynamics | Parent market analysis, Market growth inducers and obstacles, Fast-growing and slow-growing segment analysis, COVID-19 impact and recovery analysis and future consumer dynamics, and Market condition analysis for the forecast period. |
Customization purview | If our report has not included the data that you are looking for, you can reach out to our analysts and get segments customized. |
Table of Contents:
1 Executive Summary
- 1.1 Market Overview
- Exhibit 01: Executive Summary – Chart on Market Overview
- Exhibit 02: Executive Summary – Data Table on Market Overview
- Exhibit 03: Executive Summary – Chart on Global Market Characteristics
- Exhibit 04: Executive Summary – Chart on Market by Geography
- Exhibit 05: Executive Summary – Chart on Market Segmentation by Product
- Exhibit 06: Executive Summary – Chart on Market Segmentation by Distribution Channel
- Exhibit 07: Executive Summary – Chart on Incremental Growth
- Exhibit 08: Executive Summary – Data Table on Incremental Growth
- Exhibit 09: Executive Summary – Chart on Vendor Market Positioning
2 Market Landscape
- 2.1 Market ecosystem
- Exhibit 10: Parent market
- Exhibit 11: Market Characteristics
3 Market Sizing
- 3.1 Market Definition
- Exhibit 12: Offerings of vendors included in the market definition
- 3.2 Market segment analysis
- Exhibit 13: Market segments
- 3.3 Market size 2022
- 3.4 Market outlook: Forecast for 2022-2027
- Exhibit 14: Chart on Global - Market size and forecast 2022-2027 ($ million)
- Exhibit 15: Data Table on Global - Market size and forecast 2022-2027 ($ million)
- Exhibit 16: Chart on Global Market: Year-over-year growth 2022-2027 (%)
- Exhibit 17: Data Table on Global Market: Year-over-year growth 2022-2027 (%)
4 Historic Market Size
- 4.1 Global jicama market 2017 - 2021
- Exhibit 18: Historic Market Size – Data Table on Global jicama market 2017 - 2021 ($ million)
- 4.2 Product Segment Analysis 2017 - 2021
- Exhibit 19: Historic Market Size – Product Segment 2017 - 2021 ($ million)
- 4.3 Distribution Channel Segment Analysis 2017 - 2021
- Exhibit 20: Historic Market Size – Distribution Channel Segment 2017 - 2021 ($ million)
- 4.4 Geography Segment Analysis 2017 - 2021
- Exhibit 21: Historic Market Size – Geography Segment 2017 - 2021 ($ million)
- 4.5 Country Segment Analysis 2017 - 2021
- Exhibit 22: Historic Market Size – Country Segment 2017 - 2021 ($ million)
5 Five Forces Analysis
- 5.1 Five forces summary
- Exhibit 23: Five forces analysis - Comparison between 2022 and 2027
- 5.2 Bargaining power of buyers
- Exhibit 24: Chart on Bargaining power of buyers – Impact of key factors 2022 and 2027
- 5.3 Bargaining power of suppliers
- Exhibit 25: Bargaining power of suppliers – Impact of key factors in 2022 and 2027
- 5.4 Threat of new entrants
- Exhibit 26: Threat of new entrants – Impact of key factors in 2022 and 2027
- 5.5 Threat of substitutes
- Exhibit 27: Threat of substitutes – Impact of key factors in 2022 and 2027
- 5.6 Threat of rivalry
- Exhibit 28: Threat of rivalry – Impact of key factors in 2022 and 2027
- 5.7 Market condition
- Exhibit 29: Chart on Market condition - Five forces 2022 and 2027
6 Market Segmentation by Product
- 6.1 Market segments
- Exhibit 30: Chart on Product - Market share 2022-2027 (%)
- Exhibit 31: Data Table on Product - Market share 2022-2027 (%)
- 6.2 Comparison by Product
- Exhibit 32: Chart on Comparison by Product
- Exhibit 33: Data Table on Comparison by Product
- 6.3 Conventional - Market size and forecast 2022-2027
- Exhibit 34: Chart on Conventional - Market size and forecast 2022-2027 ($ million)
- Exhibit 35: Data Table on Conventional - Market size and forecast 2022-2027 ($ million)
- Exhibit 36: Chart on Conventional - Year-over-year growth 2022-2027 (%)
- Exhibit 37: Data Table on Conventional - Year-over-year growth 2022-2027 (%)
- 6.4 Organic - Market size and forecast 2022-2027
- Exhibit 38: Chart on Organic - Market size and forecast 2022-2027 ($ million)
- Exhibit 39: Data Table on Organic - Market size and forecast 2022-2027 ($ million)
- Exhibit 40: Chart on Organic - Year-over-year growth 2022-2027 (%)
- Exhibit 41: Data Table on Organic - Year-over-year growth 2022-2027 (%)
- 6.5 Market opportunity by Product
- Exhibit 42: Market opportunity by Product ($ million)
7 Market Segmentation by Distribution Channel
- 7.1 Market segments
- Exhibit 43: Chart on Distribution Channel - Market share 2022-2027 (%)
- Exhibit 44: Data Table on Distribution Channel - Market share 2022-2027 (%)
- 7.2 Comparison by Distribution Channel
- Exhibit 45: Chart on Comparison by Distribution Channel
- Exhibit 46: Data Table on Comparison by Distribution Channel
- 7.3 Offline - Market size and forecast 2022-2027
- Exhibit 47: Chart on Offline - Market size and forecast 2022-2027 ($ million)
- Exhibit 48: Data Table on Offline - Market size and forecast 2022-2027 ($ million)
- Exhibit 49: Chart on Offline - Year-over-year growth 2022-2027 (%)
- Exhibit 50: Data Table on Offline - Year-over-year growth 2022-2027 (%)
- 7.4 Online - Market size and forecast 2022-2027
- Exhibit 51: Chart on Online - Market size and forecast 2022-2027 ($ million)
- Exhibit 52: Data Table on Online - Market size and forecast 2022-2027 ($ million)
- Exhibit 53: Chart on Online - Year-over-year growth 2022-2027 (%)
- Exhibit 54: Data Table on Online - Year-over-year growth 2022-2027 (%)
- 7.5 Market opportunity by Distribution Channel
- Exhibit 55: Market opportunity by Distribution Channel ($ million)
8 Customer Landscape
- 8.1 Customer landscape overview
- Exhibit 56: Analysis of price sensitivity, lifecycle, customer purchase basket, adoption rates, and purchase criteria
9 Geographic Landscape
- 9.1 Geographic segmentation
- Exhibit 57: Chart on Market share by geography 2022-2027 (%)
- Exhibit 58: Data Table on Market share by geography 2022-2027 (%)
- 9.2 Geographic comparison
- Exhibit 59: Chart on Geographic comparison
- Exhibit 60: Data Table on Geographic comparison
- 9.3 North America - Market size and forecast 2022-2027
- Exhibit 61: Chart on North America - Market size and forecast 2022-2027 ($ million)
- Exhibit 62: Data Table on North America - Market size and forecast 2022-2027 ($ million)
- Exhibit 63: Chart on North America - Year-over-year growth 2022-2027 (%)
- Exhibit 64: Data Table on North America - Year-over-year growth 2022-2027 (%)
- 9.4 APAC - Market size and forecast 2022-2027
- Exhibit 65: Chart on APAC - Market size and forecast 2022-2027 ($ million)
- Exhibit 66: Data Table on APAC - Market size and forecast 2022-2027 ($ million)
- Exhibit 67: Chart on APAC - Year-over-year growth 2022-2027 (%)
- Exhibit 68: Data Table on APAC - Year-over-year growth 2022-2027 (%)
- 9.5 Europe - Market size and forecast 2022-2027
- Exhibit 69: Chart on Europe - Market size and forecast 2022-2027 ($ million)
- Exhibit 70: Data Table on Europe - Market size and forecast 2022-2027 ($ million)
- Exhibit 71: Chart on Europe - Year-over-year growth 2022-2027 (%)
- Exhibit 72: Data Table on Europe - Year-over-year growth 2022-2027 (%)
- 9.6 South America - Market size and forecast 2022-2027
- Exhibit 73: Chart on South America - Market size and forecast 2022-2027 ($ million)
- Exhibit 74: Data Table on South America - Market size and forecast 2022-2027 ($ million)
- Exhibit 75: Chart on South America - Year-over-year growth 2022-2027 (%)
- Exhibit 76: Data Table on South America - Year-over-year growth 2022-2027 (%)
- 9.7 Middle East and Africa - Market size and forecast 2022-2027
- Exhibit 77: Chart on Middle East and Africa - Market size and forecast 2022-2027 ($ million)
- Exhibit 78: Data Table on Middle East and Africa - Market size and forecast 2022-2027 ($ million)
- Exhibit 79: Chart on Middle East and Africa - Year-over-year growth 2022-2027 (%)
- Exhibit 80: Data Table on Middle East and Africa - Year-over-year growth 2022-2027 (%)
- 9.8 US - Market size and forecast 2022-2027
- Exhibit 81: Chart on US - Market size and forecast 2022-2027 ($ million)
- Exhibit 82: Data Table on US - Market size and forecast 2022-2027 ($ million)
- Exhibit 83: Chart on US - Year-over-year growth 2022-2027 (%)
- Exhibit 84: Data Table on US - Year-over-year growth 2022-2027 (%)
- 9.9 Japan - Market size and forecast 2022-2027
- Exhibit 85: Chart on Japan - Market size and forecast 2022-2027 ($ million)
- Exhibit 86: Data Table on Japan - Market size and forecast 2022-2027 ($ million)
- Exhibit 87: Chart on Japan - Year-over-year growth 2022-2027 (%)
- Exhibit 88: Data Table on Japan - Year-over-year growth 2022-2027 (%)
- 9.10 Germany - Market size and forecast 2022-2027
- Exhibit 89: Chart on Germany - Market size and forecast 2022-2027 ($ million)
- Exhibit 90: Data Table on Germany - Market size and forecast 2022-2027 ($ million)
- Exhibit 91: Chart on Germany - Year-over-year growth 2022-2027 (%)
- Exhibit 92: Data Table on Germany - Year-over-year growth 2022-2027 (%)
- 9.11 France - Market size and forecast 2022-2027
- Exhibit 93: Chart on France - Market size and forecast 2022-2027 ($ million)
- Exhibit 94: Data Table on France - Market size and forecast 2022-2027 ($ million)
- Exhibit 95: Chart on France - Year-over-year growth 2022-2027 (%)
- Exhibit 96: Data Table on France - Year-over-year growth 2022-2027 (%)
- 9.12 UK - Market size and forecast 2022-2027
- Exhibit 97: Chart on UK - Market size and forecast 2022-2027 ($ million)
- Exhibit 98: Data Table on UK - Market size and forecast 2022-2027 ($ million)
- Exhibit 99: Chart on UK - Year-over-year growth 2022-2027 (%)
- Exhibit 100: Data Table on UK - Year-over-year growth 2022-2027 (%)
- 9.13 Market opportunity by geography
- Exhibit 101: Market opportunity by geography ($ million)
10 Drivers, Challenges, and Trends
- 10.1 Market drivers
- 10.2 Market challenges
- 10.3 Impact of drivers and challenges
- Exhibit 102: Impact of drivers and challenges in 2022 and 2027
- 10.4 Market trends
11 Vendor Landscape
- 11.1 Overview
- 11.2 Vendor landscape
- Exhibit 103: Overview on Criticality of inputs and Factors of differentiation
- 11.3 Landscape disruption
- Exhibit 104: Overview on factors of disruption
- 11.4 Industry risks
- Exhibit 105: Impact of key risks on business
12 Vendor Analysis
- 12.1 Vendors covered
- Exhibit 106: Vendors covered
- 12.2 Market positioning of vendors
- Exhibit 107: Matrix on vendor position and classification
- 12.3 Asia Seeds
- Exhibit 108: Asia Seeds - Overview
- Exhibit 109: Asia Seeds - Product / Service
- Exhibit 110: Asia Seeds - Key offerings
- 12.4 Eurofrutta Ltd.
- Exhibit 111: Eurofrutta Ltd. - Overview
- Exhibit 112: Eurofrutta Ltd. - Product / Service
- Exhibit 113: Eurofrutta Ltd. - Key offerings
- 12.5 Fine Food Specialist Ltd.
- Exhibit 114: Fine Food Specialist Ltd. - Overview
- Exhibit 115: Fine Food Specialist Ltd. - Product / Service
- Exhibit 116: Fine Food Specialist Ltd. - Key offerings
- 12.6 Friedas Inc.
- Exhibit 117: Friedas Inc. - Overview
- Exhibit 118: Friedas Inc. - Product / Service
- Exhibit 119: Friedas Inc. - Key offerings
- 12.7 John Vena Inc.
- Exhibit 120: John Vena Inc. - Overview
- Exhibit 121: John Vena Inc. - Product / Service
- Exhibit 122: John Vena Inc. - Key offerings
- 12.8 Kitazawa Seed Co.
- Exhibit 123: Kitazawa Seed Co. - Overview
- Exhibit 124: Kitazawa Seed Co. - Product / Service
- Exhibit 125: Kitazawa Seed Co. - Key offerings
- 12.9 Koerner Agro Export Center Co. Ltd.
- Exhibit 126: Koerner Agro Export Center Co. Ltd. - Overview
- Exhibit 127: Koerner Agro Export Center Co. Ltd. - Product / Service
- Exhibit 128: Koerner Agro Export Center Co. Ltd. - Key offerings
- 12.10 La Huerta Imports
- Exhibit 129: La Huerta Imports - Overview
- Exhibit 130: La Huerta Imports - Product / Service
- Exhibit 131: La Huerta Imports - Key offerings
- 12.11 Local Seeds
- Exhibit 132: Local Seeds - Overview
- Exhibit 133: Local Seeds - Product / Service
- Exhibit 134: Local Seeds - Key offerings
- 12.12 Specialty Produce
- Exhibit 135: Specialty Produce - Overview
- Exhibit 136: Specialty Produce - Product / Service
- Exhibit 137: Specialty Produce - Key offerings
- 12.13 Succeed Heirlooms
- Exhibit 138: Succeed Heirlooms - Overview
- Exhibit 139: Succeed Heirlooms - Product / Service
- Exhibit 140: Succeed Heirlooms - Key offerings
- 12.14 Vega produce LLC
- Exhibit 141: Vega produce LLC - Overview
- Exhibit 142: Vega produce LLC - Product / Service
- Exhibit 143: Vega produce LLC - Key offerings
- 12.15 VOLCANO KIMCHI
- Exhibit 144: VOLCANO KIMCHI - Overview
- Exhibit 145: VOLCANO KIMCHI - Product / Service
- Exhibit 146: VOLCANO KIMCHI - Key offerings
- 12.16 Whitwam Organics LLC
- Exhibit 147: Whitwam Organics LLC - Overview
- Exhibit 148: Whitwam Organics LLC - Product / Service
- Exhibit 149: Whitwam Organics LLC - Key offerings
- 12.17 Zenxin Agri Organic Food Pte Ltd.
- Exhibit 150: Zenxin Agri Organic Food Pte Ltd. - Overview
- Exhibit 151: Zenxin Agri Organic Food Pte Ltd. - Product / Service
- Exhibit 152: Zenxin Agri Organic Food Pte Ltd. - Key offerings
13 Appendix
- 13.1 Scope of the report
- 13.2 Inclusions and exclusions checklist
- Exhibit 153: Inclusions checklist
- Exhibit 154: Exclusions checklist
- 13.3 Currency conversion rates for US$
- Exhibit 155: Currency conversion rates for US$
- 13.4 Research methodology
- Exhibit 156: Research methodology
- Exhibit 157: Validation techniques employed for market sizing
- Exhibit 158: Information sources
- 13.5 List of abbreviations
- Exhibit 159: List of abbreviations
Technavio is a leading global technology research and advisory company. Their research and analysis focus on emerging market trends and provide actionable insights to help businesses identify market opportunities and develop effective strategies to optimize their market positions. With over 500 specialized analysts, Technavio's report library consists of more than 17,000 reports and counting, covering 800 technologies, spanning 50 countries. Their client base consists of enterprises of all sizes, including more than 100 Fortune 500 companies. This growing client base relies on Technavio's comprehensive coverage, extensive research, and actionable market insights to identify opportunities in existing and potential markets and assess their competitive positions within changing market scenarios.
Contact
Technavio Research
Jesse Maida
Media & Marketing Executive
US: +1 844 364 1100
UK: +44 203 893 3200
Email: media@technavio.com
Website: www.technavio.com/

View original content to download multimedia:https://www.prnewswire.com/news-releases/jicama-market-to-grow-at-a-cagr-of-8-05-by-2027-health-benefits-of-jicama-will-drive-growth---technavio-301748574.html
SOURCE Technavio
Uncategorized
Part 1: Current State of the Housing Market; Overview for mid-March 2024
Today, in the Calculated Risk Real Estate Newsletter: Part 1: Current State of the Housing Market; Overview for mid-March 2024
A brief excerpt: This 2-part overview for mid-March provides a snapshot of the current housing market.
I always like to star…
Share this:

A brief excerpt:
This 2-part overview for mid-March provides a snapshot of the current housing market.There is much more in the article.
I always like to start with inventory, since inventory usually tells the tale!
...
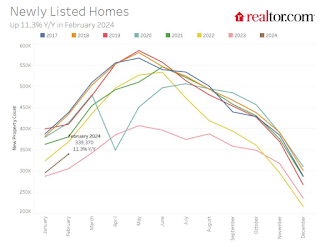
Here is a graph of new listing from Realtor.com’s February 2024 Monthly Housing Market Trends Report showing new listings were up 11.3% year-over-year in February. This is still well below pre-pandemic levels. From Realtor.com:
However, providing a boost to overall inventory, sellers turned out in higher numbers this February as newly listed homes were 11.3% above last year’s levels. This marked the fourth month of increasing listing activity after a 17-month streak of decline.Note the seasonality for new listings. December and January are seasonally the weakest months of the year for new listings, followed by February and November. New listings will be up year-over-year in 2024, but we will have to wait for the March and April data to see how close new listings are to normal levels.
There are always people that need to sell due to the so-called 3 D’s: Death, Divorce, and Disease. Also, in certain times, some homeowners will need to sell due to unemployment or excessive debt (neither is much of an issue right now).
And there are homeowners who want to sell for a number of reasons: upsizing (more babies), downsizing, moving for a new job, or moving to a nicer home or location (move-up buyers). It is some of the “want to sell” group that has been locked in with the golden handcuffs over the last couple of years, since it is financially difficult to move when your current mortgage rate is around 3%, and your new mortgage rate will be in the 6 1/2% to 7% range.
But time is a factor for this “want to sell” group, and eventually some of them will take the plunge. That is probably why we are seeing more new listings now.
Uncategorized
Pharma industry reputation remains steady at a ‘new normal’ after Covid, Harris Poll finds
The pharma industry is hanging on to reputation gains notched during the Covid-19 pandemic. Positive perception of the pharma industry is steady at 45%…
Share this:


The pharma industry is hanging on to reputation gains notched during the Covid-19 pandemic. Positive perception of the pharma industry is steady at 45% of US respondents in 2023, according to the latest Harris Poll data. That’s exactly the same as the previous year.
Pharma’s highest point was in February 2021 — as Covid vaccines began to roll out — with a 62% positive US perception, and helping the industry land at an average 55% positive sentiment at the end of the year in Harris’ 2021 annual assessment of industries. The pharma industry’s reputation hit its most recent low at 32% in 2019, but it had hovered around 30% for more than a decade prior.
“Pharma has sustained a lot of the gains, now basically one and half times higher than pre-Covid,” said Harris Poll managing director Rob Jekielek. “There is a question mark around how sustained it will be, but right now it feels like a new normal.”
The Harris survey spans 11 global markets and covers 13 industries. Pharma perception is even better abroad, with an average 58% of respondents notching favorable sentiments in 2023, just a slight slip from 60% in each of the two previous years.
Pharma’s solid global reputation puts it in the middle of the pack among international industries, ranking higher than government at 37% positive, insurance at 48%, financial services at 51% and health insurance at 52%. Pharma ranks just behind automotive (62%), manufacturing (63%) and consumer products (63%), although it lags behind leading industries like tech at 75% positive in the first spot, followed by grocery at 67%.
The bright spotlight on the pharma industry during Covid vaccine and drug development boosted its reputation, but Jekielek said there’s maybe an argument to be made that pharma is continuing to develop innovative drugs outside that spotlight.
“When you look at pharma reputation during Covid, you have clear sense of a very dynamic industry working very quickly and getting therapies and products to market. If you’re looking at things happening now, you could argue that pharma still probably doesn’t get enough credit for its advances, for example, in oncology treatments,” he said.
vaccine pandemic covid-19Uncategorized
Q4 Update: Delinquencies, Foreclosures and REO
Today, in the Calculated Risk Real Estate Newsletter: Q4 Update: Delinquencies, Foreclosures and REO
A brief excerpt: I’ve argued repeatedly that we would NOT see a surge in foreclosures that would significantly impact house prices (as happened followi…
Share this:


A brief excerpt:
I’ve argued repeatedly that we would NOT see a surge in foreclosures that would significantly impact house prices (as happened following the housing bubble). The two key reasons are mortgage lending has been solid, and most homeowners have substantial equity in their homes..There is much more in the article. You can subscribe at https://calculatedrisk.substack.com/ mortgage rates real estate mortgages pandemic interest rates
...
And on mortgage rates, here is some data from the FHFA’s National Mortgage Database showing the distribution of interest rates on closed-end, fixed-rate 1-4 family mortgages outstanding at the end of each quarter since Q1 2013 through Q3 2023 (Q4 2023 data will be released in a two weeks).
This shows the surge in the percent of loans under 3%, and also under 4%, starting in early 2020 as mortgage rates declined sharply during the pandemic. Currently 22.6% of loans are under 3%, 59.4% are under 4%, and 78.7% are under 5%.
With substantial equity, and low mortgage rates (mostly at a fixed rates), few homeowners will have financial difficulties.


Q4 Update: Delinquencies, Foreclosures and REO


Pharma industry reputation remains steady at a ‘new normal’ after Covid, Harris Poll finds


Part 1: Current State of the Housing Market; Overview for mid-March 2024


Digital Currency And Gold As Speculative Warnings


Bougie Broke The Financial Reality Behind The Facade


‘Bougie Broke’ – The Financial Reality Behind The Facade


Bitcoin on Wheels: The Story of Bitcoinetas


Futures Flat At All-Time High As Bitcoin Surges To Record, Oil Rises


The most potent labor market indicator of all is still strongly positive
-

 Uncategorized3 weeks ago
All Of The Elements Are In Place For An Economic Crisis Of Staggering Proportions
-

 International5 days ago
EyePoint poaches medical chief from Apellis; Sandoz CFO, longtime BioNTech exec to retire
-

 Uncategorized4 weeks ago
California Counties Could Be Forced To Pay $300 Million To Cover COVID-Era Program
-

 Uncategorized3 weeks ago
Apparel Retailer Express Moving Toward Bankruptcy
-

 Uncategorized4 weeks ago
Industrial Production Decreased 0.1% in January
-

 International5 days ago
Walmart launches clever answer to Target’s new membership program
-

 Uncategorized4 weeks ago
RFK Jr: The Wuhan Cover-Up & The Rise Of The Biowarfare-Industrial Complex
-

 Uncategorized3 weeks ago
GOP Efforts To Shore Up Election Security In Swing States Face Challenges