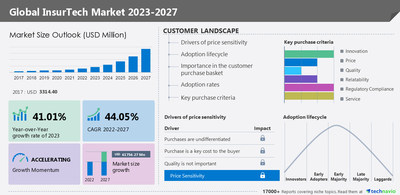
NEW YORK, Nov. 23, 2022 /PRNewswire/ -- According to Technavio, the global InsurTech market size is projected to grow by USD 61756.27 million from 2022 to 2027. The market is estimated to grow at a CAGR of 44.05% during the forecast period. Europe held the largest share of the global market in 2022, and the market in the region is estimated to witness an incremental growth of 50%.
Discover some insights on market size before buying full report, request a free sample report!
Global InsurTech Market - Parent Market Analysis
Technavio categorizes the global InsurTech market as a part of the systems software market, which covers companies engaged in developing and producing application and system software. The parent market also includes companies offering database management software and organizations that are engaged in developing application development and management software, cloud computing software, data center and hosting software, IT management software, mobility software, networking software, security software, and storage software.
Find insights on parent market & value chain analysis, download an exclusive sample!
Global InsurTech Market - Five Forces
The global InsurTech market is fragmented, and the five forces analysis covers –
- Bargaining Power of Buyers
- Threat of New Entrants
- Threat of Rivalry
- Bargaining Power of Suppliers
- Threat of Substitutes
- Interpretation of porter five model helps to strategize the business, for entire details - buy report!
Global InsurTech Market – Customer Landscape
The report includes the market's adoption lifecycle, from the innovator's stage to the laggard's stage. It focuses on adoption rates in different regions based on penetration. Furthermore, the report also includes key purchase criteria and drivers of price sensitivity to help companies evaluate and develop their growth strategies.
Global InsurTech Market - Segmentation Assessment
Segment Overview
Technavio has segmented the market based on management, deployment, and region.
- The marketing and distribution segment will grow at the highest rate during the forecast period. The increasing acceptance of mobile point-of-sales in the e-retail business is helping insurance companies in finding significant opportunities to address a large number of customers to suit their requirements and behavior. InsurTech solutions provide insurance companies with a wide range of technologies, such as chatbots, to interact live with customers, resolve their queries, and achieve customer-centricity. Thus, the rising need to achieve customer-centricity and high return on investment is significantly helping in the growth of the marketing and distribution segment.
Geography Overview
By geography, the global InsurTech market is segmented into North America, Europe, APAC, the Middle East and Africa, and South America. The report provides actionable insights and estimates the contribution of all regions to the growth of the global InsurTech market.
- Europe held 50% of the global InsurTech market in 2022. The market in the region is estimated to grow at the fastest pace during the forecast period. The region is home to some of the most advanced economies in the world. Insurance companies in Europe are increasingly adopting analytics and telematics to create customized insurance products for customers. In addition, the higher concentration of key vendors in the region is driving the growth of the InsurTech market in Europe.
Download a FREE Sample Report
Global InsurTech Market – Market Dynamics
Key factor driving market growth
- The need to improve business efficiency is one of the key factors driving the growth of the InsurTech market. As consumers across the world become more digitally aware, the demand for better and easier access to insurance technology services is increasing.
- Insurance companies are sensing the opportunities to change their business models. They are focusing on leveraging innovative technologies to optimize costs, deliver better services, and boost revenues.
- To implement the latest technologies in the insurance framework, there is a high need for establishing a seamless connection for efficient communication among systems, machines, and people. This is driving the demand for InsurTech solutions, which is driving the growth of the market in focus.
Recent trends influencing the market
- The collaboration of investors with InsurTech firms is identified as one of the major trends in the market. There has been an increased interest among investors to collaborate with InsurTech firms or technology-first insurance start-ups.
- In addition, the trend of purchasing insurance over an application is increasing worldwide. The importance of InsurTech is increasing at a rapid pace among insurance companies.
- Over the next decade, the entire insurance process is expected to become digital and will not require the involvement of any form of physical interference. Realizing the growth potential, many investors are collaborating with InsurTech firms. For instance, in October 2022, Moody's Analytics and Cytora, entered into a partnership to provide the commercial insurance industry a streamlined and informed understanding of risk.
- All these factors will have a positive influence on the growth of the global InsurTech market during the forecast period.
Major challenges hindering market growth
- The high cost of investments is expected to hinder the growth of the InsurTech market. Leveraging technologies to sell insurance products require a considerable amount of training.
- Retraining is also required to understand the insurance products in-depth for the insurance staff to be able to offer products that match the needs of customers. This requires significant investments in hiring trainers.
- Many insurance companies lack the technical expertise and have budget constraints that make them reluctant in investing in InsurTech solutions. Many such challenges will reduce the growth potential in the global InsurTech market during the forecast period.
Driver, Trend & Challenges are the factor of market dynamics which states about consequences & sustainability of the businesses, find some insights from a free sample report!
What are the key data covered in this InsurTech market report?
- CAGR of the market during the forecast period
- Detailed information on factors that will drive the growth of the InsurTech market between 2023 and 2027
- Precise estimation of the size of the InsurTech market and its contribution to the parent market
- Accurate predictions about upcoming trends and changes in consumer behavior
- Growth of the InsurTech market industry across APAC, North America, Europe, Middle East and Africa, and South America
- Thorough analysis of the market's competitive landscape and detailed information about vendors
- Comprehensive analysis of factors that will challenge the growth of InsurTech market vendors
Gain instant access to 17,000+ market research reports.
Technavio's SUBSCRIPTION platform
Related Reports:
- The claims processing software market share is expected to increase by USD 24.39 billion from 2021 to 2026, and the market's growth momentum will accelerate at a CAGR of 8.71%. The market is segmented by component (software and services) and geography (North America, Europe, APAC, South America, and the Middle East and Africa).
- The insurtech market share in the UK is expected to increase by USD 4.20 billion from 2021 to 2026, and the market's growth momentum will accelerate at a CAGR of 43.74%. The market is segmented by deployment (on-premises and cloud) and value chain positioning (marketing and distribution, IT support, policy administration and management, claim management, and others).
InsurTech Market Scope
|
Report Coverage
| Details
|
Page number
| 162
|
Base year
| 2022
|
Historical year
| 2017-2021
|
Forecast period
| 2023-2027
|
Growth momentum & CAGR
| Accelerate at a CAGR of 44.05%
|
Market growth 2023-2027
| USD 61756.27 million
|
Market structure
| Fragmented
|
YoY growth (%)
| 41.01
|
Regional analysis
| North America, Europe, APAC, the Middle East and Africa, and South America
|
Performing market contribution
| Europe at 50%
|
Key consumer countries
| US, Japan, China, UK, and France
|
Competitive landscape
| Leading companies, Competitive Strategies, Consumer engagement scope
|
Key companies profiled
| Acko General Insurance Ltd., Alan SA, Anywhere 2 go Co. Ltd., Clover Health, Cytora Ltd., Damco Group, DXC Technology Co., Friendsurance, Haven Life Insurance Agency LLC, iCarbonX, Insurance Technology Services, Jetty National Inc., Kin Insurance Technology Hub LLC, Milvik AB, Oscar Insurance Corp., Quantemplate Technologies Inc., Shift Technology, simplesurance GmbH, Slice Insurance Technologies Inc., and ZhongAn Online Property Insurance Co. Ltd.
|
Market dynamics
| Parent market analysis, Market growth inducers and obstacles, Fast-growing and slow-growing segment analysis, COVID-19 impact and recovery analysis and future consumer dynamics, and Market condition analysis for the forecast period.
|
Customization purview
| If our report has not included the data that you are looking for, you can reach out to our analysts and get segments customized.
|
Table of Contents:
1 Executive Summary
- 1.1 Market overview
- Exhibit 01: Executive Summary – Chart on Market Overview
- Exhibit 02: Executive Summary – Data Table on Market Overview
- Exhibit 03: Executive Summary – Chart on Global Market Characteristics
- Exhibit 04: Executive Summary – Chart on Market by Geography
- Exhibit 05: Executive Summary – Chart on Market Segmentation by Management
- Exhibit 06: Executive Summary – Chart on Market Segmentation by Deployment
- Exhibit 07: Executive Summary – Chart on Incremental Growth
- Exhibit 08: Executive Summary – Data Table on Incremental Growth
- Exhibit 09: Executive Summary – Chart on Vendor Market Positioning
2 Market Landscape
- 2.1 Market ecosystem
- Exhibit 10: Parent market
- Exhibit 11: Market Characteristics
3 Market Sizing
- 3.1 Market definition
- Exhibit 12: Offerings of vendors included in the market definition
- 3.2 Market segment analysis
- Exhibit 13: Market segments
- 3.4 Market outlook: Forecast for 2022-2027
- Exhibit 14: Chart on Global - Market size and forecast 2022-2027 ($ million)
- Exhibit 15: Data Table on Global - Market size and forecast 2022-2027 ($ million)
- Exhibit 16: Chart on Global Market: Year-over-year growth 2022-2027 (%)
- Exhibit 17: Data Table on Global Market: Year-over-year growth 2022-2027 (%)
4 Historic Market Size
- 4.1 Global insurtech market 2017 - 2021
- Exhibit 18: Historic Market Size – Data Table on Global insurtech market 2017 - 2021 ($ million)
- 4.2 Management Segment Analysis 2017 - 2021
- Exhibit 19: Historic Market Size – Management Segment 2017 - 2021 ($ million)
- 4.3 Deployment Segment Analysis 2017 - 2021
- Exhibit 20: Historic Market Size – Deployment Segment 2017 - 2021 ($ million)
- 4.4 Geography Segment Analysis 2017 - 2021
- Exhibit 21: Historic Market Size – Geography Segment 2017 - 2021 ($ million)
- 4.5 Country Segment Analysis 2017 - 2021
- Exhibit 22: Historic Market Size – Country Segment 2017 - 2021 ($ million)
5 Five Forces Analysis
- 5.1 Five forces summary
- Exhibit 23: Five forces analysis - Comparison between2022 and 2027
- 5.2 Bargaining power of buyers
- Exhibit 24: Chart on Bargaining power of buyers – Impact of key factors 2022 and 2027
- 5.3 Bargaining power of suppliers
- Exhibit 25: Bargaining power of suppliers – Impact of key factors in 2022 and 2027
- 5.4 Threat of new entrants
- Exhibit 26: Threat of new entrants – Impact of key factors in 2022 and 2027
- 5.5 Threat of substitutes
- Exhibit 27: Threat of substitutes – Impact of key factors in 2022 and 2027
- 5.6 Threat of rivalry
- Exhibit 28: Threat of rivalry – Impact of key factors in 2022 and 2027
- 5.7 Market condition
- Exhibit 29: Chart on Market condition - Five forces 2022 and 2027
6 Market Segmentation by Management
- 6.1 Market segments
- Exhibit 30: Chart on Management - Market share 2022-2027 (%)
- Exhibit 31: Data Table on Management - Market share 2022-2027 (%)
- 6.2 Comparison by Management
- Exhibit 32: Chart on Comparison by Management
- Exhibit 33: Data Table on Comparison by Management
- 6.3 Marketing and distribution - Market size and forecast 2022-2027
- Exhibit 34: Chart on Marketing and distribution - Market size and forecast 2022-2027 ($ million)
- Exhibit 35: Data Table on Marketing and distribution - Market size and forecast 2022-2027 ($ million)
- Exhibit 36: Chart on Marketing and distribution - Year-over-year growth 2022-2027 (%)
- Exhibit 37: Data Table on Marketing and distribution - Year-over-year growth 2022-2027 (%)
- 6.4 IT support - Market size and forecast 2022-2027
- Exhibit 38: Chart on IT support - Market size and forecast 2022-2027 ($ million)
- Exhibit 39: Data Table on IT support - Market size and forecast 2022-2027 ($ million)
- Exhibit 40: Chart on IT support - Year-over-year growth 2022-2027 (%)
- Exhibit 41: Data Table on IT support - Year-over-year growth 2022-2027 (%)
- 6.5 Policy administration and management - Market size and forecast 2022-2027
- Exhibit 42: Chart on Policy administration and management - Market size and forecast 2022-2027 ($ million)
- Exhibit 43: Data Table on Policy administration and management - Market size and forecast 2022-2027 ($ million)
- Exhibit 44: Chart on Policy administration and management - Year-over-year growth 2022-2027 (%)
- Exhibit 45: Data Table on Policy administration and management - Year-over-year growth 2022-2027 (%)
- 6.6 Claim management - Market size and forecast 2022-2027
- Exhibit 46: Chart on Claim management - Market size and forecast 2022-2027 ($ million)
- Exhibit 47: Data Table on Claim management - Market size and forecast 2022-2027 ($ million)
- Exhibit 48: Chart on Claim management - Year-over-year growth 2022-2027 (%)
- Exhibit 49: Data Table on Claim management - Year-over-year growth 2022-2027 (%)
- 6.7 Others - Market size and forecast 2022-2027
- Exhibit 50: Chart on Others - Market size and forecast 2022-2027 ($ million)
- Exhibit 51: Data Table on Others - Market size and forecast 2022-2027 ($ million)
- Exhibit 52: Chart on Others - Year-over-year growth 2022-2027 (%)
- Exhibit 53: Data Table on Others - Year-over-year growth 2022-2027 (%)
- 6.8 Market opportunity by Management
- Exhibit 54: Market opportunity by Management ($ million)
7 Market Segmentation by Deployment
- 7.1 Market segments
- Exhibit 55: Chart on Deployment - Market share 2022-2027 (%)
- Exhibit 56: Data Table on Deployment - Market share 2022-2027 (%)
- 7.2 Comparison by Deployment
- Exhibit 57: Chart on Comparison by Deployment
- Exhibit 58: Data Table on Comparison by Deployment
- 7.3 On-premise - Market size and forecast 2022-2027
- Exhibit 59: Chart on On-premise - Market size and forecast 2022-2027 ($ million)
- Exhibit 60: Data Table on On-premise - Market size and forecast 2022-2027 ($ million)
- Exhibit 61: Chart on On-premise - Year-over-year growth 2022-2027 (%)
- Exhibit 62: Data Table on On-premise - Year-over-year growth 2022-2027 (%)
- 7.4 Cloud - Market size and forecast 2022-2027
- Exhibit 63: Chart on Cloud - Market size and forecast 2022-2027 ($ million)
- Exhibit 64: Data Table on Cloud - Market size and forecast 2022-2027 ($ million)
- Exhibit 65: Chart on Cloud - Year-over-year growth 2022-2027 (%)
- Exhibit 66: Data Table on Cloud - Year-over-year growth 2022-2027 (%)
- 7.5 Market opportunity by Deployment
- Exhibit 67: Market opportunity by Deployment ($ million)
8 Customer Landscape
- 8.1 Customer landscape overview
- Exhibit 68: Analysis of price sensitivity, lifecycle, customer purchase basket, adoption rates, and purchase criteria
9 Geographic Landscape
- 9.1 Geographic segmentation
- Exhibit 69: Chart on Market share by geography 2022-2027 (%)
- Exhibit 70: Data Table on Market share by geography 2022-2027 (%)
- 9.2 Geographic comparison
- Exhibit 71: Chart on Geographic comparison
- Exhibit 72: Data Table on Geographic comparison
- 9.3 North America - Market size and forecast 2022-2027
- Exhibit 73: Chart on North America - Market size and forecast 2022-2027 ($ million)
- Exhibit 74: Data Table on North America - Market size and forecast 2022-2027 ($ million)
- Exhibit 75: Chart on North America - Year-over-year growth 2022-2027 (%)
- Exhibit 76: Data Table on North America - Year-over-year growth 2022-2027 (%)
- 9.4 Europe - Market size and forecast 2022-2027
- Exhibit 77: Chart on Europe - Market size and forecast 2022-2027 ($ million)
- Exhibit 78: Data Table on Europe - Market size and forecast 2022-2027 ($ million)
- Exhibit 79: Chart on Europe - Year-over-year growth 2022-2027 (%)
- Exhibit 80: Data Table on Europe - Year-over-year growth 2022-2027 (%)
- 9.5 APAC - Market size and forecast 2022-2027
- Exhibit 81: Chart on APAC - Market size and forecast 2022-2027 ($ million)
- Exhibit 82: Data Table on APAC - Market size and forecast 2022-2027 ($ million)
- Exhibit 83: Chart on APAC - Year-over-year growth 2022-2027 (%)
- Exhibit 84: Data Table on APAC - Year-over-year growth 2022-2027 (%)
- 9.6 Middle East and Africa - Market size and forecast 2022-2027
- Exhibit 85: Chart on Middle East and Africa - Market size and forecast 2022-2027 ($ million)
- Exhibit 86: Data Table on Middle East and Africa - Market size and forecast 2022-2027 ($ million)
- Exhibit 87: Chart on Middle East and Africa - Year-over-year growth 2022-2027 (%)
- Exhibit 88: Data Table on Middle East and Africa - Year-over-year growth 2022-2027 (%)
- 9.7 South America - Market size and forecast 2022-2027
- Exhibit 89: Chart on South America - Market size and forecast 2022-2027 ($ million)
- Exhibit 90: Data Table on South America - Market size and forecast 2022-2027 ($ million)
- Exhibit 91: Chart on South America - Year-over-year growth 2022-2027 (%)
- Exhibit 92: Data Table on South America - Year-over-year growth 2022-2027 (%)
- 9.8 US - Market size and forecast 2022-2027
- Exhibit 93: Chart on US - Market size and forecast 2022-2027 ($ million)
- Exhibit 94: Data Table on US - Market size and forecast 2022-2027 ($ million)
- Exhibit 95: Chart on US - Year-over-year growth 2022-2027 (%)
- Exhibit 96: Data Table on US - Year-over-year growth 2022-2027 (%)
- 9.9 UK - Market size and forecast 2022-2027
- Exhibit 97: Chart on UK - Market size and forecast 2022-2027 ($ million)
- Exhibit 98: Data Table on UK - Market size and forecast 2022-2027 ($ million)
- Exhibit 99: Chart on UK - Year-over-year growth 2022-2027 (%)
- Exhibit 100: Data Table on UK - Year-over-year growth 2022-2027 (%)
- 9.10 France - Market size and forecast 2022-2027
- Exhibit 101: Chart on France - Market size and forecast 2022-2027 ($ million)
- Exhibit 102: Data Table on France - Market size and forecast 2022-2027 ($ million)
- Exhibit 103: Chart on France - Year-over-year growth 2022-2027 (%)
- Exhibit 104: Data Table on France - Year-over-year growth 2022-2027 (%)
- 9.11 Japan - Market size and forecast 2022-2027
- Exhibit 105: Chart on Japan - Market size and forecast 2022-2027 ($ million)
- Exhibit 106: Data Table on Japan - Market size and forecast 2022-2027 ($ million)
- Exhibit 107: Chart on Japan - Year-over-year growth 2022-2027 (%)
- Exhibit 108: Data Table on Japan - Year-over-year growth 2022-2027 (%)
- 9.12 China - Market size and forecast 2022-2027
- Exhibit 109: Chart on China - Market size and forecast 2022-2027 ($ million)
- Exhibit 110: Data Table on China - Market size and forecast 2022-2027 ($ million)
- Exhibit 111: Chart on China - Year-over-year growth 2022-2027 (%)
- Exhibit 112: Data Table on China - Year-over-year growth 2022-2027 (%)
- 9.13 Market opportunity by geography
- Exhibit 113: Market opportunity by geography ($ million)
10 Drivers, Challenges, and Trends
- 10.3 Impact of drivers and challenges
- Exhibit 114: Impact of drivers and challenges in 2022 and 2027
11 Vendor Landscape
- 11.2 Vendor landscape
- Exhibit 115: Overview on Criticality of inputs and Factors of differentiation
- 11.3 Landscape disruption
- Exhibit 116: Overview on factors of disruption
- 11.4 Industry risks
- Exhibit 117: Impact of key risks on business
12 Vendor Analysis
- 12.1 Vendors covered
- Exhibit 118: Vendors covered
- 12.2 Market positioning of vendors
- Exhibit 119: Matrix on vendor position and classification
- 12.3 Acko General Insurance Ltd.
- Exhibit 120: Acko General Insurance Ltd. - Overview
- Exhibit 121: Acko General Insurance Ltd. - Product / Service
- Exhibit 122: Acko General Insurance Ltd. - Key offerings
- 12.4 Alan SA
- Exhibit 123: Alan SA - Overview
- Exhibit 124: Alan SA - Product / Service
- Exhibit 125: Alan SA - Key offerings
- 12.5 Anywhere 2 go Co. Ltd.
- Exhibit 126: Anywhere 2 go Co. Ltd. - Overview
- Exhibit 127: Anywhere 2 go Co. Ltd. - Product / Service
- Exhibit 128: Anywhere 2 go Co. Ltd. - Key offerings
- 12.6 Clover Health
- Exhibit 129: Clover Health - Overview
- Exhibit 130: Clover Health - Product / Service
- Exhibit 131: Clover Health - Key offerings
- 12.7 Cytora Ltd.
- Exhibit 132: Cytora Ltd. - Overview
- Exhibit 133: Cytora Ltd. - Product / Service
- Exhibit 134: Cytora Ltd. - Key offerings
- 12.8 Friendsurance
- Exhibit 135: Friendsurance - Overview
- Exhibit 136: Friendsurance - Product / Service
- Exhibit 137: Friendsurance - Key offerings
- 12.9 Haven Life Insurance Agency LLC
- Exhibit 138: Haven Life Insurance Agency LLC - Overview
- Exhibit 139: Haven Life Insurance Agency LLC - Product / Service
- Exhibit 140: Haven Life Insurance Agency LLC - Key offerings
- 12.10 iCarbonX
- Exhibit 141: iCarbonX - Overview
- Exhibit 142: iCarbonX - Product / Service
- Exhibit 143: iCarbonX - Key offerings
- 12.11 Jetty National Inc.
- Exhibit 144: Jetty National Inc. - Overview
- Exhibit 145: Jetty National Inc. - Product / Service
- Exhibit 146: Jetty National Inc. - Key offerings
- 12.12 Kin Insurance Technology Hub LLC
- Exhibit 147: Kin Insurance Technology Hub LLC - Overview
- Exhibit 148: Kin Insurance Technology Hub LLC - Product / Service
- Exhibit 149: Kin Insurance Technology Hub LLC - Key offerings
- 12.13 Oscar Insurance Corp.
- Exhibit 150: Oscar Insurance Corp. - Overview
- Exhibit 151: Oscar Insurance Corp. - Product / Service
- Exhibit 152: Oscar Insurance Corp. - Key offerings
- 12.14 Quantemplate Technologies Inc.
- Exhibit 153: Quantemplate Technologies Inc. - Overview
- Exhibit 154: Quantemplate Technologies Inc. - Product / Service
- Exhibit 155: Quantemplate Technologies Inc. - Key offerings
- 12.15 Shift Technology
- Exhibit 156: Shift Technology - Overview
- Exhibit 157: Shift Technology - Product / Service
- Exhibit 158: Shift Technology - Key offerings
- 12.16 simplesurance GmbH
- Exhibit 159: simplesurance GmbH - Overview
- Exhibit 160: simplesurance GmbH - Product / Service
- Exhibit 161: simplesurance GmbH - Key offerings
- 12.17 ZhongAn Online Property Insurance Co. Ltd.
- Exhibit 162: ZhongAn Online Property Insurance Co. Ltd. - Overview
- Exhibit 163: ZhongAn Online Property Insurance Co. Ltd. - Business segments
- Exhibit 164: ZhongAn Online Property Insurance Co. Ltd. - Key offerings
- Exhibit 165: ZhongAn Online Property Insurance Co. Ltd. - Segment focus
13 Appendix
- 13.2 Inclusions and exclusions checklist
- Exhibit 166: Inclusions checklist
- Exhibit 167: Exclusions checklist
- 13.3 Currency conversion rates for US$
- Exhibit 168: Currency conversion rates for US$
- 13.4 Research methodology
- Exhibit 169: Research methodology
- Exhibit 170: Validation techniques employed for market sizing
- Exhibit 171: Information sources
- 13.5 List of abbreviations
- Exhibit 172: List of abbreviations
About Us
Technavio is a leading global technology research and advisory company. Their research and analysis focus on emerging market trends and provide actionable insights to help businesses identify market opportunities and develop effective strategies to optimize their market positions. With over 500 specialized analysts, Technavio's report library consists of more than 17,000 reports and counting, covering 800 technologies, spanning 50 countries. Their client base consists of enterprises of all sizes, including more than 100 Fortune 500 companies. This growing client base relies on Technavio's comprehensive coverage, extensive research, and actionable market insights to identify opportunities in existing and potential markets and assess their competitive positions within changing market scenarios.
Contact
Technavio Research
Jesse Maida
Media & Marketing Executive
US: +1 844 364 1100
UK: +44 203 893 3200
Email: media@technavio.com
Website: www.technavio.com/
View original content to download multimedia:https://www.prnewswire.com/news-releases/insurtech-market-2023-2027-a-descriptive-analysis-of-parent-market-five-forces-model-market-dynamics--segmentation---technavio-301685935.html
SOURCE Technavio


