Uncategorized
Information services market size to increase by USD 68.41 billion: APAC to contribute 39% of market growth – Technavio
Information services market size to increase by USD 68.41 billion: APAC to contribute 39% of market growth – Technavio
PR Newswire
NEW YORK, Dec. 6, 2022
NEW YORK, Dec. 6, 2022 /PRNewswire/ — The Information Services Market by Type, End-user, and …
Share this:

Information services market size to increase by USD 68.41 billion: APAC to contribute 39% of market growth - Technavio
PR Newswire
NEW YORK, Dec. 6, 2022
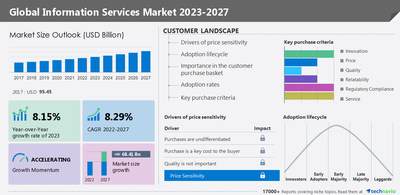
NEW YORK, Dec. 6, 2022 /PRNewswire/ -- The Information Services Market by Type, End-user, and Geography - Forecast and Analysis 2023-2027 report has been published by Technavio. Market size is forecast to grow by USD 68.41 billion at a CAGR of 8.29% between 2022 and 2027. The report provides a comprehensive analysis of growth opportunities at regional levels, new product launches, the latest trends, and the post-pandemic recovery of the global market. Download A PDF Sample Report
By region, the global information services market is segmented into APAC, North America, Europe, South America, and the Middle East and Africa. APAC is estimated to contribute 39% to the growth of the global market over the forecast period. Increasing consumption of mobile-based information services is driving the growth of the regional market.
The information services market report includes information on the key products and recent developments of leading vendors, including:
- Agence France Presse: The company offers Information Services through texts, pictures, videos, interactive graphics, and videographics.
- AGS Corp.: The company offers Information Services such as systems consulting, outsourcing, financial industry, public sector, and enterprises in general.
- Australian Associated Press Ltd.: The company offers Information Services through fact-based news and information by publishing articles and pictures.
- Bloomberg L.P: The company offers Information Services through news, articles, data, and analytics.
- Clarivate PLC
- Cuyahoga County Public Library
- FUJIFILM Holdings Corp.
- To gain access to more vendor profiles available with Technavio, buy the report!
The market is driven by the use of information services for risk management, the provision of customer-centric solutions, and automation in gathering information. However, the threat of data misappropriation, theft, and cybersecurity is hindering market growth.
The competitive scenario categorizes companies based on various performance indicators. Some of the factors considered include the financial performance of companies over the past few years, growth strategies, product innovations, new product launches, investments, and growth in market share among others. Request a Sample
- By type, the market is segmented into news syndicates, libraries, and archives. The news syndicates segment accounted for the largest share of the market in 2022.
- By geography, the market is segmented into APAC, North America, Europe, South America, and Middle East and Africa. APAC held the largest share of the market in 2022.
- The big data services market is estimated to grow at a CAGR of 35.68% between 2022 and 2027. The size of the market is forecast to increase by USD 153.75 billion. The growing amount of data is notably driving the market growth, although factors such as adhering to diverse client requirements may impede the market growth.
- The business process outsourcing market is estimated to grow at a CAGR of 6.5% between 2022 and 2027. The size of the market is forecast to increase by USD 75.89 billion. The increasing adoption of BPO by IT and telecom service providers is notably driving the market growth, although factors such as language barriers and goodwill risk may impede the market growth.
Technavio's library includes over 17,000+ reports, covering more than 2,000 emerging technologies. Subscribe to our "Basic Plan" at just USD 5,000 and get lifetime access to Technavio Insights
- CAGR of the market during the forecast period.
- Detailed information on factors that will drive the growth of the market between 2023 and 2027
- Precise estimation of the size of the information services market and its contribution to the parent market.
- Accurate predictions about upcoming trends and changes in consumer behavior.
- Growth of the market industry across APAC, North America, Europe, South America, and Middle East and Africa.
- Thorough analysis of the market's competitive landscape and detailed information about vendors.
- Comprehensive analysis of factors that will challenge the growth of information services market vendors.
Information Services Market Scope | |
Report Coverage | Details |
Page number | 165 |
Base year | 2022 |
Historic period | 2017-2021 |
Forecast period | 2023-2027 |
Growth momentum & CAGR | Accelerate at a CAGR of 8.29% |
Market growth 2023-2027 | USD 68.41 billion |
Market structure | Fragmented |
YoY growth 2022-2023 (%) | 8.15 |
Regional analysis | APAC, North America, Europe, South America, and Middle East and Africa |
Performing market contribution | APAC at 39% |
Key countries | US, China, Japan, UK, and Germany |
Competitive landscape | Leading Vendors, Market Positioning of Vendors, Competitive Strategies, and Industry Risks |
Key companies profiled | Agence France Presse, AGS Corp., Australian Associated Press Ltd., Bloomberg L.P, Clarivate PLC, Cuyahoga County Public Library, FUJIFILM Holdings Corp., GISP Group, King County Library System, News Corp., Nexstar, Queens Public Library, RELX Plc, S and P Global Inc., The New York Public Library, The New York Times Co., Thomson Reuters Corp., United Press International Inc., and Wolters Kluwer NV |
Market dynamics | Parent market analysis, market growth inducers and obstacles, fast-growing and slow-growing segment analysis, COVID-19 impact and recovery analysis and future consumer dynamics, and market condition analysis for the forecast period |
Customization purview | If our report has not included the data that you are looking for, you can reach out to our analysts and get segments customized. |
1 Executive Summary
- 1.1 Market overview
- Exhibit 01: Executive Summary – Chart on Market Overview
- Exhibit 02: Executive Summary – Data Table on Market Overview
- Exhibit 03: Executive Summary – Chart on Global Market Characteristics
- Exhibit 04: Executive Summary – Chart on Market by Geography
- Exhibit 05: Executive Summary – Chart on Market Segmentation by Type
- Exhibit 06: Executive Summary – Chart on Market Segmentation by End-user
- Exhibit 07: Executive Summary – Chart on Incremental Growth
- Exhibit 08: Executive Summary – Data Table on Incremental Growth
- Exhibit 09: Executive Summary – Chart on Vendor Market Positioning
2 Market Landscape
- 2.1 Market ecosystem
- Exhibit 10: Parent market
- Exhibit 11: Market Characteristics
3 Market Sizing
- 3.1 Market definition
- Exhibit 12: Offerings of vendors included in the market definition
- 3.2 Market segment analysis
- Exhibit 13: Market segments
- 3.3 Market size 2022
- 3.4 Market outlook: Forecast for 2022-2027
- Exhibit 14: Chart on Global - Market size and forecast 2022-2027 ($ billion)
- Exhibit 15: Data Table on Global - Market size and forecast 2022-2027 ($ billion)
- Exhibit 16: Chart on Global Market: Year-over-year growth 2022-2027 (%)
- Exhibit 17: Data Table on Global Market: Year-over-year growth 2022-2027 (%)
4 Historic Market Size
- 4.1 Global information services market 2017 - 2021
- Exhibit 18: Historic Market Size – Data Table on Global information services market 2017 - 2021 ($ billion)
- 4.2 Type Segment Analysis 2017 - 2021
- Exhibit 19: Historic Market Size – Type Segment 2017 - 2021 ($ billion)
- 4.3 End-user Segment Analysis 2017 - 2021
- Exhibit 20: Historic Market Size – End-user Segment 2017 - 2021 ($ billion)
- 4.4 Geography Segment Analysis 2017 - 2021
- Exhibit 21: Historic Market Size – Geography Segment 2017 - 2021 ($ billion)
- 4.5 Country Segment Analysis 2017 - 2021
- Exhibit 22: Historic Market Size – Country Segment 2017 - 2021 ($ billion)
5 Five Forces Analysis
- 5.1 Five forces summary
- Exhibit 23: Five forces analysis - Comparison between2022 and 2027
- 5.2 Bargaining power of buyers
- Exhibit 24: Chart on Bargaining power of buyers – Impact of key factors 2022 and 2027
- 5.3 Bargaining power of suppliers
- Exhibit 25: Bargaining power of suppliers – Impact of key factors in 2022 and 2027
- 5.4 Threat of new entrants
- Exhibit 26: Threat of new entrants – Impact of key factors in 2022 and 2027
- 5.5 Threat of substitutes
- Exhibit 27: Threat of substitutes – Impact of key factors in 2022 and 2027
- 5.6 Threat of rivalry
- Exhibit 28: Threat of rivalry – Impact of key factors in 2022 and 2027
- 5.7 Market condition
- Exhibit 29: Chart on Market condition - Five forces 2022 and 2027
6 Market Segmentation by Type
- 6.1 Market segments
- Exhibit 30: Chart on Type - Market share 2022-2027 (%)
- Exhibit 31: Data Table on Type - Market share 2022-2027 (%)
- 6.2 Comparison by Type
- Exhibit 32: Chart on Comparison by Type
- Exhibit 33: Data Table on Comparison by Type
- 6.3 News syndicates - Market size and forecast 2022-2027
- Exhibit 34: Chart on News syndicates - Market size and forecast 2022-2027 ($ billion)
- Exhibit 35: Data Table on News syndicates - Market size and forecast 2022-2027 ($ billion)
- Exhibit 36: Chart on News syndicates - Year-over-year growth 2022-2027 (%)
- Exhibit 37: Data Table on News syndicates - Year-over-year growth 2022-2027 (%)
- 6.4 Libraries and archives - Market size and forecast 2022-2027
- Exhibit 38: Chart on Libraries and archives - Market size and forecast 2022-2027 ($ billion)
- Exhibit 39: Data Table on Libraries and archives - Market size and forecast 2022-2027 ($ billion)
- Exhibit 40: Chart on Libraries and archives - Year-over-year growth 2022-2027 (%)
- Exhibit 41: Data Table on Libraries and archives - Year-over-year growth 2022-2027 (%)
- 6.5 Market opportunity by Type
- Exhibit 42: Market opportunity by Type ($ billion)
7 Market Segmentation by End-user
- 7.1 Market segments
- Exhibit 43: Chart on End-user - Market share 2022-2027 (%)
- Exhibit 44: Data Table on End-user - Market share 2022-2027 (%)
- 7.2 Comparison by End-user
- Exhibit 45: Chart on Comparison by End-user
- Exhibit 46: Data Table on Comparison by End-user
- 7.3 Automotive - Market size and forecast 2022-2027
- Exhibit 47: Chart on Automotive - Market size and forecast 2022-2027 ($ billion)
- Exhibit 48: Data Table on Automotive - Market size and forecast 2022-2027 ($ billion)
- Exhibit 49: Chart on Automotive - Year-over-year growth 2022-2027 (%)
- Exhibit 50: Data Table on Automotive - Year-over-year growth 2022-2027 (%)
- 7.4 Healthcare - Market size and forecast 2022-2027
- Exhibit 51: Chart on Healthcare - Market size and forecast 2022-2027 ($ billion)
- Exhibit 52: Data Table on Healthcare - Market size and forecast 2022-2027 ($ billion)
- Exhibit 53: Chart on Healthcare - Year-over-year growth 2022-2027 (%)
- Exhibit 54: Data Table on Healthcare - Year-over-year growth 2022-2027 (%)
- 7.5 Retail - Market size and forecast 2022-2027
- Exhibit 55: Chart on Retail - Market size and forecast 2022-2027 ($ billion)
- Exhibit 56: Data Table on Retail - Market size and forecast 2022-2027 ($ billion)
- Exhibit 57: Chart on Retail - Year-over-year growth 2022-2027 (%)
- Exhibit 58: Data Table on Retail - Year-over-year growth 2022-2027 (%)
- 7.6 Manufacturing - Market size and forecast 2022-2027
- Exhibit 59: Chart on Manufacturing - Market size and forecast 2022-2027 ($ billion)
- Exhibit 60: Data Table on Manufacturing - Market size and forecast 2022-2027 ($ billion)
- Exhibit 61: Chart on Manufacturing - Year-over-year growth 2022-2027 (%)
- Exhibit 62: Data Table on Manufacturing - Year-over-year growth 2022-2027 (%)
- 7.7 Others - Market size and forecast 2022-2027
- Exhibit 63: Chart on Others - Market size and forecast 2022-2027 ($ billion)
- Exhibit 64: Data Table on Others - Market size and forecast 2022-2027 ($ billion)
- Exhibit 65: Chart on Others - Year-over-year growth 2022-2027 (%)
- Exhibit 66: Data Table on Others - Year-over-year growth 2022-2027 (%)
- 7.8 Market opportunity by End-user
- Exhibit 67: Market opportunity by End-user ($ billion)
8 Customer Landscape
- 8.1 Customer landscape overview
- Exhibit 68: Analysis of price sensitivity, lifecycle, customer purchase basket, adoption rates, and purchase criteria
9 Geographic Landscape
- 9.1 Geographic segmentation
- Exhibit 69: Chart on Market share by geography 2022-2027 (%)
- Exhibit 70: Data Table on Market share by geography 2022-2027 (%)
- 9.2 Geographic comparison
- Exhibit 71: Chart on Geographic comparison
- Exhibit 72: Data Table on Geographic comparison
- 9.3 APAC - Market size and forecast 2022-2027
- Exhibit 73: Chart on APAC - Market size and forecast 2022-2027 ($ billion)
- Exhibit 74: Data Table on APAC - Market size and forecast 2022-2027 ($ billion)
- Exhibit 75: Chart on APAC - Year-over-year growth 2022-2027 (%)
- Exhibit 76: Data Table on APAC - Year-over-year growth 2022-2027 (%)
- 9.4 North America - Market size and forecast 2022-2027
- Exhibit 77: Chart on North America - Market size and forecast 2022-2027 ($ billion)
- Exhibit 78: Data Table on North America - Market size and forecast 2022-2027 ($ billion)
- Exhibit 79: Chart on North America - Year-over-year growth 2022-2027 (%)
- Exhibit 80: Data Table on North America - Year-over-year growth 2022-2027 (%)
- 9.5 Europe - Market size and forecast 2022-2027
- Exhibit 81: Chart on Europe - Market size and forecast 2022-2027 ($ billion)
- Exhibit 82: Data Table on Europe - Market size and forecast 2022-2027 ($ billion)
- Exhibit 83: Chart on Europe - Year-over-year growth 2022-2027 (%)
- Exhibit 84: Data Table on Europe - Year-over-year growth 2022-2027 (%)
- 9.6 South America - Market size and forecast 2022-2027
- Exhibit 85: Chart on South America - Market size and forecast 2022-2027 ($ billion)
- Exhibit 86: Data Table on South America - Market size and forecast 2022-2027 ($ billion)
- Exhibit 87: Chart on South America - Year-over-year growth 2022-2027 (%)
- Exhibit 88: Data Table on South America - Year-over-year growth 2022-2027 (%)
- 9.7 Middle East and Africa - Market size and forecast 2022-2027
- Exhibit 89: Chart on Middle East and Africa - Market size and forecast 2022-2027 ($ billion)
- Exhibit 90: Data Table on Middle East and Africa - Market size and forecast 2022-2027 ($ billion)
- Exhibit 91: Chart on Middle East and Africa - Year-over-year growth 2022-2027 (%)
- Exhibit 92: Data Table on Middle East and Africa - Year-over-year growth 2022-2027 (%)
- 9.8 US - Market size and forecast 2022-2027
- Exhibit 93: Chart on US - Market size and forecast 2022-2027 ($ billion)
- Exhibit 94: Data Table on US - Market size and forecast 2022-2027 ($ billion)
- Exhibit 95: Chart on US - Year-over-year growth 2022-2027 (%)
- Exhibit 96: Data Table on US - Year-over-year growth 2022-2027 (%)
- 9.9 China - Market size and forecast 2022-2027
- Exhibit 97: Chart on China - Market size and forecast 2022-2027 ($ billion)
- Exhibit 98: Data Table on China - Market size and forecast 2022-2027 ($ billion)
- Exhibit 99: Chart on China - Year-over-year growth 2022-2027 (%)
- Exhibit 100: Data Table on China - Year-over-year growth 2022-2027 (%)
- 9.10 Japan - Market size and forecast 2022-2027
- Exhibit 101: Chart on Japan - Market size and forecast 2022-2027 ($ billion)
- Exhibit 102: Data Table on Japan - Market size and forecast 2022-2027 ($ billion)
- Exhibit 103: Chart on Japan - Year-over-year growth 2022-2027 (%)
- Exhibit 104: Data Table on Japan - Year-over-year growth 2022-2027 (%)
- 9.11 UK - Market size and forecast 2022-2027
- Exhibit 105: Chart on UK - Market size and forecast 2022-2027 ($ billion)
- Exhibit 106: Data Table on UK - Market size and forecast 2022-2027 ($ billion)
- Exhibit 107: Chart on UK - Year-over-year growth 2022-2027 (%)
- Exhibit 108: Data Table on UK - Year-over-year growth 2022-2027 (%)
- 9.12 Germany - Market size and forecast 2022-2027
- Exhibit 109: Chart on Germany - Market size and forecast 2022-2027 ($ billion)
- Exhibit 110: Data Table on Germany - Market size and forecast 2022-2027 ($ billion)
- Exhibit 111: Chart on Germany - Year-over-year growth 2022-2027 (%)
- Exhibit 112: Data Table on Germany - Year-over-year growth 2022-2027 (%)
- 9.13 Market opportunity by geography
- Exhibit 113: Market opportunity by geography ($ billion)
10 Drivers, Challenges, and Trends
- 10.1 Market drivers
- 10.2 Market challenges
- 10.3 Impact of drivers and challenges
- Exhibit 114: Impact of drivers and challenges in 2022 and 2027
- 10.4 Market trends
11 Vendor Landscape
- 11.1 Overview
- 11.2 Vendor landscape
- Exhibit 115: Overview on Criticality of inputs and Factors of differentiation
- 11.3 Landscape disruption
- Exhibit 116: Overview on factors of disruption
- 11.4 Industry risks
- Exhibit 117: Impact of key risks on business
12 Vendor Analysis
- 12.1 Vendors covered
- Exhibit 118: Vendors covered
- 12.2 Market positioning of vendors
- Exhibit 119: Matrix on vendor position and classification
- 12.3 Agence France Presse
- Exhibit 120: Agence France Presse - Overview
- Exhibit 121: Agence France Presse - Product / Service
- Exhibit 122: Agence France Presse - Key offerings
- 12.4 AGS Corp.
- Exhibit 123: AGS Corp. - Overview
- Exhibit 124: AGS Corp. - Product / Service
- Exhibit 125: AGS Corp. - Key offerings
- 12.5 Australian Associated Press Ltd.
- Exhibit 126: Australian Associated Press Ltd. - Overview
- Exhibit 127: Australian Associated Press Ltd. - Product / Service
- Exhibit 128: Australian Associated Press Ltd. - Key offerings
- 12.6 Bloomberg L.P
- Exhibit 129: Bloomberg L.P - Overview
- Exhibit 130: Bloomberg L.P - Product / Service
- Exhibit 131: Bloomberg L.P - Key news
- Exhibit 132: Bloomberg L.P - Key offerings
- 12.7 Clarivate PLC
- Exhibit 133: Clarivate PLC - Overview
- Exhibit 134: Clarivate PLC - Business segments
- Exhibit 135: Clarivate PLC - Key news
- Exhibit 136: Clarivate PLC - Key offerings
- Exhibit 137: Clarivate PLC - Segment focus
- 12.8 FUJIFILM Holdings Corp.
- Exhibit 138: FUJIFILM Holdings Corp. - Overview
- Exhibit 139: FUJIFILM Holdings Corp. - Business segments
- Exhibit 140: FUJIFILM Holdings Corp. - Key news
- Exhibit 141: FUJIFILM Holdings Corp. - Key offerings
- Exhibit 142: FUJIFILM Holdings Corp. - Segment focus
- 12.9 GISP Group
- Exhibit 143: GISP Group - Overview
- Exhibit 144: GISP Group - Product / Service
- Exhibit 145: GISP Group - Key offerings
- 12.10 News Corp.
- Exhibit 146: News Corp. - Overview
- Exhibit 147: News Corp. - Business segments
- Exhibit 148: News Corp. - Key offerings
- Exhibit 149: News Corp. - Segment focus
- 12.11 RELX Plc
- Exhibit 150: RELX Plc - Overview
- Exhibit 151: RELX Plc - Business segments
- Exhibit 152: RELX Plc - Key offerings
- Exhibit 153: RELX Plc - Segment focus
- 12.12 S and P Global Inc.
- Exhibit 154: S and P Global Inc. - Overview
- Exhibit 155: S and P Global Inc. - Business segments
- Exhibit 156: S and P Global Inc. - Key offerings
- Exhibit 157: S and P Global Inc. - Segment focus
- 12.13 The New York Public Library
- Exhibit 158: The New York Public Library - Overview
- Exhibit 159: The New York Public Library - Product / Service
- Exhibit 160: The New York Public Library - Key offerings
- 12.14 The New York Times Co.
- Exhibit 161: The New York Times Co. - Overview
- Exhibit 162: The New York Times Co. - Business segments
- Exhibit 163: The New York Times Co. - Key news
- Exhibit 164: The New York Times Co. - Key offerings
- Exhibit 165: The New York Times Co. - Segment focus
- 12.15 Thomson Reuters Corp.
- Exhibit 166: Thomson Reuters Corp. - Overview
- Exhibit 167: Thomson Reuters Corp. - Business segments
- Exhibit 168: Thomson Reuters Corp. - Key offerings
- Exhibit 169: Thomson Reuters Corp. - Segment focus
- 12.16 United Press International Inc.
- Exhibit 170: United Press International Inc. - Overview
- Exhibit 171: United Press International Inc. - Product / Service
- Exhibit 172: United Press International Inc. - Key offerings
- 12.17 Wolters Kluwer NV
- Exhibit 173: Wolters Kluwer NV - Overview
- Exhibit 174: Wolters Kluwer NV - Business segments
- Exhibit 175: Wolters Kluwer NV - Key offerings
- Exhibit 176: Wolters Kluwer NV - Segment focus
13 Appendix
- 13.1 Scope of the report
- 13.2 Inclusions and exclusions checklist
- Exhibit 177: Inclusions checklist
- Exhibit 178: Exclusions checklist
- 13.3 Currency conversion rates for US$
- Exhibit 179: Currency conversion rates for US$
- 13.4 Research methodology
- Exhibit 180: Research methodology
- Exhibit 181: Validation techniques employed for market sizing
- Exhibit 182: Information sources
- 13.5 List of abbreviations
- Exhibit 183: List of abbreviations
Technavio is a leading global technology research and advisory company. Their research and analysis focus on emerging market trends and provides actionable insights to help businesses identify market opportunities and develop effective strategies to optimize their market positions. With over 500 specialized analysts, Technavio's report library consists of more than 17,000 reports and counting, covering 800 technologies, spanning across 50 countries. Their client base consists of enterprises of all sizes, including more than 100 Fortune 500 companies. This growing client base relies on Technavio's comprehensive coverage, extensive research, and actionable market insights to identify opportunities in existing and potential markets and assess their competitive positions within changing market scenarios.
Contact
Technavio Research
Jesse Maida
Media & Marketing Executive
US: +1 844 364 1100
UK: +44 203 893 3200
Email: media@technavio.com
Website: www.technavio.com/

View original content to download multimedia:https://www.prnewswire.com/news-releases/information-services-market-size-to-increase-by-usd-68-41-billion-apac-to-contribute-39-of-market-growth---technavio-301694853.html
SOURCE Technavio
Uncategorized
Homes listed for sale in early June sell for $7,700 more
New Zillow research suggests the spring home shopping season may see a second wave this summer if mortgage rates fall
The post Homes listed for sale in…
Share this:


- A Zillow analysis of 2023 home sales finds homes listed in the first two weeks of June sold for 2.3% more.
- The best time to list a home for sale is a month later than it was in 2019, likely driven by mortgage rates.
- The best time to list can be as early as the second half of February in San Francisco, and as late as the first half of July in New York and Philadelphia.
Spring home sellers looking to maximize their sale price may want to wait it out and list their home for sale in the first half of June. A new Zillow® analysis of 2023 sales found that homes listed in the first two weeks of June sold for 2.3% more, a $7,700 boost on a typical U.S. home.
The best time to list consistently had been early May in the years leading up to the pandemic. The shift to June suggests mortgage rates are strongly influencing demand on top of the usual seasonality that brings buyers to the market in the spring. This home-shopping season is poised to follow a similar pattern as that in 2023, with the potential for a second wave if the Federal Reserve lowers interest rates midyear or later.
The 2.3% sale price premium registered last June followed the first spring in more than 15 years with mortgage rates over 6% on a 30-year fixed-rate loan. The high rates put home buyers on the back foot, and as rates continued upward through May, they were still reassessing and less likely to bid boldly. In June, however, rates pulled back a little from 6.79% to 6.67%, which likely presented an opportunity for determined buyers heading into summer. More buyers understood their market position and could afford to transact, boosting competition and sale prices.
The old logic was that sellers could earn a premium by listing in late spring, when search activity hit its peak. Now, with persistently low inventory, mortgage rate fluctuations make their own seasonality. First-time home buyers who are on the edge of qualifying for a home loan may dip in and out of the market, depending on what’s happening with rates. It is almost certain the Federal Reserve will push back any interest-rate cuts to mid-2024 at the earliest. If mortgage rates follow, that could bring another surge of buyers later this year.
Mortgage rates have been impacting affordability and sale prices since they began rising rapidly two years ago. In 2022, sellers nationwide saw the highest sale premium when they listed their home in late March, right before rates barreled past 5% and continued climbing.
Zillow’s research finds the best time to list can vary widely by metropolitan area. In 2023, it was as early as the second half of February in San Francisco, and as late as the first half of July in New York. Thirty of the top 35 largest metro areas saw for-sale listings command the highest sale prices between May and early July last year.
Zillow also found a wide range in the sale price premiums associated with homes listed during those peak periods. At the hottest time of the year in San Jose, homes sold for 5.5% more, a $88,000 boost on a typical home. Meanwhile, homes in San Antonio sold for 1.9% more during that same time period.
| Metropolitan Area | Best Time to List | Price Premium | Dollar Boost |
| United States | First half of June | 2.3% | $7,700 |
| New York, NY | First half of July | 2.4% | $15,500 |
| Los Angeles, CA | First half of May | 4.1% | $39,300 |
| Chicago, IL | First half of June | 2.8% | $8,800 |
| Dallas, TX | First half of June | 2.5% | $9,200 |
| Houston, TX | Second half of April | 2.0% | $6,200 |
| Washington, DC | Second half of June | 2.2% | $12,700 |
| Philadelphia, PA | First half of July | 2.4% | $8,200 |
| Miami, FL | First half of June | 2.3% | $12,900 |
| Atlanta, GA | Second half of June | 2.3% | $8,700 |
| Boston, MA | Second half of May | 3.5% | $23,600 |
| Phoenix, AZ | First half of June | 3.2% | $14,700 |
| San Francisco, CA | Second half of February | 4.2% | $50,300 |
| Riverside, CA | First half of May | 2.7% | $15,600 |
| Detroit, MI | First half of July | 3.3% | $7,900 |
| Seattle, WA | First half of June | 4.3% | $31,500 |
| Minneapolis, MN | Second half of May | 3.7% | $13,400 |
| San Diego, CA | Second half of April | 3.1% | $29,600 |
| Tampa, FL | Second half of June | 2.1% | $8,000 |
| Denver, CO | Second half of May | 2.9% | $16,900 |
| Baltimore, MD | First half of July | 2.2% | $8,200 |
| St. Louis, MO | First half of June | 2.9% | $7,000 |
| Orlando, FL | First half of June | 2.2% | $8,700 |
| Charlotte, NC | Second half of May | 3.0% | $11,000 |
| San Antonio, TX | First half of June | 1.9% | $5,400 |
| Portland, OR | Second half of April | 2.6% | $14,300 |
| Sacramento, CA | First half of June | 3.2% | $17,900 |
| Pittsburgh, PA | Second half of June | 2.3% | $4,700 |
| Cincinnati, OH | Second half of April | 2.7% | $7,500 |
| Austin, TX | Second half of May | 2.8% | $12,600 |
| Las Vegas, NV | First half of June | 3.4% | $14,600 |
| Kansas City, MO | Second half of May | 2.5% | $7,300 |
| Columbus, OH | Second half of June | 3.3% | $10,400 |
| Indianapolis, IN | First half of July | 3.0% | $8,100 |
| Cleveland, OH | First half of July | 3.4% | $7,400 |
| San Jose, CA | First half of June | 5.5% | $88,400 |
The post Homes listed for sale in early June sell for $7,700 more appeared first on Zillow Research.
federal reserve pandemic home sales mortgage rates interest ratesUncategorized
February Employment Situation
By Paul Gomme and Peter Rupert The establishment data from the BLS showed a 275,000 increase in payroll employment for February, outpacing the 230,000…
Share this:


By Paul Gomme and Peter Rupert
The establishment data from the BLS showed a 275,000 increase in payroll employment for February, outpacing the 230,000 average over the previous 12 months. The payroll data for January and December were revised down by a total of 167,000. The private sector added 223,000 new jobs, the largest gain since May of last year.

Temporary help services employment continues a steep decline after a sharp post-pandemic rise.


Average hours of work increased from 34.2 to 34.3. The increase, along with the 223,000 private employment increase led to a hefty increase in total hours of 5.6% at an annualized rate, also the largest increase since May of last year.

The establishment report, once again, beat “expectations;” the WSJ survey of economists was 198,000. Other than the downward revisions, mentioned above, another bit of negative news was a smallish increase in wage growth, from $34.52 to $34.57.

The household survey shows that the labor force increased 150,000, a drop in employment of 184,000 and an increase in the number of unemployed persons of 334,000. The labor force participation rate held steady at 62.5, the employment to population ratio decreased from 60.2 to 60.1 and the unemployment rate increased from 3.66 to 3.86. Remember that the unemployment rate is the number of unemployed relative to the labor force (the number employed plus the number unemployed). Consequently, the unemployment rate can go up if the number of unemployed rises holding fixed the labor force, or if the labor force shrinks holding the number unemployed unchanged. An increase in the unemployment rate is not necessarily a bad thing: it may reflect a strong labor market drawing “marginally attached” individuals from outside the labor force. Indeed, there was a 96,000 decline in those workers.


Earlier in the week, the BLS announced JOLTS (Job Openings and Labor Turnover Survey) data for January. There isn’t much to report here as the job openings changed little at 8.9 million, the number of hires and total separations were little changed at 5.7 million and 5.3 million, respectively.

As has been the case for the last couple of years, the number of job openings remains higher than the number of unemployed persons.

Also earlier in the week the BLS announced that productivity increased 3.2% in the 4th quarter with output rising 3.5% and hours of work rising 0.3%.

The bottom line is that the labor market continues its surprisingly (to some) strong performance, once again proving stronger than many had expected. This strength makes it difficult to justify any interest rate cuts soon, particularly given the recent inflation spike.
unemployment pandemic unemploymentUncategorized
Mortgage rates fall as labor market normalizes
Jobless claims show an expanding economy. We will only be in a recession once jobless claims exceed 323,000 on a four-week moving average.
Share this:


Everyone was waiting to see if this week’s jobs report would send mortgage rates higher, which is what happened last month. Instead, the 10-year yield had a muted response after the headline number beat estimates, but we have negative job revisions from previous months. The Federal Reserve’s fear of wage growth spiraling out of control hasn’t materialized for over two years now and the unemployment rate ticked up to 3.9%. For now, we can say the labor market isn’t tight anymore, but it’s also not breaking.
The key labor data line in this expansion is the weekly jobless claims report. Jobless claims show an expanding economy that has not lost jobs yet. We will only be in a recession once jobless claims exceed 323,000 on a four-week moving average.
From the Fed: In the week ended March 2, initial claims for unemployment insurance benefits were flat, at 217,000. The four-week moving average declined slightly by 750, to 212,250
Below is an explanation of how we got here with the labor market, which all started during COVID-19.
1. I wrote the COVID-19 recovery model on April 7, 2020, and retired it on Dec. 9, 2020. By that time, the upfront recovery phase was done, and I needed to model out when we would get the jobs lost back.
2. Early in the labor market recovery, when we saw weaker job reports, I doubled and tripled down on my assertion that job openings would get to 10 million in this recovery. Job openings rose as high as to 12 million and are currently over 9 million. Even with the massive miss on a job report in May 2021, I didn’t waver.
Currently, the jobs openings, quit percentage and hires data are below pre-COVID-19 levels, which means the labor market isn’t as tight as it once was, and this is why the employment cost index has been slowing data to move along the quits percentage.

3. I wrote that we should get back all the jobs lost to COVID-19 by September of 2022. At the time this would be a speedy labor market recovery, and it happened on schedule, too
Total employment data
4. This is the key one for right now: If COVID-19 hadn’t happened, we would have between 157 million and 159 million jobs today, which would have been in line with the job growth rate in February 2020. Today, we are at 157,808,000. This is important because job growth should be cooling down now. We are more in line with where the labor market should be when averaging 140K-165K monthly. So for now, the fact that we aren’t trending between 140K-165K means we still have a bit more recovery kick left before we get down to those levels.

From BLS: Total nonfarm payroll employment rose by 275,000 in February, and the unemployment rate increased to 3.9 percent, the U.S. Bureau of Labor Statistics reported today. Job gains occurred in health care, in government, in food services and drinking places, in social assistance, and in transportation and warehousing.
Here are the jobs that were created and lost in the previous month:

In this jobs report, the unemployment rate for education levels looks like this:
- Less than a high school diploma: 6.1%
- High school graduate and no college: 4.2%
- Some college or associate degree: 3.1%
- Bachelor’s degree or higher: 2.2%

Today’s report has continued the trend of the labor data beating my expectations, only because I am looking for the jobs data to slow down to a level of 140K-165K, which hasn’t happened yet. I wouldn’t categorize the labor market as being tight anymore because of the quits ratio and the hires data in the job openings report. This also shows itself in the employment cost index as well. These are key data lines for the Fed and the reason we are going to see three rate cuts this year.
recession unemployment covid-19 fed federal reserve mortgage rates recession recovery unemployment


-

 Uncategorized3 weeks ago
All Of The Elements Are In Place For An Economic Crisis Of Staggering Proportions
-

 Uncategorized1 month ago
Cathie Wood sells a major tech stock (again)
-

 Uncategorized3 weeks ago
California Counties Could Be Forced To Pay $300 Million To Cover COVID-Era Program
-

 Uncategorized2 weeks ago
Apparel Retailer Express Moving Toward Bankruptcy
-

 Uncategorized4 weeks ago
Industrial Production Decreased 0.1% in January
-

 International3 days ago
Walmart launches clever answer to Target’s new membership program
-

 International3 days ago
EyePoint poaches medical chief from Apellis; Sandoz CFO, longtime BioNTech exec to retire
-

 Uncategorized3 weeks ago
RFK Jr: The Wuhan Cover-Up & The Rise Of The Biowarfare-Industrial Complex