Uncategorized
How Long Can Semiconductors Lead the Market?
With Jerome Powell so data-dependent, as he stated on his second and last day of testimony, it seems pretty obvious where most of the growth and labor…
Share this:

With Jerome Powell so data-dependent, as he stated on his second and last day of testimony, it seems pretty obvious where most of the growth and labor strength is coming from.
This isn't the first time we have seen semiconductors lead the market, and we can say that it has not historically ended well if the rest of the Economic Modern Family cannot keep up.
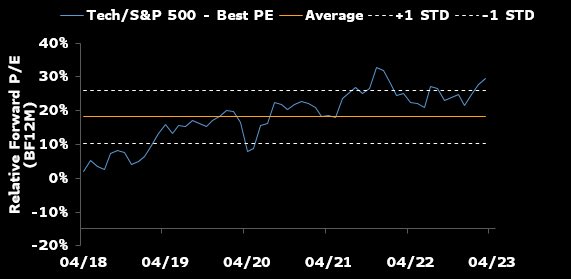
Tech's relative premium compared to the S&P 500 is nearing its pandemic bubble peak. This is in an environment a bit different than late 2021, thought, as we now have much higher interest rates, and slower economic growth. And that is both the good news and bad news.
With AI and chip stocks so obviously outperforming the SPY and the rest of the Economic Modern Family, you have to wonder -- is this a delusional response, or like Wonder Woman herself, impervious to the barbs of rates, GDP, geopolitics and sentiment?

Of all the sectors in the Modern Family, SMH is indeed the strongest. Our "Sister" SMH sits right below the 23-month or 2-year business cycle. Why is this significant?
In 2021 we saw a major bull market. In 2022, we had a major bear market. Is it any wonder that 2023 remains the "what's up" year to date? Yet it is also the reason we are watching SMH so carefully.
If SMH fails to take out the 23-month and begins to decline from here, clearly the weakness of Regional Banks (KRE) and Retail (XRT) has come home to roost. Conversely, should SMH clear and close by month's end the 23-month moving average, then it tells us 2 things.
- The best hope for the US economy's growth lies with chip technology.
- The rest of the Family may not run hot, but it will more than likely stop the bleed.
For more detailed trading information about our blended models, tools and trader education courses, contact Rob Quinn, our Chief Strategy Consultant, to learn more.
IT'S NOT TOO LATE! Click here if you'd like a complimentary copy of Mish's 2023 Market Outlook E-Book in your inbox.


"I grew my money tree and so can you!" - Mish Schneider
Get your copy of Plant Your Money Tree: A Guide to Growing Your Wealth and a special bonus here.
Follow Mish on Twitter @marketminute for stock picks and more. Follow Mish on Instagram (mishschneider) for daily morning videos. To see updated media clips, click here.
Mish in the Media
Mish joins Mary Ellen McGonagle (of MEM Investment Research) and Erin Swenlin (of DecisionPoint.com) on the March 2023 edition of StockCharts TV's The Pitch.
Mish talks women in finance for International Women's Day on Business First AM.
Mish focuses on defense stocks in this appearance on CNBC Asia.
Mish points out a Biotech stock and a Transportation stock to watch if the market settles on Business First AM.
Mish joins Maggie Lake on Real Vision to talk commodities and setups!
Read about Mish's article about the implications of elevated sugar prices in this article from Kitco!
While the indices remain range bound, Mish shows you several emerging trends on the Wednesday, March 1 edition of StockCharts TV's Your Daily Five!
Mish joins Business First AM for Stock Picking Time in this video!
See Mish sit down with Amber Kanwar of BNN Bloomberg to discuss the current market conditions and some picks.
Click here to watch Mish and StockCharts.com's David Keller join Jared Blikre as they discuss trading, advice to new investors, crypto, and AI on Yahoo Finance.
In her latest video for CMC Markets, MarketGauge's Mish Schneider shares insights on the gold, the S&P 500 and natural gas and what traders can expect as the markets remain mixed.
Coming Up:
March 8th: Investment Strategy Twitter Spaces with Wolf Financial
March 9th: Twitter Spaces with Wolf Financial
March 13th: Mish on TD Ameritrade with Nicole Petallides
March 14th: F.A.C.E. Forex Analytix with Dale Pinkert
March 16th: The Final Bar with Dave Keller, StockCharts TV
And down on the road
March 20th: Madam Trader Podcast with Ashley Kyle Miller
March 22nd: The RoShowPod with Rosanna Prestia
March 24th: Opening Bell with BNN Bloomberg
March 30th: Your Daily Five, StockCharts TV
March 31st: Festival of Learning Real Vision "Portfolio Doctor"
April 24-26: Mish at The Money Show in Las Vegas
ETF Summary
- S&P 500 (SPY): 390 support with 405 pivotal, 410 resistance.
- Russell 2000 (IWM): 190 resistance, 185 support.
- Dow (DIA): 326 support, 335 resistance.
- Nasdaq (QQQ): 300 the pivotal area, 290 major support; 284 big support, 300 pivotal, 305 resistance.
- Regional Banks (KRE): 57 big support, 60 resistance.
- Semiconductors (SMH): 240 pivotal, 248 key resistance; 248 resistance, 237 then 229 support.
- Transportation (IYT): 240 resistance and 230 support.
- Biotechnology (IBB): 125-135 trading range.
- Retail (XRT): 66 pivotal with 64 key support.
Mish Schneider
MarketGauge.com
Director of Trading Research and Education
sp 500 nasdaq stocks pandemic etf russell 2000 crypto commodities goldUncategorized
Q4 Update: Delinquencies, Foreclosures and REO
Today, in the Calculated Risk Real Estate Newsletter: Q4 Update: Delinquencies, Foreclosures and REO
A brief excerpt: I’ve argued repeatedly that we would NOT see a surge in foreclosures that would significantly impact house prices (as happened followi…
Share this:


A brief excerpt:
I’ve argued repeatedly that we would NOT see a surge in foreclosures that would significantly impact house prices (as happened following the housing bubble). The two key reasons are mortgage lending has been solid, and most homeowners have substantial equity in their homes..There is much more in the article. You can subscribe at https://calculatedrisk.substack.com/ mortgage rates real estate mortgages pandemic interest rates
...
And on mortgage rates, here is some data from the FHFA’s National Mortgage Database showing the distribution of interest rates on closed-end, fixed-rate 1-4 family mortgages outstanding at the end of each quarter since Q1 2013 through Q3 2023 (Q4 2023 data will be released in a two weeks).
This shows the surge in the percent of loans under 3%, and also under 4%, starting in early 2020 as mortgage rates declined sharply during the pandemic. Currently 22.6% of loans are under 3%, 59.4% are under 4%, and 78.7% are under 5%.
With substantial equity, and low mortgage rates (mostly at a fixed rates), few homeowners will have financial difficulties.
Uncategorized
‘Bougie Broke’ – The Financial Reality Behind The Facade
‘Bougie Broke’ – The Financial Reality Behind The Facade
Authored by Michael Lebowitz via RealInvestmentAdvice.com,
Social media users claiming…
Share this:


Authored by Michael Lebowitz via RealInvestmentAdvice.com,
Social media users claiming to be Bougie Broke share pictures of their fancy cars, high-fashion clothing, and selfies in exotic locations and expensive restaurants. Yet they complain about living paycheck to paycheck and lacking the means to support their lifestyle.
Bougie broke is like “keeping up with the Joneses,” spending beyond one’s means to impress others.
Bougie Broke gives us a glimpse into the financial condition of a growing number of consumers. Since personal consumption represents about two-thirds of economic activity, it’s worth diving into the Bougie Broke fad to appreciate if a large subset of the population can continue to consume at current rates.
The Wealth Divide Disclaimer
Forecasting personal consumption is always tricky, but it has become even more challenging in the post-pandemic era. To appreciate why we share a joke told by Mike Green.
Bill Gates and I walk into the bar…
Bartender: “Wow… a couple of billionaires on average!”
Bill Gates, Jeff Bezos, Elon Musk, Mark Zuckerberg, and other billionaires make us all much richer, on average. Unfortunately, we can’t use the average to pay our bills.
According to Wikipedia, Bill Gates is one of 756 billionaires living in the United States. Many of these billionaires became much wealthier due to the pandemic as their investment fortunes proliferated.
To appreciate the wealth divide, consider the graph below courtesy of Statista. 1% of the U.S. population holds 30% of the wealth. The wealthiest 10% of households have two-thirds of the wealth. The bottom half of the population accounts for less than 3% of the wealth.
The uber-wealthy grossly distorts consumption and savings data. And, with the sharp increase in their wealth over the past few years, the consumption and savings data are more distorted.
Furthermore, and critical to appreciate, the spending by the wealthy doesn’t fluctuate with the economy. Therefore, the spending of the lower wealth classes drives marginal changes in consumption. As such, the condition of the not-so-wealthy is most important for forecasting changes in consumption.
Revenge Spending
Deciphering personal data has also become more difficult because our spending habits have changed due to the pandemic.
A great example is revenge spending. Per the New York Times:
Ola Majekodunmi, the founder of All Things Money, a finance site for young adults, explained revenge spending as expenditures meant to make up for “lost time” after an event like the pandemic.
So, between the growing wealth divide and irregular spending habits, let’s quantify personal savings, debt usage, and real wages to appreciate better if Bougie Broke is a mass movement or a silly meme.
The Means To Consume
Savings, debt, and wages are the three primary sources that give consumers the ability to consume.
Savings
The graph below shows the rollercoaster on which personal savings have been since the pandemic. The savings rate is hovering at the lowest rate since those seen before the 2008 recession. The total amount of personal savings is back to 2017 levels. But, on an inflation-adjusted basis, it’s at 10-year lows. On average, most consumers are drawing down their savings or less. Given that wages are increasing and unemployment is historically low, they must be consuming more.
Now, strip out the savings of the uber-wealthy, and it’s probable that the amount of personal savings for much of the population is negligible. A survey by Payroll.org estimates that 78% of Americans live paycheck to paycheck.

More on Insufficient Savings
The Fed’s latest, albeit old, Report on the Economic Well-Being of U.S. Households from June 2023 claims that over a third of households do not have enough savings to cover an unexpected $400 expense. We venture to guess that number has grown since then. To wit, the number of households with essentially no savings rose 5% from their prior report a year earlier.
Relatively small, unexpected expenses, such as a car repair or a modest medical bill, can be a hardship for many families. When faced with a hypothetical expense of $400, 63 percent of all adults in 2022 said they would have covered it exclusively using cash, savings, or a credit card paid off at the next statement (referred to, altogether, as “cash or its equivalent”). The remainder said they would have paid by borrowing or selling something or said they would not have been able to cover the expense.
Debt
After periods where consumers drained their existing savings and/or devoted less of their paychecks to savings, they either slowed their consumption patterns or borrowed to keep them up. Currently, it seems like many are choosing the latter option. Consumer borrowing is accelerating at a quicker pace than it was before the pandemic.
The first graph below shows outstanding credit card debt fell during the pandemic as the economy cratered. However, after multiple stimulus checks and broad-based economic recovery, consumer confidence rose, and with it, credit card balances surged.
The current trend is steeper than the pre-pandemic trend. Some may be a catch-up, but the current rate is unsustainable. Consequently, borrowing will likely slow down to its pre-pandemic trend or even below it as consumers deal with higher credit card balances and 20+% interest rates on the debt.

The second graph shows that since 2022, credit card balances have grown faster than our incomes. Like the first graph, the credit usage versus income trend is unsustainable, especially with current interest rates.

With many consumers maxing out their credit cards, is it any wonder buy-now-pay-later loans (BNPL) are increasing rapidly?
Insider Intelligence believes that 79 million Americans, or a quarter of those over 18 years old, use BNPL. Lending Tree claims that “nearly 1 in 3 consumers (31%) say they’re at least considering using a buy now, pay later (BNPL) loan this month.”More telling, according to their survey, only 52% of those asked are confident they can pay off their BNPL loan without missing a payment!
Wage Growth
Wages have been growing above trend since the pandemic. Since 2022, the average annual growth in compensation has been 6.28%. Higher incomes support more consumption, but higher prices reduce the amount of goods or services one can buy. Over the same period, real compensation has grown by less than half a percent annually. The average real compensation growth was 2.30% during the three years before the pandemic.
In other words, compensation is just keeping up with inflation instead of outpacing it and providing consumers with the ability to consume, save, or pay down debt.
It’s All About Employment
The unemployment rate is 3.9%, up slightly from recent lows but still among the lowest rates in the last seventy-five years.

The uptick in credit card usage, decline in savings, and the savings rate argue that consumers are slowly running out of room to keep consuming at their current pace.
However, the most significant means by which we consume is income. If the unemployment rate stays low, consumption may moderate. But, if the recent uptick in unemployment continues, a recession is extremely likely, as we have seen every time it turned higher.
It’s not just those losing jobs that consume less. Of greater impact is a loss of confidence by those employed when they see friends or neighbors being laid off.
Accordingly, the labor market is probably the most important leading indicator of consumption and of the ability of the Bougie Broke to continue to be Bougie instead of flat-out broke!
Summary
There are always consumers living above their means. This is often harmless until their means decline or disappear. The Bougie Broke meme and the ability social media gives consumers to flaunt their “wealth” is a new medium for an age-old message.
Diving into the data, it argues that consumption will likely slow in the coming months. Such would allow some consumers to save and whittle down their debt. That situation would be healthy and unlikely to cause a recession.
The potential for the unemployment rate to continue higher is of much greater concern. The combination of a higher unemployment rate and strapped consumers could accentuate a recession.
Uncategorized
The most potent labor market indicator of all is still strongly positive
– by New Deal democratOn Monday I examined some series from last Friday’s Household survey in the jobs report, highlighting that they more frequently…
Share this:


- by New Deal democrat
On Monday I examined some series from last Friday’s Household survey in the jobs report, highlighting that they more frequently than not indicated a recession was near or underway. But I concluded by noting that this survey has historically been noisy, and I thought it would be resolved away this time. Specifically, there was strong contrary data from the Establishment survey, backed up by yesterday’s inflation report, to the contrary. Today I’ll examine that, looking at two other series.


Q4 Update: Delinquencies, Foreclosures and REO


Digital Currency And Gold As Speculative Warnings


Bougie Broke The Financial Reality Behind The Facade


Aging at AACR Annual Meeting 2024


Bitcoin on Wheels: The Story of Bitcoinetas


Futures Flat At All-Time High As Bitcoin Surges To Record, Oil Rises


The most potent labor market indicator of all is still strongly positive


‘Bougie Broke’ – The Financial Reality Behind The Facade
-

 Uncategorized3 weeks ago
All Of The Elements Are In Place For An Economic Crisis Of Staggering Proportions
-

 International5 days ago
EyePoint poaches medical chief from Apellis; Sandoz CFO, longtime BioNTech exec to retire
-

 Uncategorized4 weeks ago
California Counties Could Be Forced To Pay $300 Million To Cover COVID-Era Program
-

 Uncategorized3 weeks ago
Apparel Retailer Express Moving Toward Bankruptcy
-

 Uncategorized4 weeks ago
Industrial Production Decreased 0.1% in January
-

 International5 days ago
Walmart launches clever answer to Target’s new membership program
-

 Uncategorized4 weeks ago
RFK Jr: The Wuhan Cover-Up & The Rise Of The Biowarfare-Industrial Complex
-

 Uncategorized3 weeks ago
GOP Efforts To Shore Up Election Security In Swing States Face Challenges