International
How Externalities Affect Systems
How Externalities Affect Systems
Share this:


It took about a billion years for life – single cell organisms — to develop on planet earth. Another 500 million years led to simple organisms that used photosynthesis; another 1 – 2 billion years before multi-cellular life appeared. The next billion years led to plants, dinosaurs, birds and mammals.
Evolution was the driving force of these changes. Suitability and adaptation was a key to competitive success. Life could adapt to changing conditions. But every now and again, fate intervened, in the form of five mass extinctions.
The most recent: About 66 million years ago, a 7.5-mile-wide asteroid traveling about 50,000 mph slammed into the earth in the ocean near Chicxulub, Mexico. The collision resulted in an explosion estimated at over 100 trillion tons of TNT. That’s about a billion times more energy than the Hiroshima atomic bomb. The impact gouged the Earth’s crust several miles deep and more than 115 miles long.1
It was not a good day to be a dinosaur.
Everything within 1,000 miles was killed by a giant fireball. That was followed by a 1,000-foot high tsunami, extinguishing the fires, and drowning anything that survived. Just in case a few creatures were still standing, a 600-mile an hour wind blast tore through the region. And that was just day one. Nuclear winter followed, chilling the planet by a global average of 14 to 18 degrees.2
Eventually, the critters that could adapt to these circumstances did. Thus, the dinosaurs demise was soon after followed by the rise fo the mammals. And by soon, I mean 10s of millions of years.
What does any of this have to do with markets, economics and investing?
You might be surprised. I am entranced by the idea of how externalities intervene in functioning systems. In markets, the usual variables affect longer secular cycles. The ebb and flow of the economy, inflation, consumer spending, employment, fiscal and monetary policy, interest rates, etc. all impact the longer cycle of price and value.
What happens when an externality hits the markets like an asteroid from space? What happens when a non-economic event crashes into stocks and bonds, and derails their prior path? Consider some of history’s externalities that have impacted markets:
• 1914 Assassination of Archduke Franz Ferdinand, sparking WW1;
• 1941 Attack on Pearl Harbor, bringing the US into WW2
• 1963 Assassination President JFK
• 2001 September 11 Terror Attacks on USA
• 2011 Tōhoku earthquake and tsunami, leading to a full system failure at the Fukushima Daiichi Nuclear plant;
• 2020 Covid-19 Pandemic, leading to a global lockdown.
There are surely many more you can think of, but these six are the ones that come to mind.
What happened in the past when these externalities hit? Markets would wobble, frightening everyone. Often, they would sell off fast and hard. But then, they would simply resume their prior trend.
That seems to be what is taking place currently: Covid 19 led to the fastest bear market in history, and the fastest snapback to prior highs. The move down was so deep that economically, none of the data could fit on the usual charts. I mentioned in April that we should not be too quick to assume the bull market was over, and so far, events seem to be confirming that view.
Which leads to an interesting question:
Will the economy and markets son mean revert? Will we go back to our prior structures in the economy, eventually returning to the way things were? Or has a sea change taken place? Will the economic dinosaurs soon find themselves replaced by smaller, more adaptable mammals?
I don’t pretend to know, but I do find the question fascinating.
Previously:
Off the Charts (July 31, 2020)
End of the Secular Bull? Not So Fast (April 3, 2020)
_______
1. All of these are approximations, and may be close to what actually happened or totally wrong.
2. Based on recent research and reasonable estimates.
3. Geological time spiral

The post How Externalities Affect Systems appeared first on The Big Picture.
International
Rand Paul Teases Senate GOP Leader Run – Musk Says “I Would Support”
Rand Paul Teases Senate GOP Leader Run – Musk Says "I Would Support"
Republican Kentucky Senator Rand Paul on Friday hinted that he may jump…
Share this:

Republican Kentucky Senator Rand Paul on Friday hinted that he may jump into the race to become the next Senate GOP leader, and Elon Musk was quick to support the idea. Republicans must find a successor for periodically malfunctioning Mitch McConnell, who recently announced he'll step down in November, though intending to keep his Senate seat until his term ends in January 2027, when he'd be within weeks of turning 86.
So far, the announced field consists of two quintessential establishment types: John Cornyn of Texas and John Thune of South Dakota. While John Barrasso's name had been thrown around as one of "The Three Johns" considered top contenders, the Wyoming senator on Tuesday said he'll instead seek the number two slot as party whip.
Paul used X to tease his potential bid for the position which -- if the GOP takes back the upper chamber in November -- could graduate from Minority Leader to Majority Leader. He started by telling his 5.1 million followers he'd had lots of people asking him about his interest in running...
Thousands of people have been asking if I'd run for Senate leadership...
— Rand Paul (@RandPaul) March 8, 2024
...then followed up with a poll in which he predictably annihilated Cornyn and Thune, taking a 96% share as of Friday night, with the other two below 2% each.
????????️VOTE NOW ????️ ???? Who would you like to be the next Senate leader?
— Rand Paul (@RandPaul) March 8, 2024
Elon Musk was quick to back the idea of Paul as GOP leader, while daring Cornyn and Thune to follow Paul's lead by throwing their names out for consideration by the Twitter-verse X-verse.
I would support Rand Paul and suspect that other candidates will not actually run polls out of concern for the results, but let’s see if they will!
— Elon Musk (@elonmusk) March 8, 2024
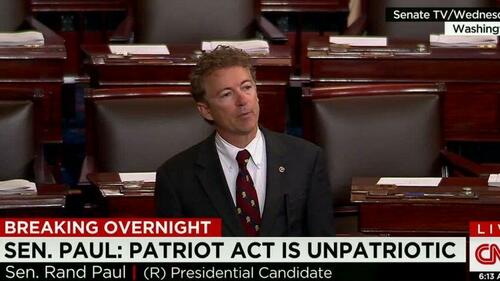
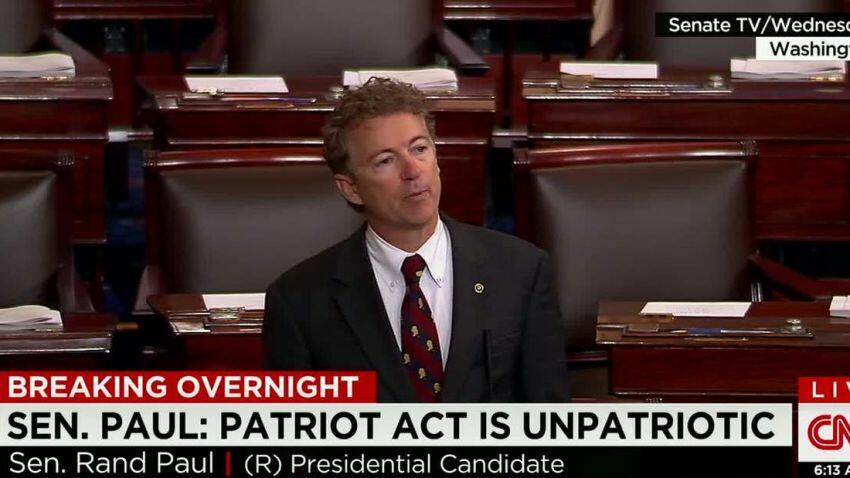
Paul has been a stalwart opponent of security-state mass surveillance, foreign interventionism -- to include shoveling billions of dollars into the proxy war in Ukraine -- and out-of-control spending in general. He demonstrated the latter passion on the Senate floor this week as he ridiculed the latest kick-the-can spending package:
This bill is an insult to the American people. The earmarks are all the wasteful spending that you could ever hope to see, and it should be defeated. Read more: https://t.co/Jt8K5iucA4 pic.twitter.com/I5okd4QgDg
— Senator Rand Paul (@SenRandPaul) March 8, 2024
In February, Paul used Senate rules to force his colleagues into a grueling Super Bowl weekend of votes, as he worked to derail a $95 billion foreign aid bill. "I think we should stay here as long as it takes,” said Paul. “If it takes a week or a month, I’ll force them to stay here to discuss why they think the border of Ukraine is more important than the US border.”
Don't expect a Majority Leader Paul to ditch the filibuster -- he's been a hardy user of the legislative delay tactic. In 2013, he spoke for 13 hours to fight the nomination of John Brennan as CIA director. In 2015, he orated for 10-and-a-half-hours to oppose extension of the Patriot Act.
Among the general public, Paul is probably best known as Capitol Hill's chief tormentor of Dr. Anthony Fauci, who was director of the National Institute of Allergy and Infectious Disease during the Covid-19 pandemic. Paul says the evidence indicates the virus emerged from China's Wuhan Institute of Virology. He's accused Fauci and other members of the US government public health apparatus of evading questions about their funding of the Chinese lab's "gain of function" research, which takes natural viruses and morphs them into something more dangerous. Paul has pointedly said that Fauci committed perjury in congressional hearings and that he belongs in jail "without question."
Musk is neither the only nor the first noteworthy figure to back Paul for party leader. Just hours after McConnell announced his upcoming step-down from leadership, independent 2024 presidential candidate Robert F. Kennedy, Jr voiced his support:
Mitch McConnell, who has served in the Senate for almost 40 years, announced he'll step down this November.
— Robert F. Kennedy Jr (@RobertKennedyJr) February 28, 2024
Part of public service is about knowing when to usher in a new generation. It’s time to promote leaders in Washington, DC who won’t kowtow to the military contractors or…
In a testament to the extent to which the establishment recoils at the libertarian-minded Paul, mainstream media outlets -- which have been quick to report on other developments in the majority leader race -- pretended not to notice that Paul had signaled his interest in the job. More than 24 hours after Paul's test-the-waters tweet-fest began, not a single major outlet had brought it to the attention of their audience.
That may be his strongest endorsement yet.
Spread & Containment
‘I couldn’t stand the pain’: the Turkish holiday resort that’s become an emergency dental centre for Britons who can’t get treated at home
The crisis in NHS dentistry is driving increasing numbers abroad for treatment. Here are some of their stories.
Share this:


It’s a hot summer day in the Turkish city of Antalya, a Mediterranean resort with golden beaches, deep blue sea and vibrant nightlife. The pool area of the all-inclusive resort is crammed with British people on sun loungers – but they aren’t here for a holiday. This hotel is linked to a dental clinic that organises treatment packages, and most of these guests are here to see a dentist.
From Norwich, two women talk about gums and injections. A man from Wales holds a tissue close to his mouth and spits blood – he has just had two molars extracted.
The dental clinic organises everything for these dental “tourists” throughout their treatment, which typically lasts from three to 15 days. The stories I hear of what has caused them to travel to Turkey are strikingly similar: all have struggled to secure dental treatment at home on the NHS.
“The hotel is nice and some days I go to the beach,” says Susan*, a hairdresser in her mid-30s from Norwich. “But really, we aren’t tourists like in a proper holiday. We come here because we have no choice. I couldn’t stand the pain.”

This is Susan’s second visit to Antalya. She explains that her ordeal started two years earlier:
I went to an NHS dentist who told me I had gum disease … She did some cleaning to my teeth and gums but it got worse. When I ate, my teeth were moving … the gums were bleeding and it was very painful. I called to say I was in pain but the clinic was not accepting NHS patients any more.
The only option the dentist offered Susan was to register as a private patient:
I asked how much. They said £50 for x-rays and then if the gum disease got worse, £300 or so for extraction. Four of them were moving – imagine: £1,200 for losing your teeth! Without teeth I’d lose my clients, but I didn’t have the money. I’m a single mum. I called my mum and cried.
Susan’s mother told her about a friend of hers who had been to Turkey for treatment, then together they found a suitable clinic:
The prices are so much cheaper! Tooth extraction, x-rays, consultations – it all comes included. The flight and hotel for seven days cost the same as losing four teeth in Norwich … I had my lower teeth removed here six months ago, now I’ve got implants … £2,800 for everything – hotel, transfer, treatments. I only paid the flights separately.
In the UK, roughly half the adult population suffers from periodontitis – inflammation of the gums caused by plaque bacteria that can lead to irreversible loss of gums, teeth, and bone. Regular reviews by a dentist or hygienist are required to manage this condition. But nine out of ten dental practices cannot offer NHS appointments to new adult patients, while eight in ten are not accepting new child patients.
Some UK dentists argue that Britons who travel abroad for treatment do so mainly for cosmetic procedures. They warn that dental tourism is dangerous, and that if their treatment goes wrong, dentists in the UK will be unable to help because they don’t want to be responsible for further damage. Susan shrugs this off:
Dentists in England say: ‘If you go to Turkey, we won’t touch you [afterwards].’ But I don’t worry because there are no appointments at home anyway. They couldn’t help in the first place, and this is why we are in Turkey.
‘How can we pay all this money?’
As a social anthropologist, I travelled to Turkey a number of times in 2023 to investigate the crisis of NHS dentistry, and the journeys abroad that UK patients are increasingly making as a result. I have relatives in Istanbul and have been researching migration and trading patterns in Turkey’s largest city since 2016.
In August 2023, I visited the resort in Antalya, nearly 400 miles south of Istanbul. As well as Susan, I met a group from a village in Wales who said there was no provision of NHS dentistry back home. They had organised a two-week trip to Turkey: the 12-strong group included a middle-aged couple with two sons in their early 20s, and two couples who were pensioners. By going together, Anya tells me, they could support each other through their different treatments:
I’ve had many cavities since I was little … Before, you could see a dentist regularly – you didn’t even think about it. If you had pain or wanted a regular visit, you phoned and you went … That was in the 1990s, when I went to the dentist maybe every year.
Anya says that once she had children, her family and work commitments meant she had no time to go to the dentist. Then, years later, she started having serious toothache:
Every time I chewed something, it hurt. I ate soups and soft food, and I also lost weight … Even drinking was painful – tea: pain, cold water: pain. I was taking paracetamol all the time! I went to the dentist to fix all this, but there were no appointments.
Anya was told she would have to wait months, or find a dentist elsewhere:
A private clinic gave me a list of things I needed done. Oh my God, almost £6,000. My husband went too – same story. How can we pay all this money? So we decided to come to Turkey. Some people we know had been here, and others in the village wanted to come too. We’ve brought our sons too – they also need to be checked and fixed. Our whole family could be fixed for less than £6,000.
By the time they travelled, Anya’s dental problems had turned into a dental emergency. She says she could not live with the pain anymore, and was relying on paracetamol.
In 2023, about 6 million adults in the UK experienced protracted pain (lasting more than two weeks) caused by toothache. Unintentional paracetamol overdose due to dental pain is a significant cause of admissions to acute medical units. If left untreated, tooth infections can spread to other parts of the body and cause life-threatening complications – and on rare occasions, death.
In February 2024, police were called to manage hundreds of people queuing outside a newly opened dental clinic in Bristol, all hoping to be registered or seen by an NHS dentist. One in ten Britons have admitted to performing “DIY dentistry”, of which 20% did so because they could not find a timely appointment. This includes people pulling out their teeth with pliers and using superglue to repair their teeth.
In the 1990s, dentistry was almost entirely provided through NHS services, with only around 500 solely private dentists registered. Today, NHS dentist numbers in England are at their lowest level in a decade, with 23,577 dentists registered to perform NHS work in 2022-23, down 695 on the previous year. Furthermore, the precise division of NHS and private work that each dentist provides is not measured.
The COVID pandemic created longer waiting lists for NHS treatment in an already stretched public service. In Bridlington, Yorkshire, people are now reportedly having to wait eight-to-nine years to get an NHS dental appointment with the only remaining NHS dentist in the town.
In his book Patients of the State (2012), Argentine sociologist Javier Auyero describes the “indignities of waiting”. It is the poor who are mostly forced to wait, he writes. Queues for state benefits and public services constitute a tangible form of power over the marginalised. There is an ethnic dimension to this story, too. Data suggests that in the UK, patients less likely to be effective in booking an NHS dental appointment are non-white ethnic groups and Gypsy or Irish travellers, and that it is particularly challenging for refugees and asylum-seekers to access dental care.

This article is part of Conversation Insights
The Insights team generates long-form journalism derived from interdisciplinary research. The team is working with academics from different backgrounds who have been engaged in projects aimed at tackling societal and scientific challenges.
In 2022, I experienced my own dental emergency. An infected tooth was causing me debilitating pain, and needed root canal treatment. I was advised this would cost £71 on the NHS, plus £307 for a follow-up crown – but that I would have to wait months for an appointment. The pain became excruciating – I could not sleep, let alone wait for months. In the same clinic, privately, I was quoted £1,300 for the treatment (more than half my monthly income at the time), or £295 for a tooth extraction.
I did not want to lose my tooth because of lack of money. So I bought a flight to Istanbul immediately for the price of the extraction in the UK, and my tooth was treated with root canal therapy by a private dentist there for £80. Including the costs of travelling, the total was a third of what I was quoted to be treated privately in the UK. Two years on, my treated tooth hasn’t given me any more problems.
A better quality of life
Not everyone is in Antalya for emergency procedures. The pensioners from Wales had contacted numerous clinics they found on the internet, comparing prices, treatments and hotel packages at least a year in advance, in a carefully planned trip to get dental implants – artificial replacements for tooth roots that help support dentures, crowns and bridges.

In Turkey, all the dentists I speak to (most of whom cater mainly for foreigners, including UK nationals) consider implants not a cosmetic or luxurious treatment, but a development in dentistry that gives patients who are able to have the procedure a much better quality of life. This procedure is not available on the NHS for most of the UK population, and the patients I meet in Turkey could not afford implants in private clinics back home.
Paul is in Antalya to replace his dentures, which have become uncomfortable and irritating to his gums, with implants. He says he couldn’t find an appointment to see an NHS dentist. His wife Sonia went through a similar procedure the year before and is very satisfied with the results, telling me: “Why have dentures that you need to put in a glass overnight, in the old style? If you can have implants, I say, you’re better off having them.”
Most of the dental tourists I meet in Antalya are white British: this city, known as the Turkish Riviera, has developed an entire economy catering to English-speaking tourists. In 2023, more than 1.3 million people visited the city from the UK, up almost 15% on the previous year.
Read more: NHS dentistry is in crisis – are overseas dentists the answer?
In contrast, the Britons I meet in Istanbul are predominantly from a non-white ethnic background. Omar, a pensioner of Pakistani origin in his early 70s, has come here after waiting “half a year” for an NHS appointment to fix the dental bridge that is causing him pain. Omar’s son had been previously for a hair transplant, and was offered a free dental checkup by the same clinic, so he suggested it to his father. Having worked as a driver for a manufacturing company for two decades in Birmingham, Omar says he feels disappointed to have contributed to the British economy for so long, only to be “let down” by the NHS:
At home, I must wait and wait and wait to get a bridge – and then I had many problems with it. I couldn’t eat because the bridge was uncomfortable and I was in pain, but there were no appointments on the NHS. I asked a private dentist and they recommended implants, but they are far too expensive [in the UK]. I started losing weight, which is not a bad thing at the beginning, but then I was worrying because I couldn’t chew and eat well and was losing more weight … Here in Istanbul, I got dental implants – US$500 each, problem solved! In England, each implant is maybe £2,000 or £3,000.
In the waiting area of another clinic in Istanbul, I meet Mariam, a British woman of Iraqi background in her late 40s, who is making her second visit to the dentist here. Initially, she needed root canal therapy after experiencing severe pain for weeks. Having been quoted £1,200 in a private clinic in outer London, Mariam decided to fly to Istanbul instead, where she was quoted £150 by a dentist she knew through her large family. Even considering the cost of the flight, Mariam says the decision was obvious:
Dentists in England are so expensive and NHS appointments so difficult to find. It’s awful there, isn’t it? Dentists there blamed me for my rotten teeth. They say it’s my fault: I don’t clean or I ate sugar, or this or that. I grew up in a village in Iraq and didn’t go to the dentist – we were very poor. Then we left because of war, so we didn’t go to a dentist … When I arrived in London more than 20 years ago, I didn’t speak English, so I still didn’t go to the dentist … I think when you move from one place to another, you don’t go to the dentist unless you are in real, real pain.
In Istanbul, Mariam has opted not only for the urgent root canal treatment but also a longer and more complex treatment suggested by her consultant, who she says is a renowned doctor from Syria. This will include several extractions and implants of back and front teeth, and when I ask what she thinks of achieving a “Hollywood smile”, Mariam says:
Who doesn’t want a nice smile? I didn’t come here to be a model. I came because I was in pain, but I know this doctor is the best for implants, and my front teeth were rotten anyway.
Dentists in the UK warn about the risks of “overtreatment” abroad, but Mariam appears confident that this is her opportunity to solve all her oral health problems. Two of her sisters have already been through a similar treatment, so they all trust this doctor.

The UK’s ‘dental deserts’
To get a fuller understanding of the NHS dental crisis, I’ve also conducted 20 interviews in the UK with people who have travelled or were considering travelling abroad for dental treatment.
Joan, a 50-year-old woman from Exeter, tells me she considered going to Turkey and could have afforded it, but that her back and knee problems meant she could not brave the trip. She has lost all her lower front teeth due to gum disease and, when I meet her, has been waiting 13 months for an NHS dental appointment. Joan tells me she is living in “shame”, unable to smile.
In the UK, areas with extremely limited provision of NHS dental services – known as as “dental deserts” – include densely populated urban areas such as Portsmouth and Greater Manchester, as well as many rural and coastal areas.
In Felixstowe, the last dentist taking NHS patients went private in 2023, despite the efforts of the activist group Toothless in Suffolk to secure better access to NHS dentists in the area. It’s a similar story in Ripon, Yorkshire, and in Dumfries & Galloway, Scotland, where nearly 25,000 patients have been de-registered from NHS dentists since 2021.
Data shows that 2 million adults must travel at least 40 miles within the UK to access dental care. Branding travel for dental care as “tourism” carries the risk of disguising the elements of duress under which patients move to restore their oral health – nationally and internationally. It also hides the immobility of those who cannot undertake such journeys.
The 90-year-old woman in Dumfries & Galloway who now faces travelling for hours by bus to see an NHS dentist can hardly be considered “tourism” – nor the Ukrainian war refugees who travelled back from West Sussex and Norwich to Ukraine, rather than face the long wait to see an NHS dentist.
Many people I have spoken to cannot afford the cost of transport to attend dental appointments two hours away – or they have care responsibilities that make it impossible. Instead, they are forced to wait in pain, in the hope of one day securing an appointment closer to home.

‘Your crisis is our business’
The indignities of waiting in the UK are having a big impact on the lives of some local and foreign dentists in Turkey. Some neighbourhoods are rapidly changing as dental and other health clinics, usually in luxurious multi-storey glass buildings, mushroom. In the office of one large Istanbul medical complex with sections for hair transplants and dentistry (plus one linked to a hospital for more extensive cosmetic surgery), its Turkish owner and main investor tells me:
Your crisis is our business, but this is a bazaar. There are good clinics and bad clinics, and unfortunately sometimes foreign patients do not know which one to choose. But for us, the business is very good.
This clinic only caters to foreign patients. The owner, an architect by profession who also developed medical clinics in Brazil, describes how COVID had a major impact on his business:
When in Europe you had COVID lockdowns, Turkey allowed foreigners to come. Many people came for ‘medical tourism’ – we had many patients for cosmetic surgery and hair transplants. And that was when the dental business started, because our patients couldn’t see a dentist in Germany or England. Then more and more patients started to come for dental treatments, especially from the UK and Ireland. For them, it’s very, very cheap here.
The reasons include the value of the Turkish lira relative to the British pound, the low cost of labour, the increasing competition among Turkish clinics, and the sheer motivation of dentists here. While most dentists catering to foreign patients are from Turkey, others have arrived seeking refuge from war and violence in Syria, Iraq, Afghanistan, Iran and beyond. They work diligently to rebuild their lives, careers and lost wealth.
Regardless of their origin, all dentists in Turkey must be registered and certified. Hamed, a Syrian dentist and co-owner of a new clinic in Istanbul catering to European and North American patients, tells me:
I know that you say ‘Syrian’ and people think ‘migrant’, ‘refugee’, and maybe think ‘how can this dentist be good?’ – but Syria, before the war, had very good doctors and dentists. Many of us came to Turkey and now I have a Turkish passport. I had to pass the exams to practise dentistry here – I study hard. The exams are in Turkish and they are difficult, so you cannot say that Syrian doctors are stupid.
Hamed talks excitedly about the latest technology that is coming to his profession: “There are always new materials and techniques, and we cannot stop learning.” He is about to travel to Paris to an international conference:
I can say my techniques are very advanced … I bet I put more implants and do more bone grafting and surgeries every week than any dentist you know in England. A good dentist is about practice and hand skills and experience. I work hard, very hard, because more and more patients are arriving to my clinic, because in England they don’t find dentists.

While there is no official data about the number of people travelling from the UK to Turkey for dental treatment, investors and dentists I speak to consider that numbers are rocketing. From all over the world, Turkey received 1.2 million visitors for “medical tourism” in 2022, an increase of 308% on the previous year. Of these, about 250,000 patients went for dentistry. One of the most renowned dental clinics in Istanbul had only 15 British patients in 2019, but that number increased to 2,200 in 2023 and is expected to reach 5,500 in 2024.
Like all forms of medical care, dental treatments carry risks. Most clinics in Turkey offer a ten-year guarantee for treatments and a printed clinical history of procedures carried out, so patients can show this to their local dentists and continue their regular annual care in the UK. Dental treatments, checkups and maintaining a good oral health is a life-time process, not a one-off event.
Many UK patients, however, are caught between a rock and a hard place – criticised for going abroad, yet unable to get affordable dental care in the UK before and after their return. The British Dental Association has called for more action to inform these patients about the risks of getting treated overseas – and has warned UK dentists about the legal implications of treating these patients on their return. But this does not address the difficulties faced by British patients who are being forced to go abroad in search of affordable, often urgent dental care.
A global emergency
The World Health Organization states that the explosion of oral disease around the world is a result of the “negligent attitude” that governments, policymakers and insurance companies have towards including oral healthcare under the umbrella of universal healthcare. It as if the health of our teeth and mouth is optional; somehow less important than treatment to the rest of our body. Yet complications from untreated tooth decay can lead to hospitalisation.
The main causes of oral health diseases are untreated tooth decay, severe gum disease, toothlessness, and cancers of the lip and oral cavity. Cases grew during the pandemic, when little or no attention was paid to oral health. Meanwhile, the global cosmetic dentistry market is predicted to continue growing at an annual rate of 13% for the rest of this decade, confirming the strong relationship between socioeconomic status and access to oral healthcare.
In the UK since 2018, there have been more than 218,000 admissions to hospital for rotting teeth, of which more than 100,000 were children. Some 40% of children in the UK have not seen a dentist in the past 12 months. The role of dentists in prevention of tooth decay and its complications, and in the early detection of mouth cancer, is vital. While there is a 90% survival rate for mouth cancer if spotted early, the lack of access to dental appointments is causing cases to go undetected.
The reasons for the crisis in NHS dentistry are complex, but include: the real-term cuts in funding to NHS dentistry; the challenges of recruitment and retention of dentists in rural and coastal areas; pay inequalities facing dental nurses, most of them women, who are being badly hit by the cost of living crisis; and, in England, the 2006 Dental Contract that does not remunerate dentists in a way that encourages them to continue seeing NHS patients.
The UK is suffering a mass exodus of the public dentistry workforce, with workers leaving the profession entirely or shifting to the private sector, where payments and life-work balance are better, bureaucracy is reduced, and prospects for career development look much better. A survey of general dental practitioners found that around half have reduced their NHS work since the pandemic – with 43% saying they were likely to go fully private, and 42% considering a career change or taking early retirement.
Reversing the UK’s dental crisis requires more commitment to substantial reform and funding than the “recovery plan” announced by Victoria Atkins, the secretary of state for health and social care, on February 7.
The stories I have gathered show that people travelling abroad for dental treatment don’t see themselves as “tourists” or vanity-driven consumers of the “Hollywood smile”. Rather, they have been forced by the crisis in NHS dentistry to seek out a service 1,500 miles away in Turkey that should be a basic, affordable right for all, on their own doorstep.
*Names in this article have been changed to protect the anonymity of the interviewees.

For you: more from our Insights series:
GP crisis: how did things go so wrong, and what needs to change?
Insomnia: how chronic sleep problems can lead to a spiralling decline in mental health
To hear about new Insights articles, join the hundreds of thousands of people who value The Conversation’s evidence-based news. Subscribe to our newsletter.
Diana Ibanez Tirado receives funding from the School of Global Studies, University of Sussex.
pound pandemic treatment therapy spread recovery iran brazil european europe uk germany ukraine world health organizationInternational
Beloved mall retailer files Chapter 7 bankruptcy, will liquidate
The struggling chain has given up the fight and will close hundreds of stores around the world.
Share this:


It has been a brutal period for several popular retailers. The fallout from the covid pandemic and a challenging economic environment have pushed numerous chains into bankruptcy with Tuesday Morning, Christmas Tree Shops, and Bed Bath & Beyond all moving from Chapter 11 to Chapter 7 bankruptcy liquidation.
In all three of those cases, the companies faced clear financial pressures that led to inventory problems and vendors demanding faster, or even upfront payment. That creates a sort of inevitability.
Related: Beloved retailer finds life after bankruptcy, new famous owner
When a retailer faces financial pressure it sets off a cycle where vendors become wary of selling them items. That leads to barren shelves and no ability for the chain to sell its way out of its financial problems.
Once that happens bankruptcy generally becomes the only option. Sometimes that means a Chapter 11 filing which gives the company a chance to negotiate with its creditors. In some cases, deals can be worked out where vendors extend longer terms or even forgive some debts, and banks offer an extension of loan terms.
In other cases, new funding can be secured which assuages vendor concerns or the company might be taken over by its vendors. Sometimes, as was the case with David's Bridal, a new owner steps in, adds new money, and makes deals with creditors in order to give the company a new lease on life.
It's rare that a retailer moves directly into Chapter 7 bankruptcy and decides to liquidate without trying to find a new source of funding.
Image source: Getty Images
The Body Shop has bad news for customers
The Body Shop has been in a very public fight for survival. Fears began when the company closed half of its locations in the United Kingdom. That was followed by a bankruptcy-style filing in Canada and an abrupt closure of its U.S. stores on March 4.
"The Canadian subsidiary of the global beauty and cosmetics brand announced it has started restructuring proceedings by filing a Notice of Intention (NOI) to Make a Proposal pursuant to the Bankruptcy and Insolvency Act (Canada). In the same release, the company said that, as of March 1, 2024, The Body Shop US Limited has ceased operations," Chain Store Age reported.
A message on the company's U.S. website shared a simple message that does not appear to be the entire story.
"We're currently undergoing planned maintenance, but don't worry we're due to be back online soon."
That same message is still on the company's website, but a new filing makes it clear that the site is not down for maintenance, it's down for good.
The Body Shop files for Chapter 7 bankruptcy
While the future appeared bleak for The Body Shop, fans of the brand held out hope that a savior would step in. That's not going to be the case.
The Body Shop filed for Chapter 7 bankruptcy in the United States.
"The US arm of the ethical cosmetics group has ceased trading at its 50 outlets. On Saturday (March 9), it filed for Chapter 7 insolvency, under which assets are sold off to clear debts, putting about 400 jobs at risk including those in a distribution center that still holds millions of dollars worth of stock," The Guardian reported.
After its closure in the United States, the survival of the brand remains very much in doubt. About half of the chain's stores in the United Kingdom remain open along with its Australian stores.
The future of those stores remains very much in doubt and the chain has shared that it needs new funding in order for them to continue operating.
The Body Shop did not respond to a request for comment from TheStreet.
bankruptcy pandemic canada

The Coming Of The Police State In America


Beloved mall retailer files Chapter 7 bankruptcy, will liquidate


‘I couldn’t stand the pain’: the Turkish holiday resort that’s become an emergency dental centre for Britons who can’t get treated at home


Rand Paul Teases Senate GOP Leader Run – Musk Says “I Would Support”


Another beloved brewery files Chapter 11 bankruptcy


Survey Shows Declining Concerns Among Americans About COVID-19
-

 Uncategorized3 weeks ago
All Of The Elements Are In Place For An Economic Crisis Of Staggering Proportions
-

 Uncategorized1 month ago
Cathie Wood sells a major tech stock (again)
-

 Uncategorized3 weeks ago
California Counties Could Be Forced To Pay $300 Million To Cover COVID-Era Program
-

 Uncategorized2 weeks ago
Apparel Retailer Express Moving Toward Bankruptcy
-

 Uncategorized4 weeks ago
Industrial Production Decreased 0.1% in January
-

 International3 days ago
Walmart launches clever answer to Target’s new membership program
-

 International3 days ago
EyePoint poaches medical chief from Apellis; Sandoz CFO, longtime BioNTech exec to retire
-

 Uncategorized3 weeks ago
RFK Jr: The Wuhan Cover-Up & The Rise Of The Biowarfare-Industrial Complex