The financial and housing markets are still trying to sort out the banking crisis and whether we have seen the last Fed rate hike in this cycle. These events led to lower mortgage rates and increased purchase application data last week, but decreased housing inventory.
Here’s a quick rundown of the last week:
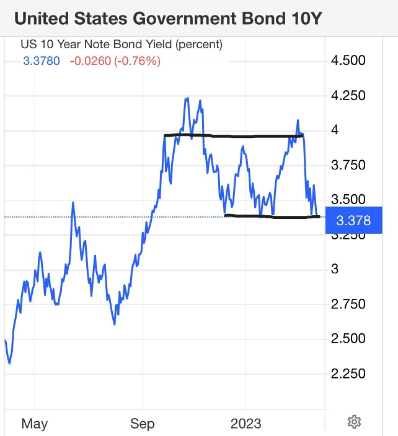
The 10-year yield had a Lord of Rings battle at a critical technical level, pushing mortgage rates lower at the end of the week with no real break in the bond market.
Active inventory fell 1,109, and new listing data made a lovely comeback week to week but was still noticeably down year over year.
Purchase applications rose for the third straight week as rates have fallen, taking back the three weeks of negative data we saw when rates rose from 5.99% to 7.10%.
The 10-year yield and mortgage rates
Over the last week, I’ve watched the bond market attempt to break lower through a critical level that I have dubbed Gandalf’s line in the sand where the 10-year yield shall not pass. To Gandalf’s credit, he has been able to hold off Balrog for another week. As you can see in the chart below, the bottom black line tied to the 3.37% rate has been hard to break.
On these crazy days in the financial markets, I stress to people, it’s not how the trading day goes that matters; it’s the final closing number. Like a magnet, the 10-year yield has tried to break below this crucial level many times over the last five months, only to shoot back up to close at a level that wouldn’t warrant a pass.
As you can see in the chart below, this played out again on Friday when bond yields fell hard during the early trading hours, only to close back at that line.
In any case, mortgage rates were 6.75% on March 21 and 6.38% on March 24; the recent highs were 7.10%. If the mortgage market wasn’t so stressed, mortgage rates should be at 5.99% today. In a regular market, they would be closer to 5.25%. The Federal Reserve has made the housing market into an orphan left in the rain with no home to go to because there isn’t much inventory out there, so the markets are simply too wild up and down.
In my 2023 forecast, I said that if the economy stays firm, the 10-year yield range should be between 3.21% and 4.25%, equating to 5.75% to 7.25% mortgage rates.If the economy gets weaker and we see a rise in jobless claims, the 10-year yield should go as low as 2.73%, translating to 5.25% mortgage rates. This assumes the spreads are wide, as the mortgage-backed securities market is still very stressed.
And now we have a new variable, a banking crisis which the Fed and some others believe could lead the economy into a faster recession, which the Fed has been pushing for some time now. In some ways, the banking crisis helps the Fed do their job because aggressive rate hikes have been unpopular and the Fed broke the regional banking system and now even a few global banks are in trouble too.
With this new variable, I am looking at the economic data differently to see whether we get the credit contraction the Fed wants to see to stop inflation, or if they have the tools to keep the banking crisis at bay so the economy can expand, making their fight against inflation harder. We will look at the data each week to determine the answer.
Weekly housing inventory
Looking at the Altos Research data from last week, the big question is whether we are finally starting to see the seasonal increase in spring inventory. Last week I was hopeful that the inventory increasing slightly would be the start of the spring rise, but this week we saw a slight decline.
Same week last year (March 18- March 25 ): Rose from 245,776 to 251,522
The bottom for 2022 was 240,194
As you can see from the chart below, we are far from the normal levels we enjoyed in the previous expansion.
One piece of good news last week was that the new listing data, which saw a significant collapse two weeks ago, rebounded excellently to return to a usual trend. I was hoping that week’s new listing data was just a one-off in the data line and not a more significant trend of new listing falling, and that looks to be the case now.
This made me very happy because the last thing the housing market needs is for new listing data to decline more than it has been this year. Of course, new listing data is down noticeably year over year, but last week’s increase made me feel a lot better about the year. This was the weekly listing data during the COVID years:
2021: 60,177
2022: 62,548
2023: 50,800
Compare that weekly listing data to the pre-COVID-19 levels:
2015: 108,685
2016: 76,109
2017: 79,676
As you can see, we had more new listing data back then, even though mortgage rates were higher than in 2021.
Last week’s existing home sales report from NAR shocked many people, excluding me, for the big rebound in sales. That report didn’t show any inventory growth and we are still below 1 million active listings.
So we have had the biggest one-year sales decline in history and a significant rebound in sales for one month. During this entire period — from 2022 through 2023 — this is where we are on total inventory levels: 980,000, far from the historical norms of 2 million to 2.5 million.
Purchase application data
We had another positive print on purchase application data, 2% week-to-week. When mortgage rates rose from 5.99% to 7.10%, we had three weeks of negative data and now we have had three weeks of positive purchase application data.
Overall, since Nov. 9, 2022, purchase applications have had more positive than negative data, something I talked about on CNBC last week.
Since we have a shallow bar in this data line, it tends to be very sensitive to rates, and mortgage rates themselves have been wilder than what we are accustomed to in the previous decade, where we had a range between 3.25%-5%.
Imagine the housing market if rates were in the low 5% range for a long time, not this wild Mr. Toad’s ride we see. Outside of that, it’s hard to get a mortgage rate shock like last year when rates moved from 3% to 7.37%. What happened last year will go into the record books.
The week ahead
Of course, all eyes are on the financial markets and what might come out of the woodwork next.
As I write this on Sunday night there are reports that First Citizen Bankwill likely be the buyer of Silicon Valley Bank. I will closely monitor the 10-year yield to see if we can break that Gandalf line in the sand or if it will reverse course as we have in the past. Remember to focus on the closing on the 10-year yield more than the intraday trading actions.
This week we don’t have too much economic data, but the home price report will come out on Monday and pending home sales on Tuesday. The pending home sales data might reflect some of the negative three weeks of purchase apps we endured when mortgage rates moved from 5.99% to 7.10%.
Also, later this week, I will write an article on how to look at housing economics if the Fed gets its job-loss recession and how and why we shouldn’t compare it to the 2008 period or the COVID-19 recovery period. I can already see some people making the same mistakes they made with the COVID-19 recession.
Some Federal Reserve members are discussing a recession due to the banking crisis, so it’s time to discuss what housing will look like if this happens. For this week, keep an eye on the financial markets and the closing of the bond yield. If we see some weakness in pending home sales, that will relate to when rates spiked.
As always, one day, one week at a time, we will look forward, not backward, with this Housing Market Tracker.
BUFFALO, NY- March 11, 2024 – Impact Journals publishes scholarly journals in the biomedical sciences with a focus on all areas of cancer and aging research. Aging is one of the most prominent journals published by Impact Journals.
Credit: Impact Journals
BUFFALO, NY- March 11, 2024 – Impact Journals publishes scholarly journals in the biomedical sciences with a focus on all areas of cancer and aging research. Aging is one of the most prominent journals published by Impact Journals.
Impact Journals will be participating as an exhibitor at the American Association for Cancer Research (AACR) Annual Meeting 2024 from April 5-10 at the San Diego Convention Center in San Diego, California. This year, the AACR meeting theme is “Inspiring Science • Fueling Progress • Revolutionizing Care.”
Visit booth #4159 at the AACR Annual Meeting 2024 to connect with members of the Agingteam.
About Aging-US:
Agingpublishes research papers in all fields of aging research including but not limited, aging from yeast to mammals, cellular senescence, age-related diseases such as cancer and Alzheimer’s diseases and their prevention and treatment, anti-aging strategies and drug development and especially the role of signal transduction pathways such as mTOR in aging and potential approaches to modulate these signaling pathways to extend lifespan. The journal aims to promote treatment of age-related diseases by slowing down aging, validation of anti-aging drugs by treating age-related diseases, prevention of cancer by inhibiting aging. Cancer and COVID-19 are age-related diseases.
Agingis indexed and archived byPubMed/Medline (abbreviated as “Aging (Albany NY)”), PubMed Central, Web of Science: Science Citation Index Expanded (abbreviated as “Aging‐US” and listed in the Cell Biology and Geriatrics & Gerontology categories), Scopus (abbreviated as “Aging” and listed in the Cell Biology and Aging categories), Biological Abstracts, BIOSIS Previews, EMBASE, META (Chan Zuckerberg Initiative) (2018-2022), and Dimensions (Digital Science).
Please visit our website at www.Aging-US.com and connect with us:
NY Fed Finds Medium, Long-Term Inflation Expectations Jump Amid Surge In Stock Market Optimism
One month after the inflation outlook tracked by the NY Fed Consumer Survey extended their late 2023 slide, with 3Y inflation expectations in January sliding to a record low 2.4% (from 2.6% in December), even as 1 and 5Y inflation forecasts remained flat, moments ago the NY Fed reported that in February there was a sharp rebound in longer-term inflation expectations, rising to 2.7% from 2.4% at the three-year ahead horizon, and jumping to 2.9% from 2.5% at the five-year ahead horizon, while the 1Y inflation outlook was flat for the 3rd month in a row, stuck at 3.0%.
The increases in both the three-year ahead and five-year ahead measures were most pronounced for respondents with at most high school degrees (in other words, the "really smart folks" are expecting deflation soon). The survey’s measure of disagreement across respondents (the difference between the 75th and 25th percentile of inflation expectations) decreased at all horizons, while the median inflation uncertainty—or the uncertainty expressed regarding future inflation outcomes—declined at the one- and three-year ahead horizons and remained unchanged at the five-year ahead horizon.
Going down the survey, we find that the median year-ahead expected price changes increased by 0.1 percentage point to 4.3% for gas; decreased by 1.8 percentage points to 6.8% for the cost of medical care (its lowest reading since September 2020); decreased by 0.1 percentage point to 5.8% for the cost of a college education; and surprisingly decreased by 0.3 percentage point for rent to 6.1% (its lowest reading since December 2020), and remained flat for food at 4.9%.
We find the rent expectations surprising because it is happening just asking rents are rising across the country.
At the same time as consumers erroneously saw sharply lower rents, median home price growth expectations remained unchanged for the fifth consecutive month at 3.0%.
Turning to the labor market, the survey found that the average perceived likelihood of voluntary and involuntary job separations increased, while the perceived likelihood of finding a job (in the event of a job loss) declined. "The mean probability of leaving one’s job voluntarily in the next 12 months also increased, by 1.8 percentage points to 19.5%."
Mean unemployment expectations - or the mean probability that the U.S. unemployment rate will be higher one year from now - decreased by 1.1 percentage points to 36.1%, the lowest reading since February 2022. Additionally, the median one-year-ahead expected earnings growth was unchanged at 2.8%, remaining slightly below its 12-month trailing average of 2.9%.
Turning to household finance, we find the following:
The median expected growth in household income remained unchanged at 3.1%. The series has been moving within a narrow range of 2.9% to 3.3% since January 2023, and remains above the February 2020 pre-pandemic level of 2.7%.
Median household spending growth expectations increased by 0.2 percentage point to 5.2%. The increase was driven by respondents with a high school degree or less.
Median year-ahead expected growth in government debt increased to 9.3% from 8.9%.
The mean perceived probability that the average interest rate on saving accounts will be higher in 12 months increased by 0.6 percentage point to 26.1%, remaining below its 12-month trailing average of 30%.
Perceptions about households’ current financial situations deteriorated somewhat with fewer respondents reporting being better off than a year ago. Year-ahead expectations also deteriorated marginally with a smaller share of respondents expecting to be better off and a slightly larger share of respondents expecting to be worse off a year from now.
The mean perceived probability that U.S. stock prices will be higher 12 months from now increased by 1.4 percentage point to 38.9%.
At the same time, perceptions and expectations about credit access turned less optimistic: "Perceptions of credit access compared to a year ago deteriorated with a larger share of respondents reporting tighter conditions and a smaller share reporting looser conditions compared to a year ago."
Also, a smaller percentage of consumers, 11.45% vs 12.14% in prior month, expect to not be able to make minimum debt payment over the next three months
Last, and perhaps most humorous, is the now traditional cognitive dissonance one observes with these polls, because at a time when long-term inflation expectations jumped, which clearly suggests that financial conditions will need to be tightened, the number of respondents expecting higher stock prices one year from today jumped to the highest since November 2021... which incidentally is just when the market topped out during the last cycle before suffering a painful bear market.
Homes listed for sale in early June sell for $7,700 more
New Zillow research suggests the spring home shopping season may see a second wave this summer if mortgage rates fall
The post Homes listed for sale in…
A Zillow analysis of 2023 home sales finds homes listed in the first two weeks of June sold for 2.3% more.
The best time to list a home for sale is a month later than it was in 2019, likely driven by mortgage rates.
The best time to list can be as early as the second half of February in San Francisco, and as late as the first half of July in New York and Philadelphia.
Spring home sellers looking to maximize their sale price may want to wait it out and list their home for sale in the first half of June. A new Zillow® analysis of 2023 sales found that homes listed in the first two weeks of June sold for 2.3% more, a $7,700 boost on a typical U.S. home.
The best time to list consistently had been early May in the years leading up to the pandemic. The shift to June suggests mortgage rates are strongly influencing demand on top of the usual seasonality that brings buyers to the market in the spring. This home-shopping season is poised to follow a similar pattern as that in 2023, with the potential for a second wave if the Federal Reserve lowers interest rates midyear or later.
The 2.3% sale price premium registered last June followed the first spring in more than 15 years with mortgage rates over 6% on a 30-year fixed-rate loan. The high rates put home buyers on the back foot, and as rates continued upward through May, they were still reassessing and less likely to bid boldly. In June, however, rates pulled back a little from 6.79% to 6.67%, which likely presented an opportunity for determined buyers heading into summer. More buyers understood their market position and could afford to transact, boosting competition and sale prices.
The old logic was that sellers could earn a premium by listing in late spring, when search activity hit its peak. Now, with persistently low inventory, mortgage rate fluctuations make their own seasonality. First-time home buyers who are on the edge of qualifying for a home loan may dip in and out of the market, depending on what’s happening with rates. It is almost certain the Federal Reserve will push back any interest-rate cuts to mid-2024 at the earliest. If mortgage rates follow, that could bring another surge of buyers later this year.
Mortgage rates have been impacting affordability and sale prices since they began rising rapidly two years ago. In 2022, sellers nationwide saw the highest sale premium when they listed their home in late March, right before rates barreled past 5% and continued climbing.
Zillow’s research finds the best time to list can vary widely by metropolitan area. In 2023, it was as early as the second half of February in San Francisco, and as late as the first half of July in New York. Thirty of the top 35 largest metro areas saw for-sale listings command the highest sale prices between May and early July last year.
Zillow also found a wide range in the sale price premiums associated with homes listed during those peak periods. At the hottest time of the year in San Jose, homes sold for 5.5% more, a $88,000 boost on a typical home. Meanwhile, homes in San Antonio sold for 1.9% more during that same time period.
We use cookies on our website to give you the most relevant experience by remembering your preferences and repeat visits. By clicking “Accept”, you consent to the use of ALL the cookies.
This website uses cookies to improve your experience while you navigate through the website. Out of these, the cookies that are categorized as necessary are stored on your browser as they are essential for the working of basic functionalities of the website. We also use third-party cookies that help us analyze and understand how you use this website. These cookies will be stored in your browser only with your consent. You also have the option to opt-out of these cookies. But opting out of some of these cookies may affect your browsing experience.
Necessary cookies are absolutely essential for the website to function properly. These cookies ensure basic functionalities and security features of the website, anonymously.
Cookie
Duration
Description
cookielawinfo-checbox-analytics
11 months
This cookie is set by GDPR Cookie Consent plugin. The cookie is used to store the user consent for the cookies in the category "Analytics".
cookielawinfo-checbox-functional
11 months
The cookie is set by GDPR cookie consent to record the user consent for the cookies in the category "Functional".
cookielawinfo-checbox-others
11 months
This cookie is set by GDPR Cookie Consent plugin. The cookie is used to store the user consent for the cookies in the category "Other.
cookielawinfo-checkbox-necessary
11 months
This cookie is set by GDPR Cookie Consent plugin. The cookies is used to store the user consent for the cookies in the category "Necessary".
cookielawinfo-checkbox-performance
11 months
This cookie is set by GDPR Cookie Consent plugin. The cookie is used to store the user consent for the cookies in the category "Performance".
viewed_cookie_policy
11 months
The cookie is set by the GDPR Cookie Consent plugin and is used to store whether or not user has consented to the use of cookies. It does not store any personal data.
Functional cookies help to perform certain functionalities like sharing the content of the website on social media platforms, collect feedbacks, and other third-party features.
Performance cookies are used to understand and analyze the key performance indexes of the website which helps in delivering a better user experience for the visitors.
Analytical cookies are used to understand how visitors interact with the website. These cookies help provide information on metrics the number of visitors, bounce rate, traffic source, etc.
Advertisement cookies are used to provide visitors with relevant ads and marketing campaigns. These cookies track visitors across websites and collect information to provide customized ads.


