Uncategorized
Home equity lending market 2023-2027: A descriptive analysis of five forces model, market dynamics, and segmentation – Technavio
Home equity lending market 2023-2027: A descriptive analysis of five forces model, market dynamics, and segmentation – Technavio
PR Newswire
NEW YORK, Jan. 17, 2023
NEW YORK, Jan. 17, 2023 /PRNewswire/ — According to Technavio, the global home equ…
Share this:

Home equity lending market 2023-2027: A descriptive analysis of five forces model, market dynamics, and segmentation - Technavio
PR Newswire
NEW YORK, Jan. 17, 2023
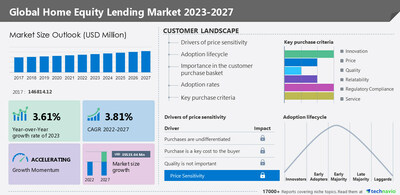
NEW YORK, Jan. 17, 2023 /PRNewswire/ -- According to Technavio, the global home equity lending market size is estimated to grow by USD 35,535.04 million from 2022 to 2027. The market is estimated to grow at a CAGR of 3.81% during the forecast period. Moreover, the growth momentum will accelerate. North America will account for 37% of the growth of the global market during the forecast period.
For more insights on market size, request a sample report
Global home equity lending market - Five forces
The global home equity lending market is fragmented, and the five forces analysis covers –
- Bargaining power of buyers
- The threat of new entrants
- Threat of rivalry
- Bargaining power of suppliers
- Threat of substitutes
- For an interpretation of Porter's five forces model – buy the report!
Global home equity lending market – Customer landscape
The report includes the market's adoption lifecycle, from the innovator's stage to the laggard's stage. It focuses on adoption rates in different regions based on penetration. Furthermore, the report also includes key purchase criteria and drivers of price sensitivity to help companies evaluate and develop their growth strategies.
Global home equity lending market - Segmentation assessment
Segment overview
Technavio has segmented the market based on distribution channel (offline and online) and source (mortgage and credit union, commercial banks, and others).
- The mortgage and credit union segment will grow at a significant rate during the forecast period. Mortgage and credit union are preferred for home equity lending. Consumers need a reliable lender for home equity lending to prevent scams and get a reasonable rate. Mortgage and credit unions provide many services. Apart from offering consumer loans, credit unions accept deposits, manage checking and savings accounts, dispense credit and debit cards, and provide house loans. Credit unions provide some of the lowest rates on credit products, such as mortgages. They also provide fee-free checking accounts and savings accounts without a high minimum balance. Such factors will contribute to the segment's growth during the forecast period leading to market growth.
Geography overview
Based on geography, the global home equity lending market is segmented into North America, Europe, APAC, South America, and Middle East and Africa. The report provides actionable insights and estimates the contribution of all regions to the growth of the global home equity lending market.
- North America is estimated to account for 37% of the growth of the global market during the forecast period. Banks and credit unions have significant growth opportunities in home equity loans and lines of credit (HELOC) due to a significant rise in home prices. In Canada, many people use homes as collateral for loans owing to the rising real estate values and fewer regulations. According to the Federal Housing Finance Agency (FHFA) house price index data, between Q1 2021 and Q1 2022, home prices in the US rose by 18%. Such factors will fuel the growth of the home equity lending market in the region during the forecast period.
Global home equity lending market – Market dynamics
Key factor driving market growth
- The massive increase in home prices is driving the market growth.
- Luxembourg, Turkey, New Zealand, and Canada are some of the countries that have witnessed the highest increase.
- With the rise in property prices, homeowners will be able to access the reserve as they become more equity rich.
- The property price rise will provide a large enough margin to get a loan against it. This is because home equity loans are secured as the market value of the property increases.
- Thus, homeowners are expected to use more home equity loans during the forecast period, which will lead to the growth of the market.
Leading trends influencing the market
- An increase in residential properties is a key trend in the market.
- Residential infrastructure development is driven by factors such as the rising population, the growing need for decent housing and infrastructure, and the increasing number of nuclear families are aiding.
- The housing sector has witnessed significant expansion in recent years owing to the increased need for residential and commercial areas.
- Moreover, the rise in acceptance of remote work has encouraged home buyers to opt for bigger homes, which has increased the demand for housing.
- Such factors will support the growth of the global home equity lending market during the forecast period.
Major challenges hindering market growth
- Fear of losing property is challenging the market growth.
- Factors such as the time frame of the mortgage loan process, which range from two weeks to two months, affect the timeline.
- The lender verifies copies of the consumer's current mortgage statement, property tax bill, and proof of income. The process may take longer if the copies are not readily available.
- In addition, the lender checks the consumer's credit scores, debt-to-income (DTI), and other financial information.
- The lender also hires an approved third-party appraiser to confirm the value of the consumer's home. This process may take longer than expected if the reviewer is busy.
- Such factors may impede the growth of the global mortgage market during the forecast period.
What are the key data covered in this home equity lending market report?
- CAGR of the market during the forecast period
- Detailed information on factors that will drive the growth of the home equity lending market between 2023 and 2027
- Precise estimation of the size of the home equity lending market and its contribution to the parent market
- Accurate predictions about upcoming trends and changes in consumer behavior
- Growth of the home equity lending market across North America, Europe, APAC, South America, and Middle East and Africa
- A thorough analysis of the market's competitive landscape and detailed information about vendors
- Comprehensive analysis of factors that will challenge the growth of home equity lending market vendors
Gain instant access to 17,000+ market research reports.
Technavio's SUBSCRIPTION platform
Related Reports:
The homeowners insurance market is estimated to grow at a CAGR of 4.18% between 2022 and 2027. The size of the market is forecasted to increase by USD 57.01 billion. This report extensively covers market segmentation by type (fire and theft, house damage, floods and earthquake, and others), source (captive, independent agent, and direct response), and geography (North America, Europe, APAC, South America, and Middle East and Africa).
The home services market size is expected to increase by USD 5.14 trillion from 2021 to 2026, and the market's growth momentum will accelerate at a CAGR of 36.21%. This report extensively covers segmentation by type (home care and design, repair and maintenance, HWB, and others) and geography (APAC, North America, Europe, South America, and Middle East and Africa).
Home Equity Lending Market Scope | |
Report Coverage | Details |
Page number | 150 |
Base year | 2022 |
Historic period | 2017-2021 |
Forecast period | 2023-2027 |
Growth momentum & CAGR | Accelerate at a CAGR of 3.81% |
Market growth 2023-2027 | USD 35,535.04 million |
Market structure | Fragmented |
YoY growth 2022-2023 (%) | 3.61 |
Regional analysis | North America, Europe, APAC, South America, and Middle East and Africa |
Performing market contribution | North America at 37% |
Key countries | US, China, Japan, Germany, and France |
Competitive landscape | Leading vendors, market positioning of vendors, competitive strategies, and industry risks |
Key companies profiled | A&A Dukaan Financial Services Pvt. Ltd., ABC Finance Ltd., Australia and New Zealand Banking Group Ltd., Bank of America Corp., Barclays PLC, Citizens Commerce Bancshares Inc., Commonwealth Bank of Australia, Flagstar Bancorp Inc., HSBC Holdings Plc, JPMorgan Chase and Co., Morgan Stanley, Navy Federal Credit Union, nbkc bank, Pentagon Federal Credit Union, Police and Nurses Ltd., Regions Financial Corp., State Bank of India, The Goldman Sachs Group Inc., The PNC Financial Services Group Inc., and U.S. Bancorp |
Market dynamics | Parent market analysis, market growth inducers and obstacles, fast-growing and slow-growing segment analysis, COVID-19 impact and recovery analysis and future consumer dynamics, and market condition analysis for forecast period. |
Customization purview | If our report has not included the data that you are looking for, you can reach out to our analysts and get segments customized. |
Customization purview | If our report has not included the data that you are looking for, you can reach out to our analysts and get segments customized. |
Browse for Technavio's consumer discretionary market reports
Table of contents
1 Executive Summary
- 1.1 Market overview
- Exhibit 01: Executive Summary – Chart on Market Overview
- Exhibit 02: Executive Summary – Data Table on Market Overview
- Exhibit 03: Executive Summary – Chart on Global Market Characteristics
- Exhibit 04: Executive Summary – Chart on Market by Geography
- Exhibit 05: Executive Summary – Chart on Market Segmentation by Source
- Exhibit 06: Executive Summary – Chart on Market Segmentation by Distribution Channel
- Exhibit 07: Executive Summary – Chart on Incremental Growth
- Exhibit 08: Executive Summary – Data Table on Incremental Growth
- Exhibit 09: Executive Summary – Chart on Vendor Market Positioning
2 Market Landscape
- 2.1 Market ecosystem
- Exhibit 10: Parent market
- Exhibit 11: Market Characteristics
3 Market Sizing
- 3.1 Market definition
- Exhibit 12: Offerings of vendors included in the market definition
- 3.2 Market segment analysis
- Exhibit 13: Market segments
- 3.3 Market size 2022
- 3.4 Market outlook: Forecast for 2022-2027
- Exhibit 14: Chart on Global - Market size and forecast 2022-2027 ($ million)
- Exhibit 15: Data Table on Global - Market size and forecast 2022-2027 ($ million)
- Exhibit 16: Chart on Global Market: Year-over-year growth 2022-2027 (%)
- Exhibit 17: Data Table on Global Market: Year-over-year growth 2022-2027 (%)
4 Historic Market Size
- 4.1 Global home equity lending market 2017 - 2021
- Exhibit 18: Historic Market Size – Data Table on Global home equity lending market 2017 - 2021 ($ million)
- 4.2 Source Segment Analysis 2017 - 2021
- Exhibit 19: Historic Market Size – Source Segment 2017 - 2021 ($ million)
- 4.3 Distribution channel Segment Analysis 2017 - 2021
- Exhibit 20: Historic Market Size – Distribution channel Segment 2017 - 2021 ($ million)
- 4.4 Geography Segment Analysis 2017 - 2021
- Exhibit 21: Historic Market Size – Geography Segment 2017 - 2021 ($ million)
- 4.5 Country Segment Analysis 2017 - 2021
- Exhibit 22: Historic Market Size – Country Segment 2017 - 2021 ($ million)
5 Five Forces Analysis
- 5.1 Five forces summary
- Exhibit 23: Five forces analysis - Comparison between 2022 and 2027
- 5.2 Bargaining power of buyers
- Exhibit 24: Chart on Bargaining power of buyers – Impact of key factors 2022 and 2027
- 5.3 Bargaining power of suppliers
- Exhibit 25: Bargaining power of suppliers – Impact of key factors in 2022 and 2027
- 5.4 Threat of new entrants
- Exhibit 26: Threat of new entrants – Impact of key factors in 2022 and 2027
- 5.5 Threat of substitutes
- Exhibit 27: Threat of substitutes – Impact of key factors in 2022 and 2027
- 5.6 Threat of rivalry
- Exhibit 28: Threat of rivalry – Impact of key factors in 2022 and 2027
- 5.7 Market condition
- Exhibit 29: Chart on Market condition - Five forces 2022 and 2027
6 Market Segmentation by Source
- 6.1 Market segments
- Exhibit 30: Chart on Source - Market share 2022-2027 (%)
- Exhibit 31: Data Table on Source - Market share 2022-2027 (%)
- 6.2 Comparison by Source
- Exhibit 32: Chart on Comparison by Source
- Exhibit 33: Data Table on Comparison by Source
- 6.3 Mortgage and credit union - Market size and forecast 2022-2027
- Exhibit 34: Chart on Mortgage and credit union - Market size and forecast 2022-2027 ($ million)
- Exhibit 35: Data Table on Mortgage and credit union - Market size and forecast 2022-2027 ($ million)
- Exhibit 36: Chart on Mortgage and credit union - Year-over-year growth 2022-2027 (%)
- Exhibit 37: Data Table on Mortgage and credit union - Year-over-year growth 2022-2027 (%)
- 6.4 Commercial banks - Market size and forecast 2022-2027
- Exhibit 38: Chart on Commercial banks - Market size and forecast 2022-2027 ($ million)
- Exhibit 39: Data Table on Commercial banks - Market size and forecast 2022-2027 ($ million)
- Exhibit 40: Chart on Commercial banks - Year-over-year growth 2022-2027 (%)
- Exhibit 41: Data Table on Commercial banks - Year-over-year growth 2022-2027 (%)
- 6.5 Others - Market size and forecast 2022-2027
- Exhibit 42: Chart on Others - Market size and forecast 2022-2027 ($ million)
- Exhibit 43: Data Table on Others - Market size and forecast 2022-2027 ($ million)
- Exhibit 44: Chart on Others - Year-over-year growth 2022-2027 (%)
- Exhibit 45: Data Table on Others - Year-over-year growth 2022-2027 (%)
- 6.6 Market opportunity by Source
- Exhibit 46: Market opportunity by Source ($ million)
7 Market Segmentation by Distribution Channel
- 7.1 Market segments
- Exhibit 47: Chart on Distribution Channel - Market share 2022-2027 (%)
- Exhibit 48: Data Table on Distribution Channel - Market share 2022-2027 (%)
- 7.2 Comparison by Distribution Channel
- Exhibit 49: Chart on Comparison by Distribution Channel
- Exhibit 50: Data Table on Comparison by Distribution Channel
- 7.3 Offline - Market size and forecast 2022-2027
- Exhibit 51: Chart on Offline - Market size and forecast 2022-2027 ($ million)
- Exhibit 52: Data Table on Offline - Market size and forecast 2022-2027 ($ million)
- Exhibit 53: Chart on Offline - Year-over-year growth 2022-2027 (%)
- Exhibit 54: Data Table on Offline - Year-over-year growth 2022-2027 (%)
- 7.4 Online - Market size and forecast 2022-2027
- Exhibit 55: Chart on Online - Market size and forecast 2022-2027 ($ million)
- Exhibit 56: Data Table on Online - Market size and forecast 2022-2027 ($ million)
- Exhibit 57: Chart on Online - Year-over-year growth 2022-2027 (%)
- Exhibit 58: Data Table on Online - Year-over-year growth 2022-2027 (%)
- 7.5 Market opportunity by Distribution Channel
- Exhibit 59: Market opportunity by Distribution Channel ($ million)
8 Customer Landscape
- 8.1 Customer landscape overview
- Exhibit 60: Analysis of price sensitivity, lifecycle, customer purchase basket, adoption rates, and purchase criteria
9 Geographic Landscape
- 9.1 Geographic segmentation
- Exhibit 61: Chart on Market share by geography 2022-2027 (%)
- Exhibit 62: Data Table on Market share by geography 2022-2027 (%)
- 9.2 Geographic comparison
- Exhibit 63: Chart on Geographic comparison
- Exhibit 64: Data Table on Geographic comparison
- 9.3 North America - Market size and forecast 2022-2027
- Exhibit 65: Chart on North America - Market size and forecast 2022-2027 ($ million)
- Exhibit 66: Data Table on North America - Market size and forecast 2022-2027 ($ million)
- Exhibit 67: Chart on North America - Year-over-year growth 2022-2027 (%)
- Exhibit 68: Data Table on North America - Year-over-year growth 2022-2027 (%)
- 9.4 Europe - Market size and forecast 2022-2027
- Exhibit 69: Chart on Europe - Market size and forecast 2022-2027 ($ million)
- Exhibit 70: Data Table on Europe - Market size and forecast 2022-2027 ($ million)
- Exhibit 71: Chart on Europe - Year-over-year growth 2022-2027 (%)
- Exhibit 72: Data Table on Europe - Year-over-year growth 2022-2027 (%)
- 9.5 APAC - Market size and forecast 2022-2027
- Exhibit 73: Chart on APAC - Market size and forecast 2022-2027 ($ million)
- Exhibit 74: Data Table on APAC - Market size and forecast 2022-2027 ($ million)
- Exhibit 75: Chart on APAC - Year-over-year growth 2022-2027 (%)
- Exhibit 76: Data Table on APAC - Year-over-year growth 2022-2027 (%)
- 9.6 South America - Market size and forecast 2022-2027
- Exhibit 77: Chart on South America - Market size and forecast 2022-2027 ($ million)
- Exhibit 78: Data Table on South America - Market size and forecast 2022-2027 ($ million)
- Exhibit 79: Chart on South America - Year-over-year growth 2022-2027 (%)
- Exhibit 80: Data Table on South America - Year-over-year growth 2022-2027 (%)
- 9.7 Middle East and Africa - Market size and forecast 2022-2027
- Exhibit 81: Chart on Middle East and Africa - Market size and forecast 2022-2027 ($ million)
- Exhibit 82: Data Table on Middle East and Africa - Market size and forecast 2022-2027 ($ million)
- Exhibit 83: Chart on Middle East and Africa - Year-over-year growth 2022-2027 (%)
- Exhibit 84: Data Table on Middle East and Africa - Year-over-year growth 2022-2027 (%)
- 9.8 US - Market size and forecast 2022-2027
- Exhibit 85: Chart on US - Market size and forecast 2022-2027 ($ million)
- Exhibit 86: Data Table on US - Market size and forecast 2022-2027 ($ million)
- Exhibit 87: Chart on US - Year-over-year growth 2022-2027 (%)
- Exhibit 88: Data Table on US - Year-over-year growth 2022-2027 (%)
- 9.9 China - Market size and forecast 2022-2027
- Exhibit 89: Chart on China - Market size and forecast 2022-2027 ($ million)
- Exhibit 90: Data Table on China - Market size and forecast 2022-2027 ($ million)
- Exhibit 91: Chart on China - Year-over-year growth 2022-2027 (%)
- Exhibit 92: Data Table on China - Year-over-year growth 2022-2027 (%)
- 9.10 Japan - Market size and forecast 2022-2027
- Exhibit 93: Chart on Japan - Market size and forecast 2022-2027 ($ million)
- Exhibit 94: Data Table on Japan - Market size and forecast 2022-2027 ($ million)
- Exhibit 95: Chart on Japan - Year-over-year growth 2022-2027 (%)
- Exhibit 96: Data Table on Japan - Year-over-year growth 2022-2027 (%)
- 9.11 Germany - Market size and forecast 2022-2027
- Exhibit 97: Chart on Germany - Market size and forecast 2022-2027 ($ million)
- Exhibit 98: Data Table on Germany - Market size and forecast 2022-2027 ($ million)
- Exhibit 99: Chart on Germany - Year-over-year growth 2022-2027 (%)
- Exhibit 100: Data Table on Germany - Year-over-year growth 2022-2027 (%)
- 9.12 France - Market size and forecast 2022-2027
- Exhibit 101: Chart on France - Market size and forecast 2022-2027 ($ million)
- Exhibit 102: Data Table on France - Market size and forecast 2022-2027 ($ million)
- Exhibit 103: Chart on France - Year-over-year growth 2022-2027 (%)
- Exhibit 104: Data Table on France - Year-over-year growth 2022-2027 (%)
- 9.13 Market opportunity by geography
- Exhibit 105: Market opportunity by geography ($ million)
10 Drivers, Challenges, and Trends
- 10.1 Market drivers
- 10.2 Market challenges
- 10.3 Impact of drivers and challenges
- Exhibit 106: Impact of drivers and challenges in 2022 and 2027
- 10.4 Market trends
11 Vendor Landscape
- 11.1 Overview
- 11.2 Vendor landscape
- Exhibit 107: Overview on Criticality of inputs and Factors of differentiation
- 11.3 Landscape disruption
- Exhibit 108: Overview on factors of disruption
- 11.4 Industry risks
- Exhibit 109: Impact of key risks on business
12 Vendor Analysis
- 12.1 Vendors covered
- Exhibit 110: Vendors covered
- 12.2 Market positioning of vendors
- Exhibit 111: Matrix on vendor position and classification
- 12.3 A&A Dukaan Financial Services Pvt. Ltd.
- Exhibit 112: A&A Dukaan Financial Services Pvt. Ltd. - Overview
- Exhibit 113: A&A Dukaan Financial Services Pvt. Ltd. - Product / Service
- Exhibit 114: A&A Dukaan Financial Services Pvt. Ltd. - Key offerings
- 12.4 ABC Finance Ltd.
- Exhibit 115: ABC Finance Ltd. - Overview
- Exhibit 116: ABC Finance Ltd. - Product / Service
- Exhibit 117: ABC Finance Ltd. - Key offerings
- 12.5 Bank of America Corp.
- Exhibit 118: Bank of America Corp. - Overview
- Exhibit 119: Bank of America Corp. - Business segments
- Exhibit 120: Bank of America Corp. - Key news
- Exhibit 121: Bank of America Corp. - Key offerings
- Exhibit 122: Bank of America Corp. - Segment focus
- 12.6 Citizens Commerce Bancshares Inc.
- Exhibit 123: Citizens Commerce Bancshares Inc. - Overview
- Exhibit 124: Citizens Commerce Bancshares Inc. - Product / Service
- Exhibit 125: Citizens Commerce Bancshares Inc. - Key offerings
- 12.7 Flagstar Bancorp Inc.
- Exhibit 126: Flagstar Bancorp Inc. - Overview
- Exhibit 127: Flagstar Bancorp Inc. - Business segments
- Exhibit 128: Flagstar Bancorp Inc. - Key offerings
- Exhibit 129: Flagstar Bancorp Inc. - Segment focus
- 12.8 JPMorgan Chase and Co.
- Exhibit 130: JPMorgan Chase and Co. - Overview
- Exhibit 131: JPMorgan Chase and Co. - Business segments
- Exhibit 132: JPMorgan Chase and Co. - Key offerings
- Exhibit 133: JPMorgan Chase and Co. - Segment focus
- 12.9 Morgan Stanley
- Exhibit 134: Morgan Stanley - Overview
- Exhibit 135: Morgan Stanley - Business segments
- Exhibit 136: Morgan Stanley - Key offerings
- Exhibit 137: Morgan Stanley - Segment focus
- 12.10 Navy Federal Credit Union
- Exhibit 138: Navy Federal Credit Union - Overview
- Exhibit 139: Navy Federal Credit Union - Product / Service
- Exhibit 140: Navy Federal Credit Union - Key offerings
- 12.11 nbkc bank
- Exhibit 141: nbkc bank - Overview
- Exhibit 142: nbkc bank - Product / Service
- Exhibit 143: nbkc bank - Key offerings
- 12.12 Pentagon Federal Credit Union
- Exhibit 144: Pentagon Federal Credit Union - Overview
- Exhibit 145: Pentagon Federal Credit Union - Product / Service
- Exhibit 146: Pentagon Federal Credit Union - Key offerings
- 12.13 Regions Financial Corp.
- Exhibit 147: Regions Financial Corp. - Overview
- Exhibit 148: Regions Financial Corp. - Business segments
- Exhibit 149: Regions Financial Corp. - Key offerings
- Exhibit 150: Regions Financial Corp. - Segment focus
- 12.14 State Bank of India
- Exhibit 151: State Bank of India - Overview
- Exhibit 152: State Bank of India - Business segments
- Exhibit 153: State Bank of India - Key offerings
- Exhibit 154: State Bank of India - Segment focus
- 12.15 The Goldman Sachs Group Inc.
- Exhibit 155: The Goldman Sachs Group Inc. - Overview
- Exhibit 156: The Goldman Sachs Group Inc. - Business segments
- Exhibit 157: The Goldman Sachs Group Inc. - Key news
- Exhibit 158: The Goldman Sachs Group Inc. - Key offerings
- Exhibit 159: The Goldman Sachs Group Inc. - Segment focus
- 12.16 The PNC Financial Services Group Inc.
- Exhibit 160: The PNC Financial Services Group Inc. - Overview
- Exhibit 161: The PNC Financial Services Group Inc. - Business segments
- Exhibit 162: The PNC Financial Services Group Inc. - Key offerings
- Exhibit 163: The PNC Financial Services Group Inc. - Segment focus
- 12.17 U.S. Bancorp
- Exhibit 164: U.S. Bancorp - Overview
- Exhibit 165: U.S. Bancorp - Business segments
- Exhibit 166: U.S. Bancorp - Key offerings
- Exhibit 167: U.S. Bancorp - Segment focus
13 Appendix
- 13.1 Scope of the report
- 13.2 Inclusions and exclusions checklist
- Exhibit 168: Inclusions checklist
- Exhibit 169: Exclusions checklist
- 13.3 Currency conversion rates for US$
- Exhibit 170: Currency conversion rates for US$
- 13.4 Research methodology
- Exhibit 171: Research methodology
- Exhibit 172: Validation techniques employed for market sizing
- Exhibit 173: Information sources
- 13.5 List of abbreviations
- Exhibit 174: List of abbreviations
About Us
Technavio is a leading global technology research and advisory company. Their research and analysis focus on emerging market trends and provide actionable insights to help businesses identify market opportunities and develop effective strategies to optimize their market positions. With over 500 specialized analysts, Technavio's report library consists of more than 17,000 reports and counting, covering 800 technologies, spanning across 50 countries. Their client base consists of enterprises of all sizes, including more than 100 Fortune 500 companies. This growing client base relies on Technavio's comprehensive coverage, extensive research, and actionable market insights to identify opportunities in existing and potential markets and assess their competitive positions within changing market scenarios.
Contact
Technavio Research
Jesse Maida
Media & Marketing Executive
US: +1 844 364 1100
UK: +44 203 893 3200
Email: media@technavio.com
Website: www.technavio.com/

View original content to download multimedia:https://www.prnewswire.com/news-releases/home-equity-lending-market-2023-2027-a-descriptive-analysis-of-five-forces-model-market-dynamics-and-segmentation---technavio-301721144.html
SOURCE Technavio
Uncategorized
One more airline cracks down on lounge crowding in a way you won’t like
Qantas Airways is increasing the price of accessing its network of lounges by as much as 17%.
Share this:


Over the last two years, multiple airlines have dealt with crowding in their lounges. While they are designed as a luxury experience for a small subset of travelers, high numbers of people taking a trip post-pandemic as well as the different ways they are able to gain access through status or certain credit cards made it difficult for some airlines to keep up with keeping foods stocked, common areas clean and having enough staff to serve bar drinks at the rate that customers expect them.
In the fall of 2023, Delta Air Lines (DAL) caught serious traveler outcry after announcing that it was cracking down on crowding by raising how much one needs to spend for lounge access and limiting the number of times one can enter those lounges.
Related: Competitors pushed Delta to backtrack on its lounge and loyalty program changes
Some airlines saw the outcry with Delta as their chance to reassure customers that they would not raise their fees while others waited for the storm to pass to quietly implement their own increases.
Shutterstock
This is how much more you'll have to pay for Qantas lounge access
Australia's flagship carrier Qantas Airways (QUBSF) is the latest airline to announce that it would raise the cost accessing the 24 lounges across the country as well as the 600 international lounges available at airports across the world through partner airlines.
More Travel:
- A new travel term is taking over the internet (and reaching airlines and hotels)
- The 10 best airline stocks to buy now
- Airlines see a new kind of traveler at the front of the plane
Unlike other airlines which grant access primarily after reaching frequent flyer status, Qantas also sells it through a membership — starting from April 18, 2024, prices will rise from $600 Australian dollars ($392 USD) to $699 AUD ($456 USD) for one year, $1,100 ($718 USD) to $1,299 ($848 USD) for two years and $2,000 AUD ($1,304) to lock in the rate for four years.
Those signing up for lounge access for the first time also currently pay a joining fee of $99 AUD ($65 USD) that will rise to $129 AUD ($85 USD).
The airline also allows customers to purchase their membership with Qantas Points they collect through frequent travel; the membership fees are also being raised by the equivalent amount in points in what adds up to as much as 17% — from 308,000 to 399,900 to lock in access for four years.
Airline says hikes will 'cover cost increases passed on from suppliers'
"This is the first time the Qantas Club membership fees have increased in seven years and will help cover cost increases passed on from a range of suppliers over that time," a Qantas spokesperson confirmed to Simple Flying. "This follows a reduction in the membership fees for several years during the pandemic."
The spokesperson said the gains from the increases will go both towards making up for inflation-related costs and keeping existing lounges looking modern by updating features like furniture and décor.
While the price increases also do not apply for those who earned lounge access through frequent flyer status or change what it takes to earn that status, Qantas is also introducing even steeper increases for those renewing a membership or adding additional features such as spouse and partner memberships.
In some cases, the cost of these features will nearly double from what members are paying now.
stocks pandemicUncategorized
Star Wars icon gives his support to Disney, Bob Iger
Disney shareholders have a huge decision to make on April 3.
Share this:

Disney's (DIS) been facing some headwinds up top, but its leadership just got backing from one of the company's more prominent investors.
Star Wars creator George Lucas put out of statement in support of the company's current leadership team, led by CEO Bob Iger, ahead of the April 3 shareholders meeting which will see investors vote on the company's 12-member board.
"Creating magic is not for amateurs," Lucas said in a statement. "When I sold Lucasfilm just over a decade ago, I was delighted to become a Disney shareholder because of my long-time admiration for its iconic brand and Bob Iger’s leadership. When Bob recently returned to the company during a difficult time, I was relieved. No one knows Disney better. I remain a significant shareholder because I have full faith and confidence in the power of Disney and Bob’s track record of driving long-term value. I have voted all of my shares for Disney’s 12 directors and urge other shareholders to do the same."
Related: Disney stands against Nelson Peltz as leadership succession plan heats up
Lucasfilm was acquired by Disney for $4 billion in 2012 — notably under the first term of Iger. He received over 37 million in shares of Disney during the acquisition.
Lucas' statement seems to be an attempt to push investors away from the criticism coming from The Trian Partners investment group, led by Nelson Peltz. The group, owns about $3 million in shares of the media giant, is pushing two candidates for positions on the board, which are Peltz and former Disney CFO Jay Rasulo.
Peltz and Co. have called out a pair of Disney directors — Michael Froman and Maria Elena Lagomasino — for their lack of experience in the media space.
Related: Women's basketball is gaining ground, but is March Madness ready to rival the men's game?
Blackwells Capital is also pushing three of its candidates to take seats during the early April shareholder meeting, though Reuters has reported that the firm has been supportive of the company's current direction.
Disney has struggled in recent years amid the changes in media and the effects of the pandemic — which triggered the return of Iger at the helm in late 2022. After going through mass layoffs in the spring of 2023 and focusing on key growth brands, the company has seen a steady recovery with its stock up over 25% year-to-date and around 40% for the last six months.
Related: Veteran fund manager picks favorite stocks for 2024
stocks pandemic recoveryUncategorized
Another airline is making lounge fees more expensive
Qantas Airways is increasing the price of accessing its network of lounges by as much as 17%.
Share this:

Over the last two years, multiple airlines have dealt with crowding in their lounges. While they are designed as a luxury experience for a small subset of travelers, high numbers of people taking a trip post-pandemic as well as the different ways they are able to gain access through status or certain credit cards made it difficult for some airlines to keep up with keeping foods stocked, common areas clean and having enough staff to serve bar drinks at the rate that customers expect them.
In the fall of 2023, Delta Air Lines (DAL) caught serious traveler outcry after announcing that it was cracking down on crowding by raising how much one needs to spend for lounge access and limiting the number of times one can enter those lounges.
Related: Competitors pushed Delta to backtrack on its lounge and loyalty program changes
Some airlines saw the outcry with Delta as their chance to reassure customers that they would not raise their fees while others waited for the storm to pass to quietly implement their own increases.
Shutterstock
This is how much more you'll have to pay for Qantas lounge access
Australia's flagship carrier Qantas Airways (QUBSF) is the latest airline to announce that it would raise the cost accessing the 24 lounges across the country as well as the 600 international lounges available at airports across the world through partner airlines.
More Travel:
- A new travel term is taking over the internet (and reaching airlines and hotels)
- The 10 best airline stocks to buy now
- Airlines see a new kind of traveler at the front of the plane
Unlike other airlines which grant access primarily after reaching frequent flyer status, Qantas also sells it through a membership — starting from April 18, 2024, prices will rise from $600 Australian dollars ($392 USD) to $699 AUD ($456 USD) for one year, $1,100 ($718 USD) to $1,299 ($848 USD) for two years and $2,000 AUD ($1,304) to lock in the rate for four years.
Those signing up for lounge access for the first time also currently pay a joining fee of $99 AUD ($65 USD) that will rise to $129 AUD ($85 USD).
The airline also allows customers to purchase their membership with Qantas Points they collect through frequent travel; the membership fees are also being raised by the equivalent amount in points in what adds up to as much as 17% — from 308,000 to 399,900 to lock in access for four years.
Airline says hikes will 'cover cost increases passed on from suppliers'
"This is the first time the Qantas Club membership fees have increased in seven years and will help cover cost increases passed on from a range of suppliers over that time," a Qantas spokesperson confirmed to Simple Flying. "This follows a reduction in the membership fees for several years during the pandemic."
The spokesperson said the gains from the increases will go both towards making up for inflation-related costs and keeping existing lounges looking modern by updating features like furniture and décor.
While the price increases also do not apply for those who earned lounge access through frequent flyer status or change what it takes to earn that status, Qantas is also introducing even steeper increases for those renewing a membership or adding additional features such as spouse and partner memberships.
In some cases, the cost of these features will nearly double from what members are paying now.
stocks pandemic

Manufacturing and construction vs. the still-inverted yield curve


When words make you sick


How much stress is too much? A psychiatrist explains the links between toxic stress and poor health − and how to get help


Caitlin Clark, Coach Prime, and Linsanity: The Anatomy of a Viewership ‘Craze’


PR55α-controlled PP2A Inhibits p16 Expression and Blocks Cellular Senescence Induction


Half Of Downtown Pittsburgh Office Space Could Be Empty In 4 Years


US Economic Conditions Scream “Buy Gold”


Wall Street Bonuses Fall For Second Year To 2019 Lows Amid Capital Markets Freeze


One more airline cracks down on lounge crowding in a way you won’t like


Airline, travel companies face Chapter 11 bankruptcy, default risk
-

 Spread & Containment7 days ago
IFM’s Hat Trick and Reflections On Option-To-Buy M&A
-

 Uncategorized4 weeks ago
All Of The Elements Are In Place For An Economic Crisis Of Staggering Proportions
-

 International2 weeks ago
EyePoint poaches medical chief from Apellis; Sandoz CFO, longtime BioNTech exec to retire
-

 Uncategorized1 month ago
California Counties Could Be Forced To Pay $300 Million To Cover COVID-Era Program
-

 Uncategorized4 weeks ago
Apparel Retailer Express Moving Toward Bankruptcy
-

 Uncategorized1 month ago
Industrial Production Decreased 0.1% in January
-

 International2 weeks ago
Walmart launches clever answer to Target’s new membership program
-

 Uncategorized1 month ago
RFK Jr: The Wuhan Cover-Up & The Rise Of The Biowarfare-Industrial Complex