Hard Assets: Are They A Trap In The Making?
The hard asset, commodity, trade has sprung to life over the last couple of months. Such is commensurate, and logical, with the surge in inflation. However, is the hard asset trade a sustainable one? Or is it a trap that will disappoint investors in the..
Share this:

The hard asset, commodity, trade has sprung to life over the last couple of months. Such is commensurate, and logical, with the surge in inflation. However, is the hard asset trade a sustainable one? Or is it a trap that will disappoint investors in the years to come?
When it comes to the commodity, or hard asset, trade, it is usually avoided by the mainstream media. They would rather focus on whatever “hot stock” or investment meme is leading the market at the time. However, from “gold bugs” to “oil traders,” the commodity trade is a source of booms and busts along the way.
For our analysis, we are going to focus on the CRB Commodity Index as a proxy for commodities. From the index, we can then explore how the dollar, interest rates, economic growth, and inflation drive commodity prices.
Is the commodity trade is here to stay, or is this another “boom” waiting to “bust.”
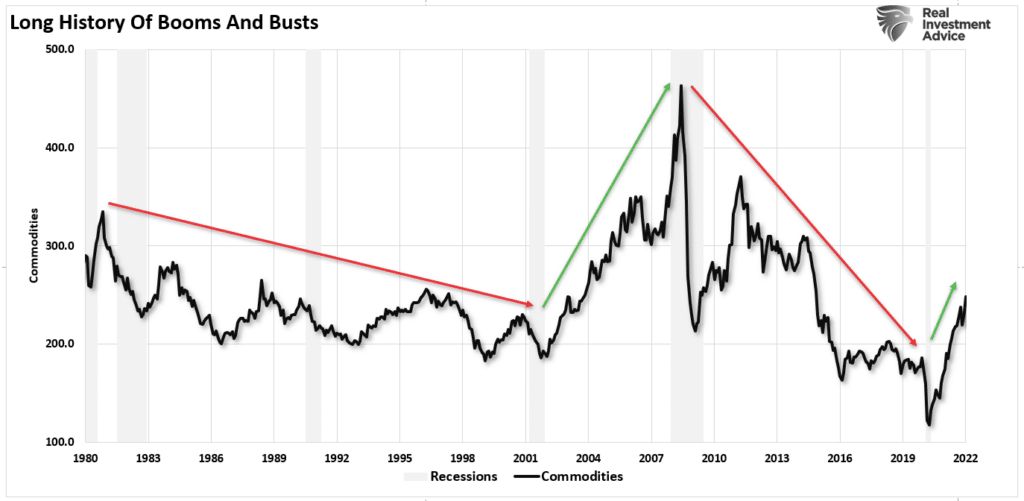
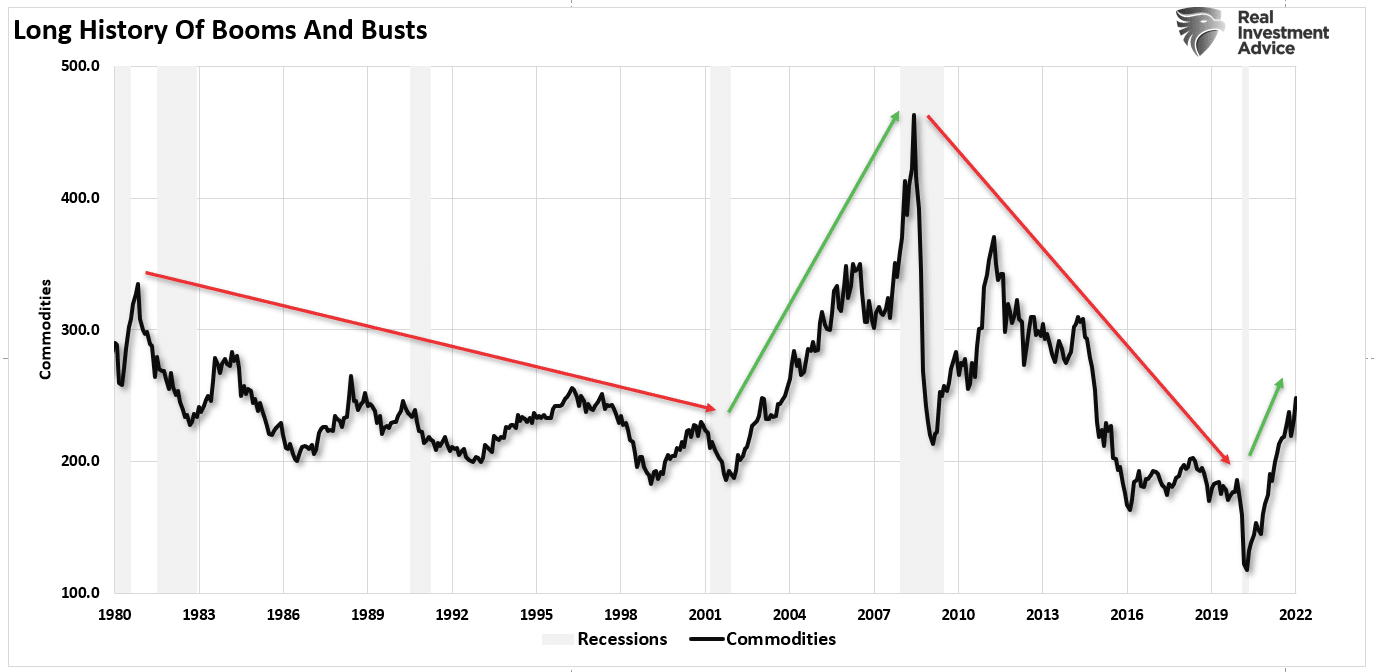
A Long History Of Booms And Busts
Since 1980, the start of my data feed for the CRB Index, there have been 4-distinct cycles in commodities.
From 1980 to 2000, the trend of commodity prices fell as the economy shifted from manufacturing to financialization. Beginning in 2001, as the dot.com era came to an end, investment flows shifted to commodities and emerging markets in anticipation of a global resurgence. Housing demand boomed as mortgage rates fell, and energy demand rose on fears of “peak oil production.”
However, as quickly as it came, the demand for commodities faded as the financial crisis crippled the entire global economy. That deflationary trend continued until March 2020. As the Covid-pandemic locked down economies, governments injected billions of dollars to stimulate demand. Not surprisingly, inflation surged and demand for inflation protection in the form of commodities rose.
Since the demand-side of the equation was driven by artificial liquidity, the question is now the sustainability of higher prices?
To answer that question, we must understand that commodities, and hard assets in general, do not live in a vacuum. Rather, they are very subject to the supply-demand equation which ultimately sets their price. Therefore, and not surprisingly, economic growth, interest rates, the dollar, and the money supply weigh heavily on that equation.
A review of those factors, relating directly to inflation is useful in determining the current trend of rising commodity prices. Or, whether deflation is a bigger threat.
All lndicators Suggest Commodity Run Is Limited
If commodities, and hard assets, are driven by demand, particularly in manufacturing, then there are several indicators pointing to the ongoing demand for those assets.
Interest rates are important as rates reflect the strength of economic growth, inflation, wages, and overall demand. There is a decent correlation between the annual change in interest rates (reflecting economic strength or weakness) and commodity prices.

Not surprisingly, the recent surge in commodity prices, from the 2020 lows, corresponds with the jump in rates. Such corresponds with the flood of fiscal policy allowing demand to outpace the economic production capacity. However, with the liquidity now reversed, rates are reversing to levels consistent with weaker economic growth rates.
A consequence of that reversal in liquidity, as measured through M2, is the reversal of inflation over the next 9-months. Again, since commodities are highly correlated to inflation, it suggests the peak in the “hard asset” trade as the economy normalizes.

Lastly, commodities, and hard assets in general, trade globally in U.S. dollars, and the trend and direction of the currency are important. As the dollar strengthens, such makes commodities more expensive for our foreign partners. A weaker dollar allows U.S. consumers to buy more increasing demand. Such explains why there is an inverse correlation between the dollar and commodities.

Where the dollar goes next will largely depend on the relative strength of the U.S. economy to the rest of the world. We suspect that while the U.S. economy will weaken in the months ahead, the rest of the globe will be worse. The U.S. has, and will likely remain, the “cleanest shirt in the dirty laundry.”
It’s The Economy, Stupid
While interest rates, inflation, money supply, and the dollar can give us clues about the commodity and hard asset trade, in the end it really is “the economy, stupid.”
As stated above, all commodity and hard asset prices are ultimately set by supply and demand. If the economy is strong, then demand for finished goods, real estate, housing, autos, etc., will be strong. The strength of that demand will increase production increasing the demand for raw materials. If the economy weakens, that demand falls leading to an inventory glut and a fall in prices. Not surprisingly, commodities track nominal GDP growth.

The surge in economic growth following the pandemic-driven shutdown was, as stated, an artificial “sugar rush” of liquidity flooding the system. Such caused a massive surge in money supply, leading to inflation given the lack of productive capacity. However, as is already the case, economic activity is reverting to its more normal levels.
“As the budget deficit grows over the next few years, interest payments alone will absorb a larger chunk of tax revenue. Such comes at a time when that same dollar of tax revenue only covers the entitlement spending of the 75-million baby boomers migrating into the social safety net.
By the way, the only other time government income support exceeded taxes paid was during the “Great Depression” from 1931 to 1936.
The debt problem remains a massive risk to monetary and fiscal policy. If rates rise, the negative impact on an indebted economy quickly depresses activity. More importantly, the decline in monetary velocity clearly shows that deflation is a persistent threat.

The last sentence is the most important when it comes to hard assets.

The Hard Asset Trade Tends To End Badly
When it comes to commodities and hard assets in general, they can be an exhilarating and profitable ride on the way up. However, as shown in the long-term chart above, that trade tends to end badly.
Will this time be different? Such is unlikely to be the case.
As the country continues to move towards a more socialistic profile, economic growth will remain constrained to 2% or less with deflation remaining a consistent long-term threat. Dr. Lacy Hunt previously suggested the same.
Contrary to conventional wisdom, disinflation is more likely than accelerating inflation. Since prices deflated in the second quarter of 2020, the annual inflation rate will move transitorily higher. Once these base effects are exhausted, cyclical, structural, and monetary considerations suggest that the inflation rate will moderate lower by year-end and undershoot the Fed Reserve’s target of 2%. The inflationary psychosis that has gripped the bond market will fade away in the face of such persistent disinflation.
As he concludes:
The two main structural impediments to traditional U.S. and global economic growth are massive debt overhang and deteriorating demographics both having worsened as a consequence of 2020.
The last point is crucial to the long-term inflation and commodity dynamic. As the liquidity gets removed from the system, the debt overhang will weigh on consumption as incomes are diverted from productive activity to debt service. As such, the demand for commodities will weaken.
Let me conclude with this point from Michael Lebowitz:
The multitude of dynamics that determine commodity prices means there are no quick and easy answers to determining an effective strategy.
While the commodity trade is certainly “in bloom” with the surge in liquidity, be careful of its eventual reversal.
For investors, deflation remains a “trap in the making” for hard assets.
The post Hard Assets: Are They A Trap In The Making? appeared first on RIA.
depression pandemic economic growth emerging markets fed budget deficit mortgage rates real estate gdp interest rates commodities gold oilInternational
There will soon be one million seats on this popular Amtrak route
“More people are taking the train than ever before,” says Amtrak’s Executive Vice President.
Share this:


While the size of the United States makes it hard for it to compete with the inter-city train access available in places like Japan and many European countries, Amtrak trains are a very popular transportation option in certain pockets of the country — so much so that the country’s national railway company is expanding its Northeast Corridor by more than one million seats.
Related: This is what it's like to take a 19-hour train from New York to Chicago
Running from Boston all the way south to Washington, D.C., the route is one of the most popular as it passes through the most densely populated part of the country and serves as a commuter train for those who need to go between East Coast cities such as New York and Philadelphia for business.
Veronika Bondarenko
Amtrak launches new routes, promises travelers ‘additional travel options’
Earlier this month, Amtrak announced that it was adding four additional Northeastern routes to its schedule — two more routes between New York’s Penn Station and Union Station in Washington, D.C. on the weekend, a new early-morning weekday route between New York and Philadelphia’s William H. Gray III 30th Street Station and a weekend route between Philadelphia and Boston’s South Station.
More Travel:
- A new travel term is taking over the internet (and reaching airlines and hotels)
- The 10 best airline stocks to buy now
- Airlines see a new kind of traveler at the front of the plane
According to Amtrak, these additions will increase Northeast Corridor’s service by 20% on the weekdays and 10% on the weekends for a total of one million additional seats when counted by how many will ride the corridor over the year.
“More people are taking the train than ever before and we’re proud to offer our customers additional travel options when they ride with us on the Northeast Regional,” Amtrak Executive Vice President and Chief Commercial Officer Eliot Hamlisch said in a statement on the new routes. “The Northeast Regional gets you where you want to go comfortably, conveniently and sustainably as you breeze past traffic on I-95 for a more enjoyable travel experience.”
Here are some of the other Amtrak changes you can expect to see
Amtrak also said that, in the 2023 financial year, the Northeast Corridor had nearly 9.2 million riders — 8% more than it had pre-pandemic and a 29% increase from 2022. The higher demand, particularly during both off-peak hours and the time when many business travelers use to get to work, is pushing Amtrak to invest into this corridor in particular.
To reach more customers, Amtrak has also made several changes to both its routes and pricing system. In the fall of 2023, it introduced a type of new “Night Owl Fare” — if traveling during very late or very early hours, one can go between cities like New York and Philadelphia or Philadelphia and Washington. D.C. for $5 to $15.
As travel on the same routes during peak hours can reach as much as $300, this was a deliberate move to reach those who have the flexibility of time and might have otherwise preferred more affordable methods of transportation such as the bus. After seeing strong uptake, Amtrak added this type of fare to more Boston routes.
The largest distances, such as the ones between Boston and New York or New York and Washington, are available at the lowest rate for $20.
stocks pandemic japan europeanInternational
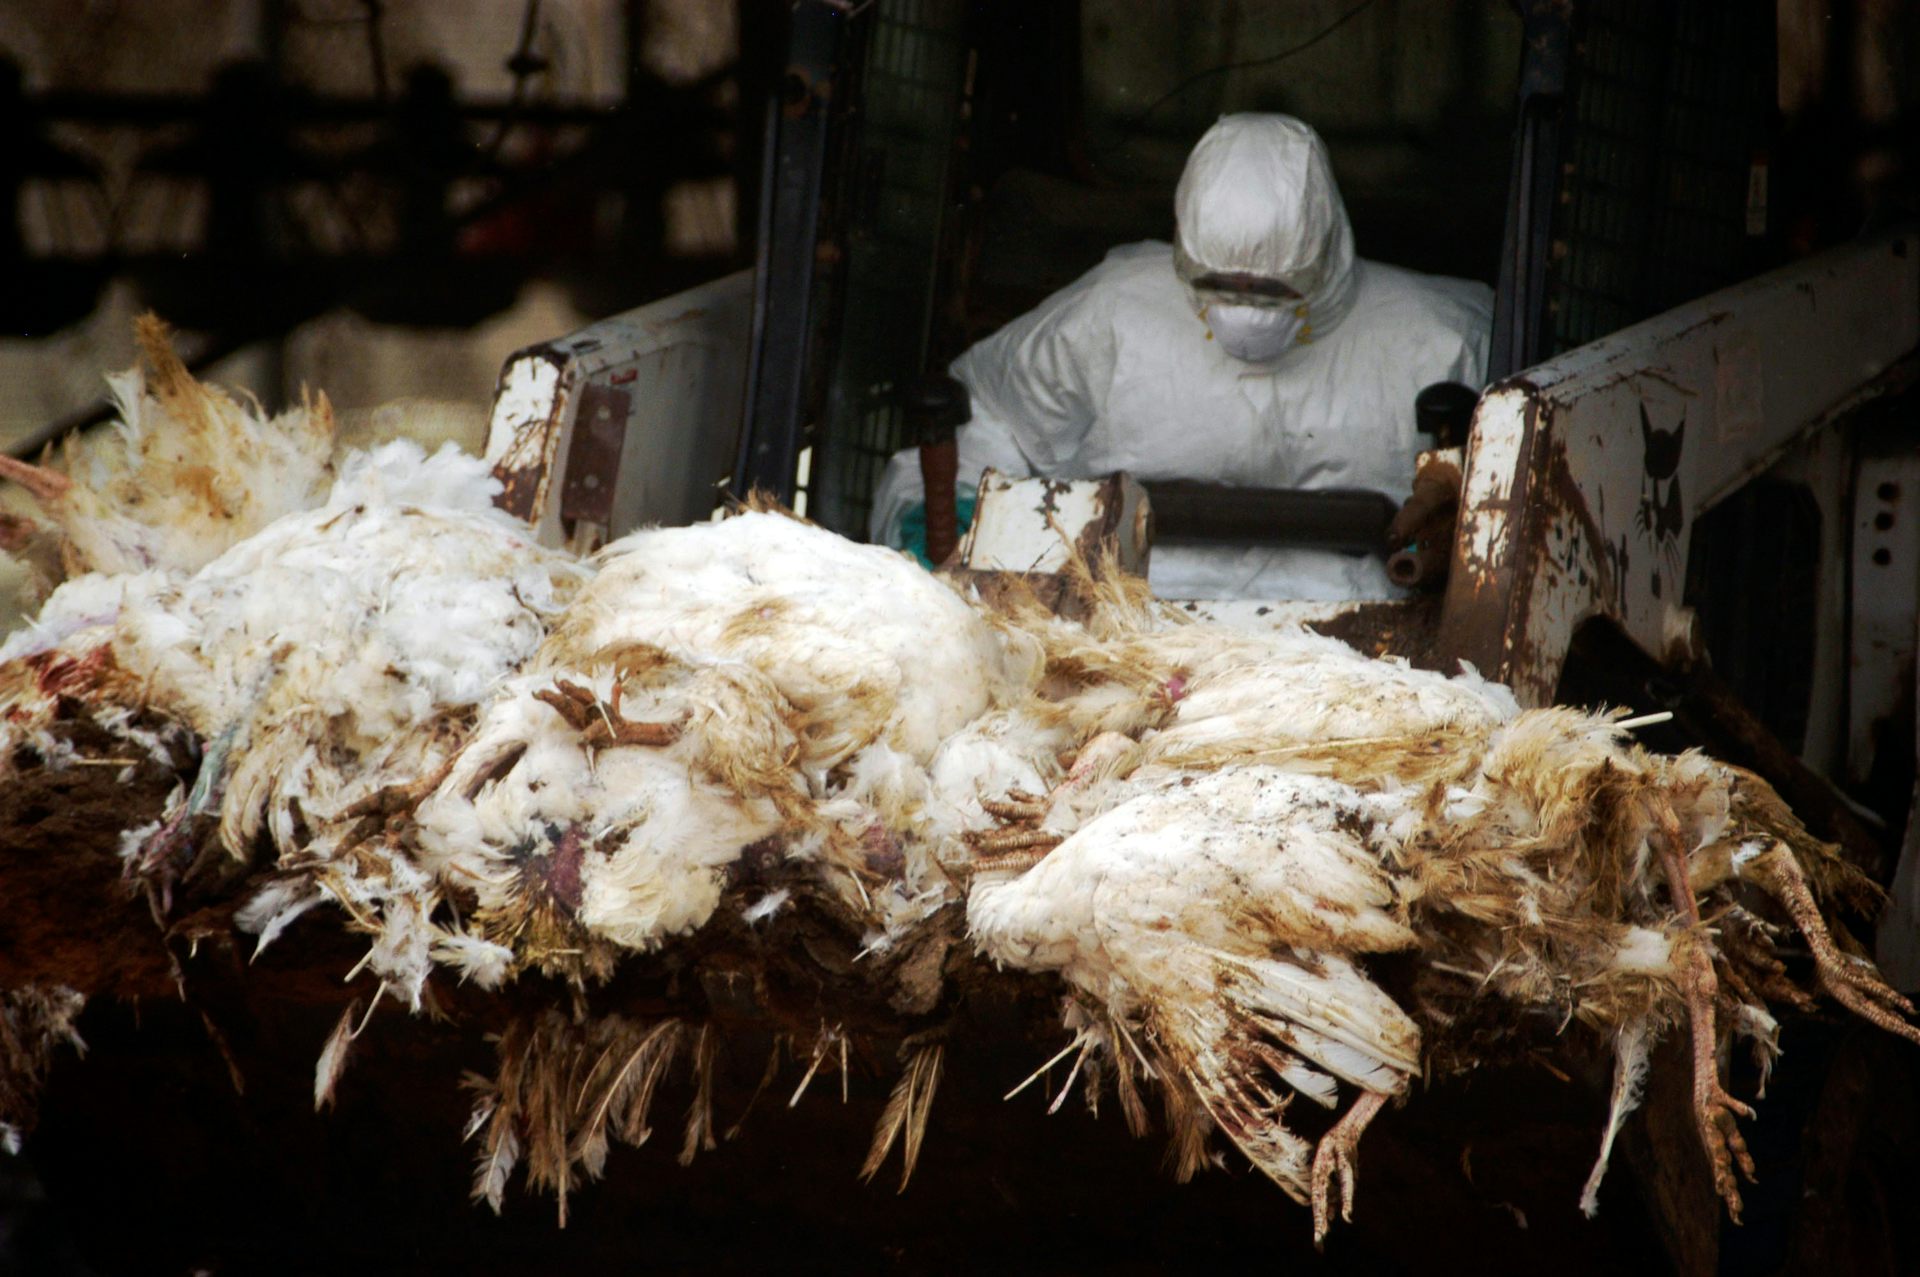
The next pandemic? It’s already here for Earth’s wildlife
Bird flu is decimating species already threatened by climate change and habitat loss.
Share this:

I am a conservation biologist who studies emerging infectious diseases. When people ask me what I think the next pandemic will be I often say that we are in the midst of one – it’s just afflicting a great many species more than ours.
I am referring to the highly pathogenic strain of avian influenza H5N1 (HPAI H5N1), otherwise known as bird flu, which has killed millions of birds and unknown numbers of mammals, particularly during the past three years.
This is the strain that emerged in domestic geese in China in 1997 and quickly jumped to humans in south-east Asia with a mortality rate of around 40-50%. My research group encountered the virus when it killed a mammal, an endangered Owston’s palm civet, in a captive breeding programme in Cuc Phuong National Park Vietnam in 2005.
How these animals caught bird flu was never confirmed. Their diet is mainly earthworms, so they had not been infected by eating diseased poultry like many captive tigers in the region.
This discovery prompted us to collate all confirmed reports of fatal infection with bird flu to assess just how broad a threat to wildlife this virus might pose.
This is how a newly discovered virus in Chinese poultry came to threaten so much of the world’s biodiversity.
The first signs
Until December 2005, most confirmed infections had been found in a few zoos and rescue centres in Thailand and Cambodia. Our analysis in 2006 showed that nearly half (48%) of all the different groups of birds (known to taxonomists as “orders”) contained a species in which a fatal infection of bird flu had been reported. These 13 orders comprised 84% of all bird species.
We reasoned 20 years ago that the strains of H5N1 circulating were probably highly pathogenic to all bird orders. We also showed that the list of confirmed infected species included those that were globally threatened and that important habitats, such as Vietnam’s Mekong delta, lay close to reported poultry outbreaks.
Mammals known to be susceptible to bird flu during the early 2000s included primates, rodents, pigs and rabbits. Large carnivores such as Bengal tigers and clouded leopards were reported to have been killed, as well as domestic cats.
Our 2006 paper showed the ease with which this virus crossed species barriers and suggested it might one day produce a pandemic-scale threat to global biodiversity.
Unfortunately, our warnings were correct.
A roving sickness
Two decades on, bird flu is killing species from the high Arctic to mainland Antarctica.
In the past couple of years, bird flu has spread rapidly across Europe and infiltrated North and South America, killing millions of poultry and a variety of bird and mammal species. A recent paper found that 26 countries have reported at least 48 mammal species that have died from the virus since 2020, when the latest increase in reported infections started.
Not even the ocean is safe. Since 2020, 13 species of aquatic mammal have succumbed, including American sea lions, porpoises and dolphins, often dying in their thousands in South America. A wide range of scavenging and predatory mammals that live on land are now also confirmed to be susceptible, including mountain lions, lynx, brown, black and polar bears.
The UK alone has lost over 75% of its great skuas and seen a 25% decline in northern gannets. Recent declines in sandwich terns (35%) and common terns (42%) were also largely driven by the virus.
Scientists haven’t managed to completely sequence the virus in all affected species. Research and continuous surveillance could tell us how adaptable it ultimately becomes, and whether it can jump to even more species. We know it can already infect humans – one or more genetic mutations may make it more infectious.
At the crossroads
Between January 1 2003 and December 21 2023, 882 cases of human infection with the H5N1 virus were reported from 23 countries, of which 461 (52%) were fatal.
Of these fatal cases, more than half were in Vietnam, China, Cambodia and Laos. Poultry-to-human infections were first recorded in Cambodia in December 2003. Intermittent cases were reported until 2014, followed by a gap until 2023, yielding 41 deaths from 64 cases. The subtype of H5N1 virus responsible has been detected in poultry in Cambodia since 2014. In the early 2000s, the H5N1 virus circulating had a high human mortality rate, so it is worrying that we are now starting to see people dying after contact with poultry again.
It’s not just H5 subtypes of bird flu that concern humans. The H10N1 virus was originally isolated from wild birds in South Korea, but has also been reported in samples from China and Mongolia.
Recent research found that these particular virus subtypes may be able to jump to humans after they were found to be pathogenic in laboratory mice and ferrets. The first person who was confirmed to be infected with H10N5 died in China on January 27 2024, but this patient was also suffering from seasonal flu (H3N2). They had been exposed to live poultry which also tested positive for H10N5.
Species already threatened with extinction are among those which have died due to bird flu in the past three years. The first deaths from the virus in mainland Antarctica have just been confirmed in skuas, highlighting a looming threat to penguin colonies whose eggs and chicks skuas prey on. Humboldt penguins have already been killed by the virus in Chile.

How can we stem this tsunami of H5N1 and other avian influenzas? Completely overhaul poultry production on a global scale. Make farms self-sufficient in rearing eggs and chicks instead of exporting them internationally. The trend towards megafarms containing over a million birds must be stopped in its tracks.
To prevent the worst outcomes for this virus, we must revisit its primary source: the incubator of intensive poultry farms.
Diana Bell does not work for, consult, own shares in or receive funding from any company or organisation that would benefit from this article, and has disclosed no relevant affiliations beyond their academic appointment.
genetic pandemic mortality spread deaths south korea south america europe uk chinaUncategorized
NY Fed Finds Medium, Long-Term Inflation Expectations Jump Amid Surge In Stock Market Optimism
NY Fed Finds Medium, Long-Term Inflation Expectations Jump Amid Surge In Stock Market Optimism
One month after the inflation outlook tracked…
Share this:


One month after the inflation outlook tracked by the NY Fed Consumer Survey extended their late 2023 slide, with 3Y inflation expectations in January sliding to a record low 2.4% (from 2.6% in December), even as 1 and 5Y inflation forecasts remained flat, moments ago the NY Fed reported that in February there was a sharp rebound in longer-term inflation expectations, rising to 2.7% from 2.4% at the three-year ahead horizon, and jumping to 2.9% from 2.5% at the five-year ahead horizon, while the 1Y inflation outlook was flat for the 3rd month in a row, stuck at 3.0%.
The increases in both the three-year ahead and five-year ahead measures were most pronounced for respondents with at most high school degrees (in other words, the "really smart folks" are expecting deflation soon). The survey’s measure of disagreement across respondents (the difference between the 75th and 25th percentile of inflation expectations) decreased at all horizons, while the median inflation uncertainty—or the uncertainty expressed regarding future inflation outcomes—declined at the one- and three-year ahead horizons and remained unchanged at the five-year ahead horizon.
Going down the survey, we find that the median year-ahead expected price changes increased by 0.1 percentage point to 4.3% for gas; decreased by 1.8 percentage points to 6.8% for the cost of medical care (its lowest reading since September 2020); decreased by 0.1 percentage point to 5.8% for the cost of a college education; and surprisingly decreased by 0.3 percentage point for rent to 6.1% (its lowest reading since December 2020), and remained flat for food at 4.9%.

We find the rent expectations surprising because it is happening just asking rents are rising across the country.

At the same time as consumers erroneously saw sharply lower rents, median home price growth expectations remained unchanged for the fifth consecutive month at 3.0%.
Turning to the labor market, the survey found that the average perceived likelihood of voluntary and involuntary job separations increased, while the perceived likelihood of finding a job (in the event of a job loss) declined. "The mean probability of leaving one’s job voluntarily in the next 12 months also increased, by 1.8 percentage points to 19.5%."

Mean unemployment expectations - or the mean probability that the U.S. unemployment rate will be higher one year from now - decreased by 1.1 percentage points to 36.1%, the lowest reading since February 2022. Additionally, the median one-year-ahead expected earnings growth was unchanged at 2.8%, remaining slightly below its 12-month trailing average of 2.9%.
Turning to household finance, we find the following:
- The median expected growth in household income remained unchanged at 3.1%. The series has been moving within a narrow range of 2.9% to 3.3% since January 2023, and remains above the February 2020 pre-pandemic level of 2.7%.
- Median household spending growth expectations increased by 0.2 percentage point to 5.2%. The increase was driven by respondents with a high school degree or less.
- Median year-ahead expected growth in government debt increased to 9.3% from 8.9%.
- The mean perceived probability that the average interest rate on saving accounts will be higher in 12 months increased by 0.6 percentage point to 26.1%, remaining below its 12-month trailing average of 30%.
- Perceptions about households’ current financial situations deteriorated somewhat with fewer respondents reporting being better off than a year ago. Year-ahead expectations also deteriorated marginally with a smaller share of respondents expecting to be better off and a slightly larger share of respondents expecting to be worse off a year from now.
- The mean perceived probability that U.S. stock prices will be higher 12 months from now increased by 1.4 percentage point to 38.9%.
- At the same time, perceptions and expectations about credit access turned less optimistic: "Perceptions of credit access compared to a year ago deteriorated with a larger share of respondents reporting tighter conditions and a smaller share reporting looser conditions compared to a year ago."

Also, a smaller percentage of consumers, 11.45% vs 12.14% in prior month, expect to not be able to make minimum debt payment over the next three months

Last, and perhaps most humorous, is the now traditional cognitive dissonance one observes with these polls, because at a time when long-term inflation expectations jumped, which clearly suggests that financial conditions will need to be tightened, the number of respondents expecting higher stock prices one year from today jumped to the highest since November 2021... which incidentally is just when the market topped out during the last cycle before suffering a painful bear market.


Veterans Affairs Kept COVID-19 Vaccine Mandate In Place Without Evidence


The Coming Of The Police State In America


‘I couldn’t stand the pain’: the Turkish holiday resort that’s become an emergency dental centre for Britons who can’t get treated at home


Beloved mall retailer files Chapter 7 bankruptcy, will liquidate


Is the National Guard a solution to school violence?


Rand Paul Teases Senate GOP Leader Run – Musk Says “I Would Support”


The next pandemic? It’s already here for Earth’s wildlife


Vaccine-skeptical mothers say bad health care experiences made them distrust the medical system


Are Voters Recoiling Against Disorder?


The Great Replacement Loophole: Illegal Immigrants Score 5-Year Work Benefit While “Waiting” For Deporation, Asylum
-

 Uncategorized3 weeks ago
All Of The Elements Are In Place For An Economic Crisis Of Staggering Proportions
-

 Uncategorized1 month ago
Cathie Wood sells a major tech stock (again)
-

 Uncategorized3 weeks ago
California Counties Could Be Forced To Pay $300 Million To Cover COVID-Era Program
-

 Uncategorized2 weeks ago
Apparel Retailer Express Moving Toward Bankruptcy
-

 Uncategorized4 weeks ago
Industrial Production Decreased 0.1% in January
-

 International3 days ago
EyePoint poaches medical chief from Apellis; Sandoz CFO, longtime BioNTech exec to retire
-

 International3 days ago
Walmart launches clever answer to Target’s new membership program
-

 Uncategorized3 weeks ago
RFK Jr: The Wuhan Cover-Up & The Rise Of The Biowarfare-Industrial Complex