Gold Price Framework Update: The New Cycle Accelerates
Gold Price Framework Update: The New Cycle Accelerates
Via Goldmoney Insights,
Gold prices rallied 25% in 2020 after having gained 19% the year before. We believe this marks still only the beginning of the current golds price cycle, as all..
Share this:

Gold prices rallied 25% in 2020 after having gained 19% the year before. We believe this marks still only the beginning of the current golds price cycle, as all main drivers for gold prices are strongly skewed to the upside.

In our gold price framework (Gold Price Framework Vol. 2 – The Energy Side of the Equation, May 28, 2018), we identified three main price drivers for gold prices over the long run:
-
Central bank policy (real-interest rate expectations and quantitative easing),
-
net central bank gold sales and
-
longer-dated energy prices.
When we presented the first iteration of this model in late 2015, we came to the conclusion that these three drivers were all aligned for gold to be at the bottom of its prices cycle and enter a new cycle.
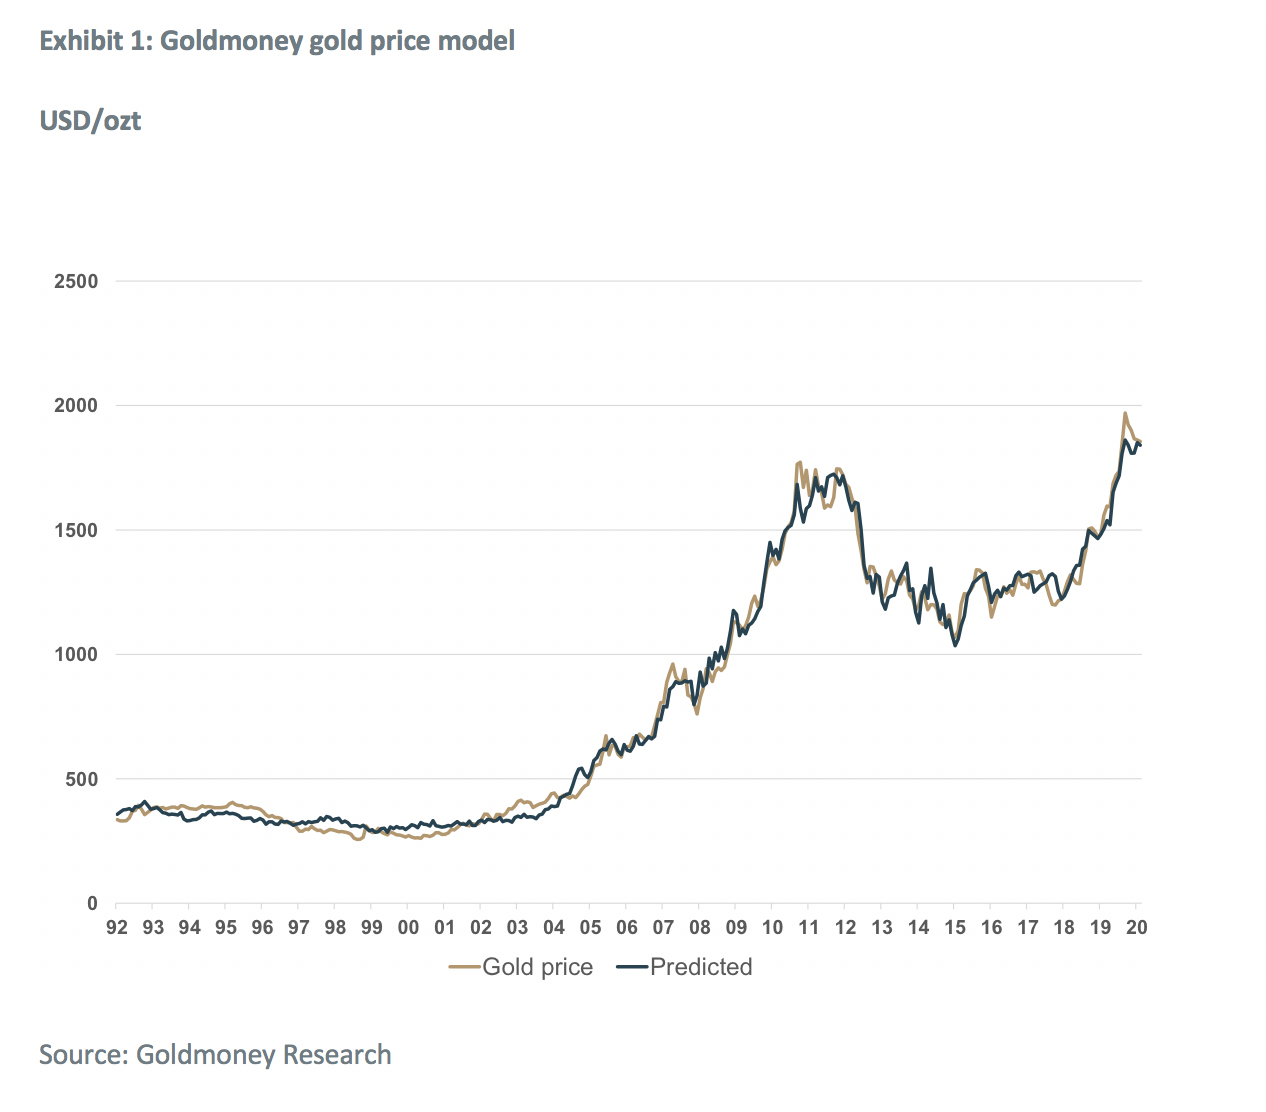
At the time, gold was trading at around $1100. Over the subsequent years, gold prices have gradually risen in all currencies. It made new record highs in every currency one by one, until it also finally broke its previous all-time high in USD of $1900 in July last year. Gold prices subsequently rallied briefly to $2070 in August before consolidating over the past months.
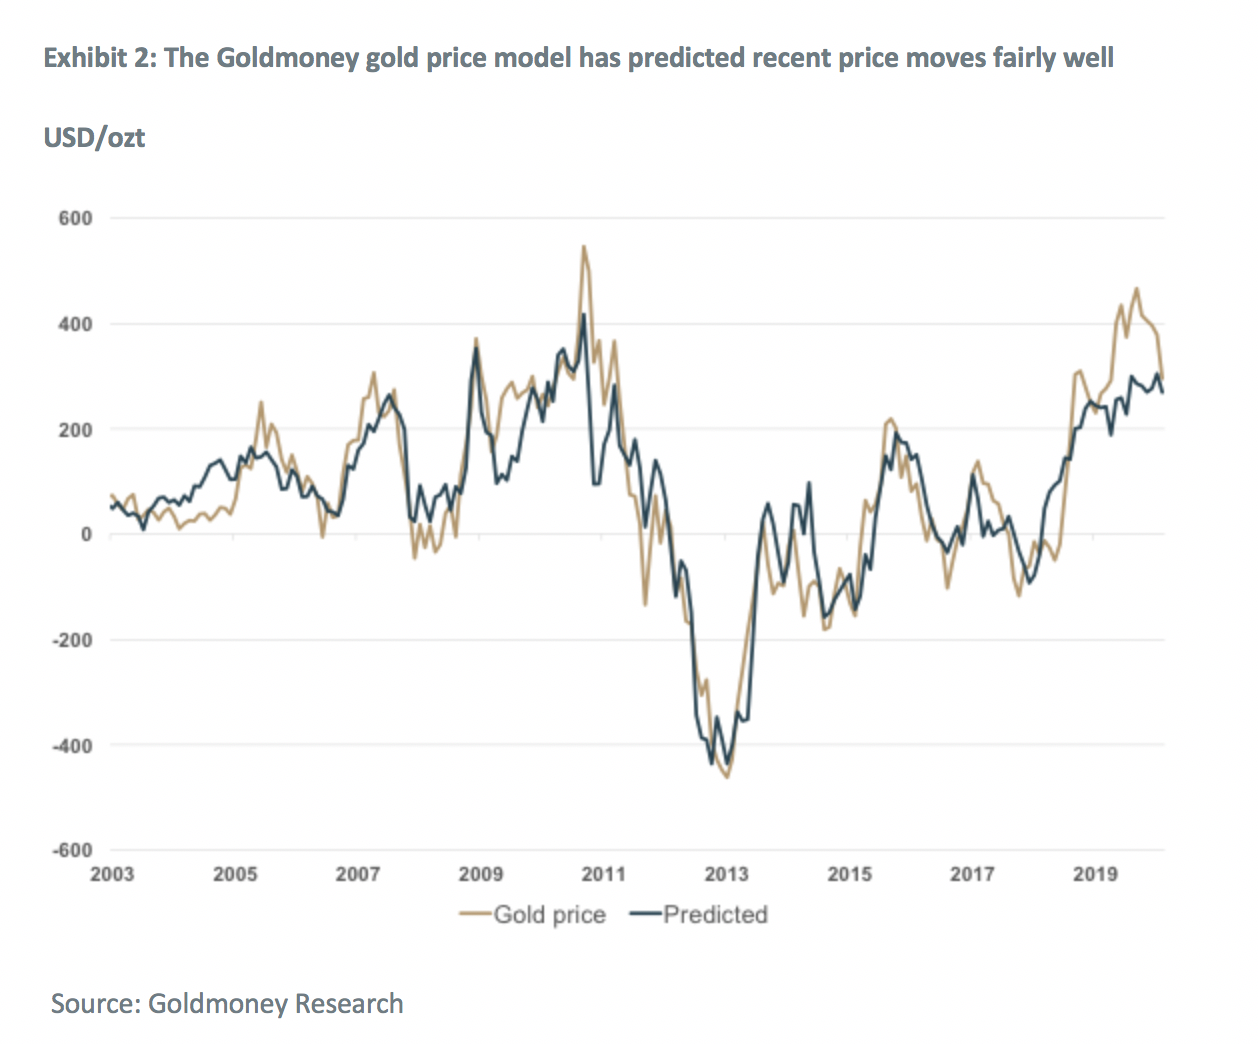
We think this is still the early stage of a new gold cycle that started in 2016 rather than the end of it. Our gold price framework has predicted the recent moves very well (see Exhibit 2). In our view, gold prices overshot in summer and prices were no longer supported by the underlying fundamental drivers. This has now corrected. Given our views on where the main drivers in our model are heading, we think the risk to gold prices remains strongly skewed to the upside. While we think some downside risk remains, any large retracement will be short lived in our view.
Gold price drivers in 2020
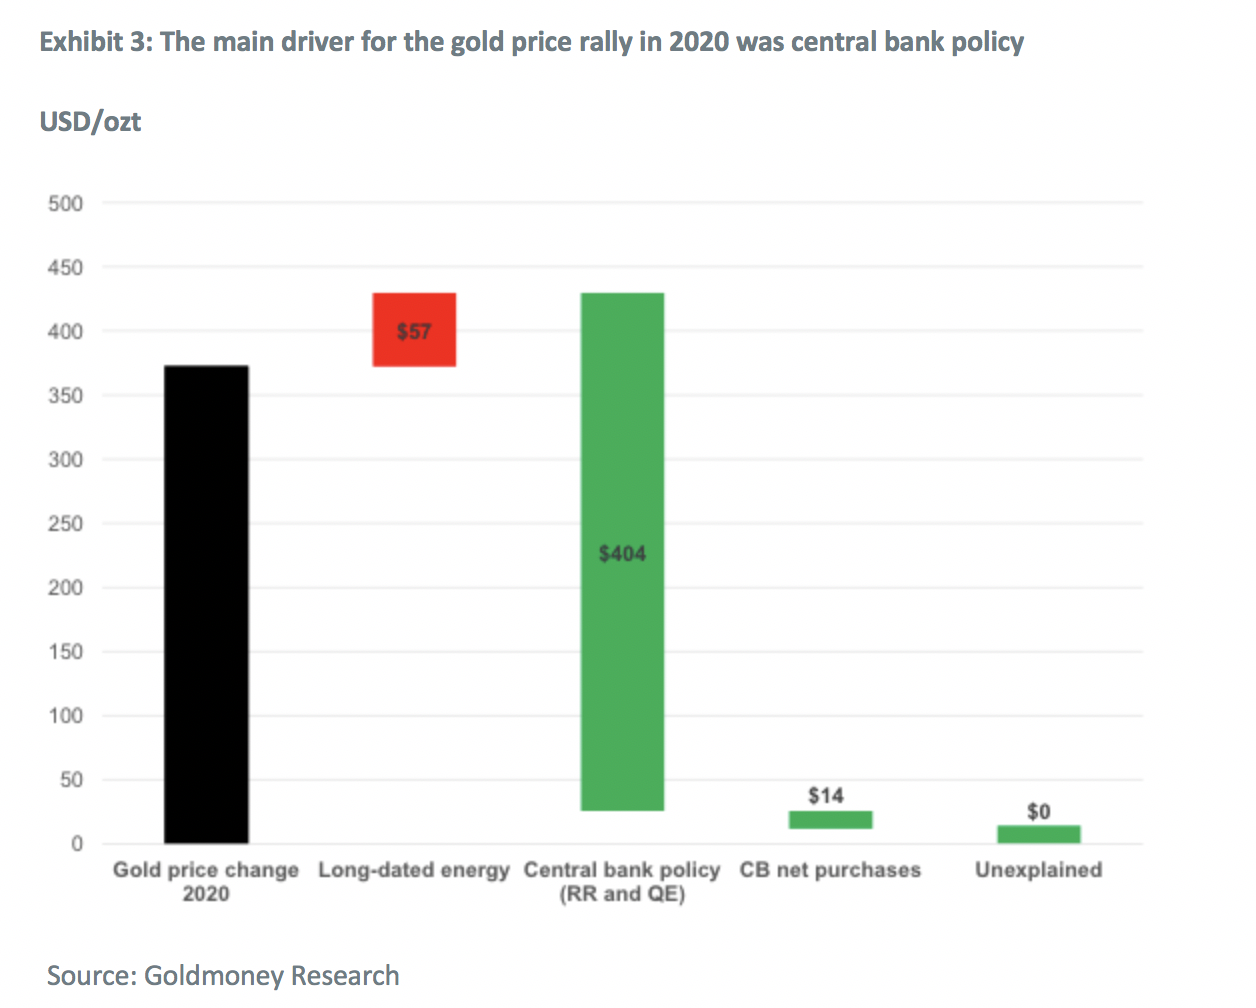
The 25% rally in 2020 was entirely driven by the move in real-interest rate expectations. The Fed has sharply lowered interested rates and accelerated its asset purchase programs. As a result, 10-year TIPS yields went from +13bp at the end of 2019 to -111bp in early January 2021 and are currently at around 96bp. Simultaneously, the Fed’s balance sheet went from $4.1tn by the end of 2019 to currently $7.3tn. Other central banks have also rapidly increased their balance sheets. The ECB for example went from EUR 4.7tn by the end of 2019 to currently EUR 7.0tn.
According to our model, this accounted for around $400/ozt of the gold price move in 2020. In contrast, falling longer-dated energy prices had a negative impact on gold prices of about $80/ozt. And while central banks continued to increase their gold holdings in 2020, they did so at a relatively moderate pace, which impacted the gold price only by around $10/ozt (see exhibit 3).
The current cycle will unfold over the coming years
We expect the risk for all drivers for the gold price to remain firmly skewed in favor of gold. Real-interest rate expectations are currently at their lowest point in history, but historical central bank action after a recession suggests that there is a lot of room to the downside. Longer-dated energy prices crashed as the global Covid pandemic unfolded, which will accelerate the energy supply crunch we have been expecting for the coming years. And there is no evidence that the long-term trend of growing central bank gold reserves is reversing anytime soon.
Real-interest rate expectations
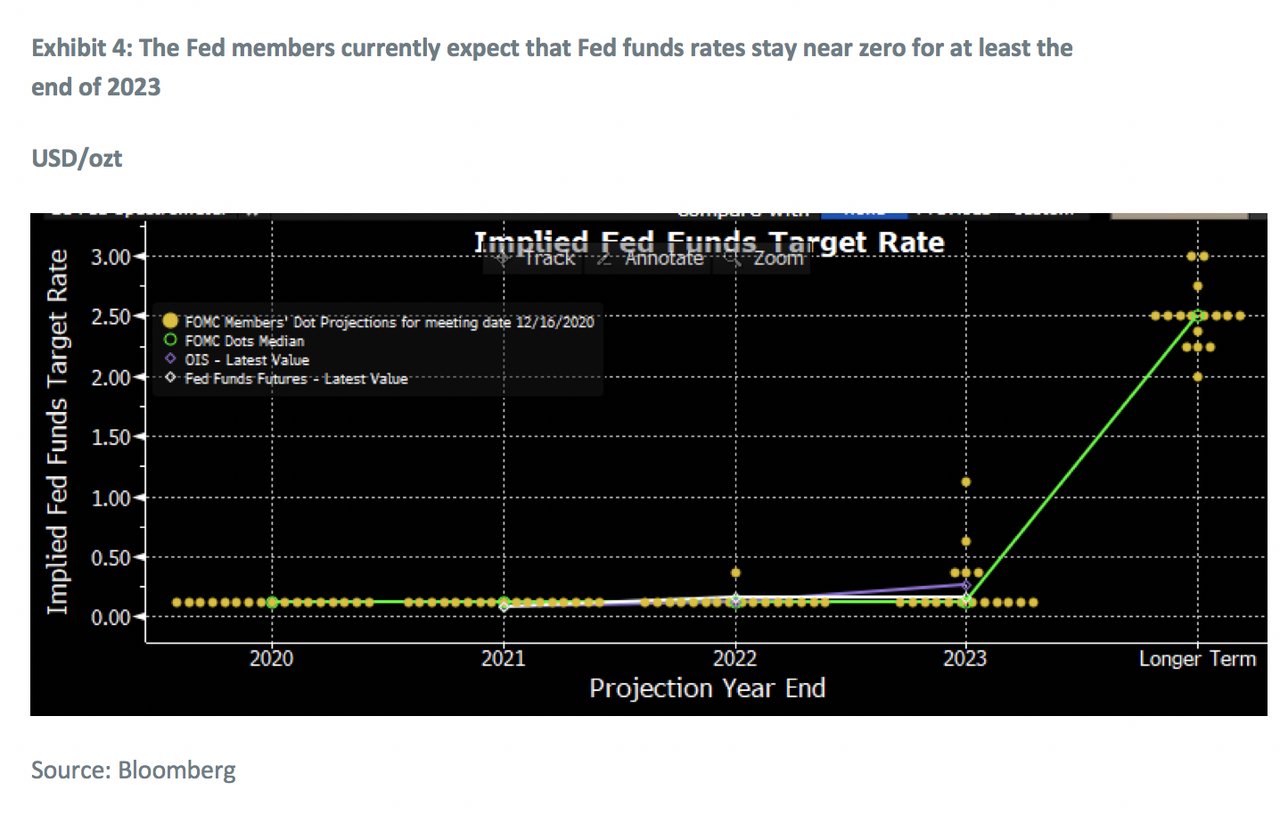
Real-interest rate expectations are a combination of long-term rates (10 year yields) and the markets long-term inflation expectations. Nominal interest rates are current at extremely low levels. The Fed funds rate has been slashed to zero and is likely to stay there for an extended period. The Fed itself is predicting that interest rates will remain at 0% for the foreseeable future (at least until the end of 2023). In the aftermath of the credit crisis, the Fed members have continuously revised their outlook for rate hikes further back as time progressed, and the terminal rate (long-term rate) expectations moved lower over time. We expect a similar situation to unfold this time.
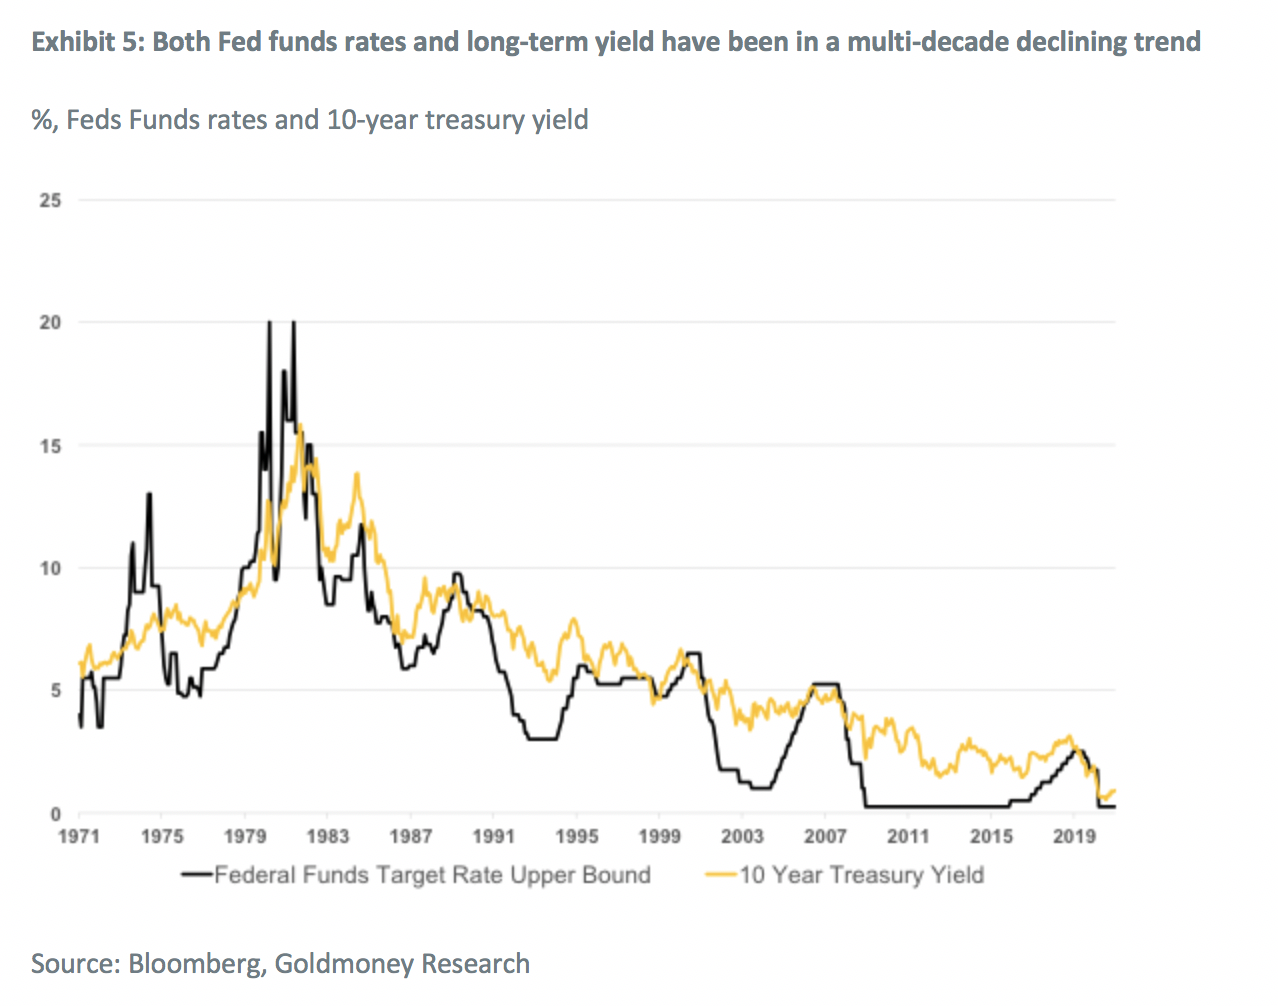
For gold prices, the nominal rates that matter are the longer-term yields. While the Fed directly sets the near-term rates, Fed policy has a strong influence on longer-dated rates (See Exhibit 5). 10-year treasury rates peaked in the early 1980 together with the Fed funds rate and have been gradually declining since.
The Fed has historically reacted to a recession by slashing near-term nominal interest rates (Fed funds rate) by about 5.5% on average. Once the economy recovered, the Fed raised the Fed funds rates, but never back to the levels prior to the rate cuts. Longer-dated rates have not been as volatile, but the overall trend was in line with shorter-dated rates.
In the aftermath of the credit crisis, the Fed began to directly target longer-dated rates by purchasing treasury bonds in an attempt to keep the long-term yield low.
10-year treasury rates have thus moved from around 5% in 2007 to as low as 0.5% last summer. 10-year treasury yields have since recovered to 1.1%, which is still extremely low in historical terms. Given the Fed’s own forecast for Fed funds rate and the continuing increase in the Fed balance sheet, we see little risk for a sharp spike in long-dated rates in the medium term. While there is a risk in the short term of rates’ spiking in a broader market correction, our expectation is that the Fed would intervene if rates rose to quickly. Any spike in nominal rates is therefore likely to be short lived.
Inflation expectations
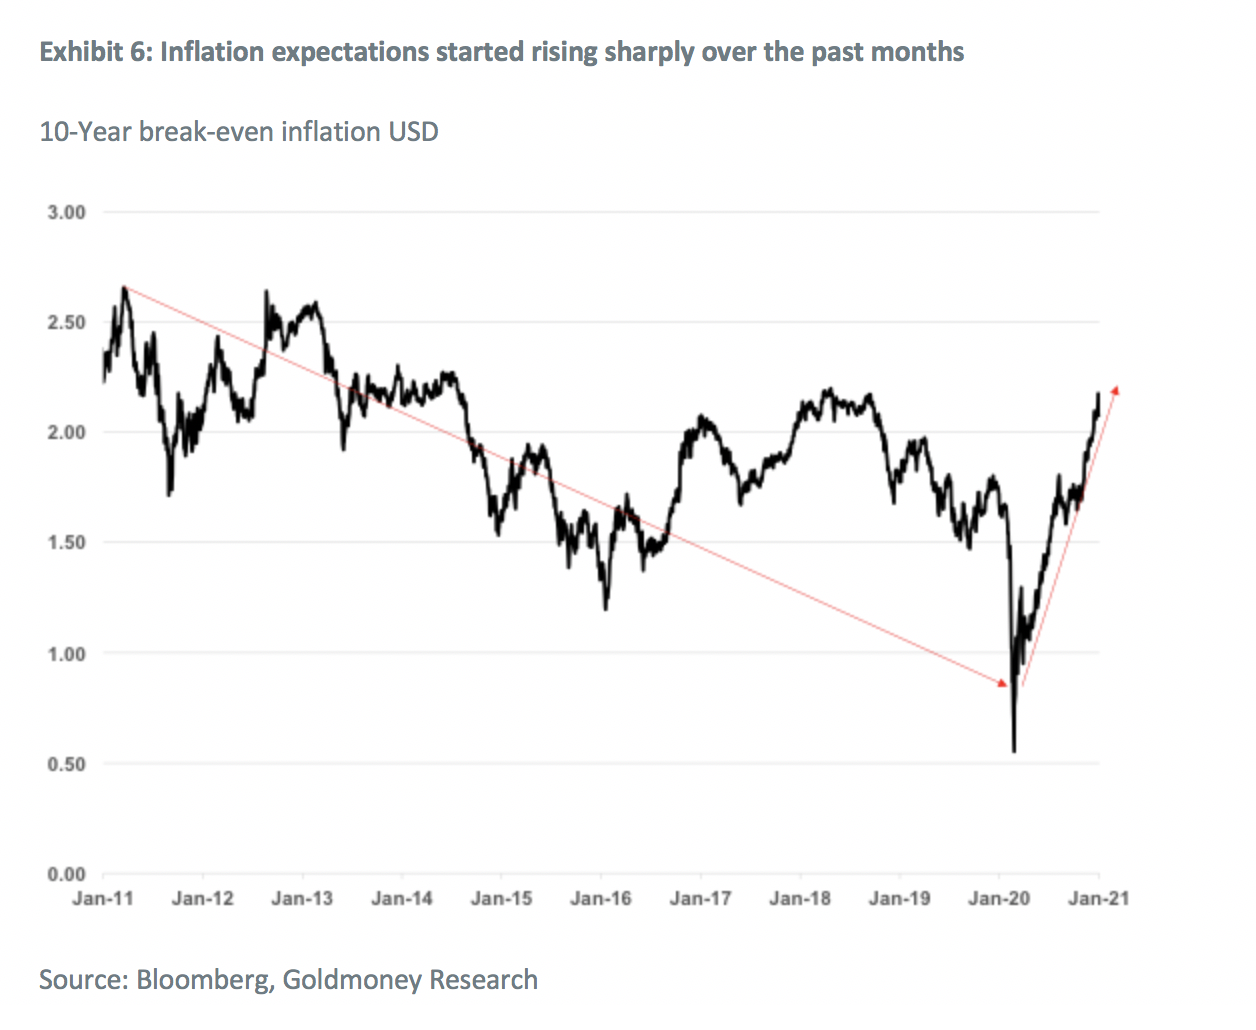
As we have highlighted above, real-interest rate expectations are a combination of nominal long-term rates and long-term inflation expectations. Break-even inflation expectations had collapsed in early 2020 as the Covid19 Pandemic unfolded and dropped as low as 0.55% in March 2020. However, since then, inflation expectations have been rising sharply, reaching multi-year highs and seemly reversing the long-term trend that started around 2011 (See Exhibit 6).
Real-interest rate expectations
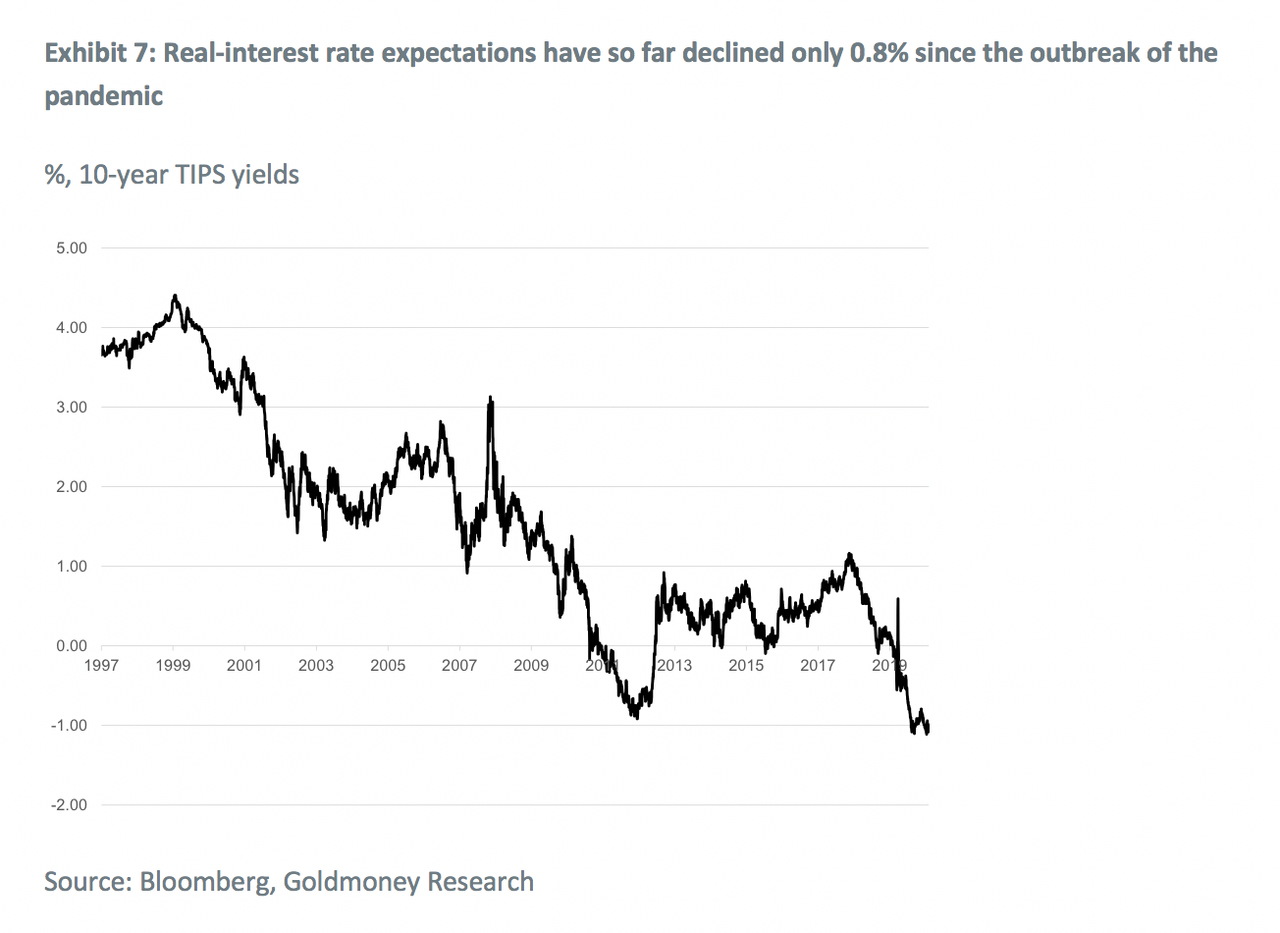
Given our current expectations for central bank policy, we do see limited risk for inflation expectations to reverse this trend anytime soon. Thus, as we expect downward pressure on nominal yields to persist in the medium term – in line with historical patterns in the aftermath of a recession – and inflation expectations are unlikely to reverse and likely to continue to rise, in our view, real-interest rate expectations have significantly more downside risk than upside risk. Real-interest rate expectations declined by more than 3.5% from their top in 2007 to the bottom in 2012. Since the pandemic started, real-interest rates have only declined by 0.8% so far (see Exhibit 7).
Quantitative easing
In addition, as we have shown in our gold price framework, quantities easing (QE) alters the relationship between real-interest rate expectations and gold. QE is a central bank policy tool to push real-interest rates down even as nominal rates approach zero. However, QE has a positive impact on gold prices beyond their impact on real-interest rate expectations. In other words, QE leads to lower real-interest rate expectations, which pushed gold higher. However, the actual price impact is larger than what can be explained by the move in real-interest rate expectations alone.
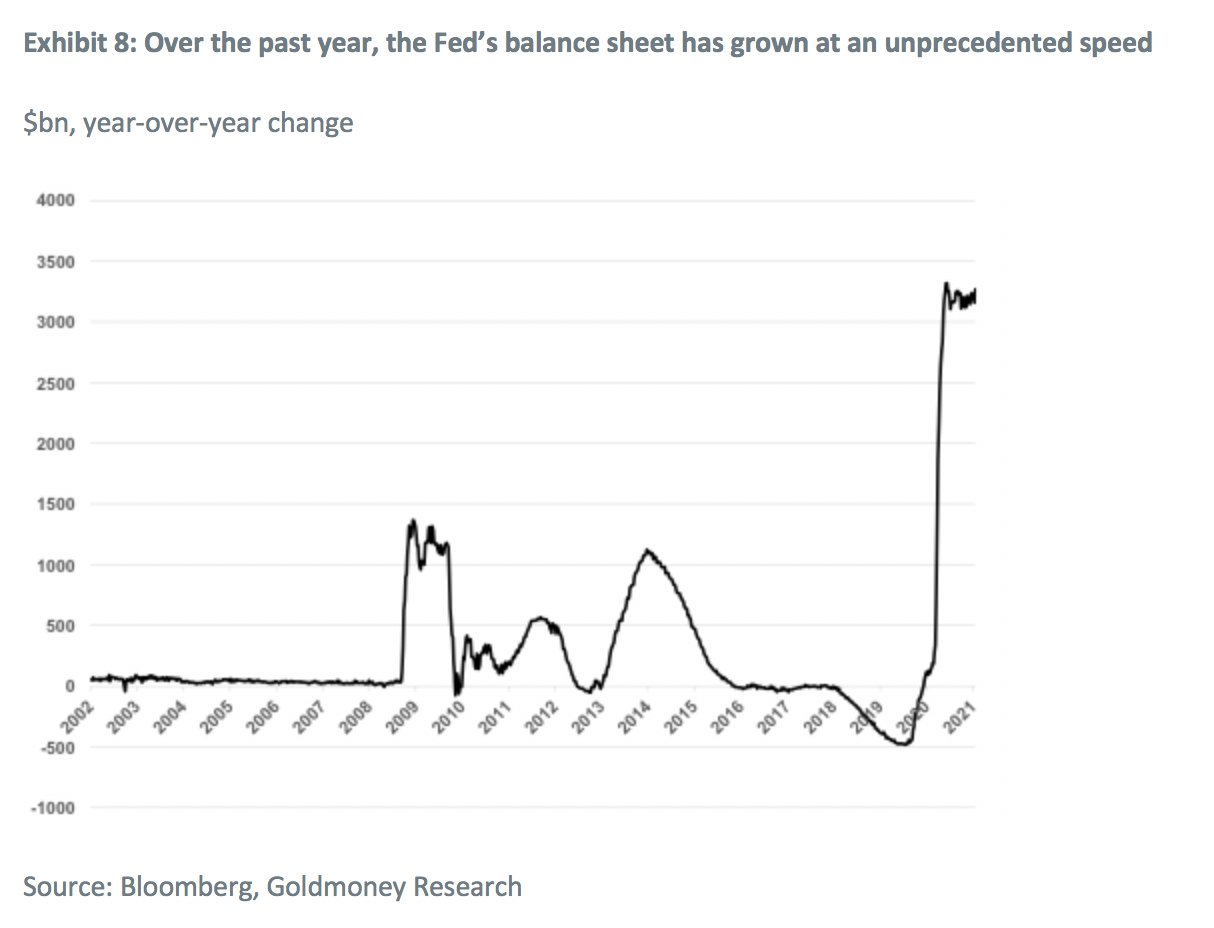
As nominal interest rates where already very low in early 2020, there was very little leeway for central banks to react by slashing rates. Instead, they accelerated their QE programs at an unprecedented speed. For example, it took the Fed seven years of QE to increase its balance sheet by $3.6tn, from $900bn in 2008 to $4.5tn by 2015. It took just three months to get from $4.3tn in March 2020 to $7.2tn in June 2020 (see Exhibit 8). While asset purchases have slowed down, the Fed has still been adding around $20bn per week to its balance sheets.
Our model tells us that gold prices so far have been trading in line with the level of real-interest rate expectations and QE. This may be surprising to some, as they have expected gold to have underperformed given the extreme environment we are currently in.
We expect gold prices to remain well supported in the medium term. The risks from both real-interest rate expectations and QE are squarely skewed to the upside. However, this upside skew is much stronger now than it was when we concluded that gold had entered a new cycle in 2015. In fact, in our view, gold has explosive upside risk as real-interest rate expectations can move sharply lower if inflation expectations remain on the current upside trend.
Longer-dated energy prices have also reached a trough and the medium-term trend is up
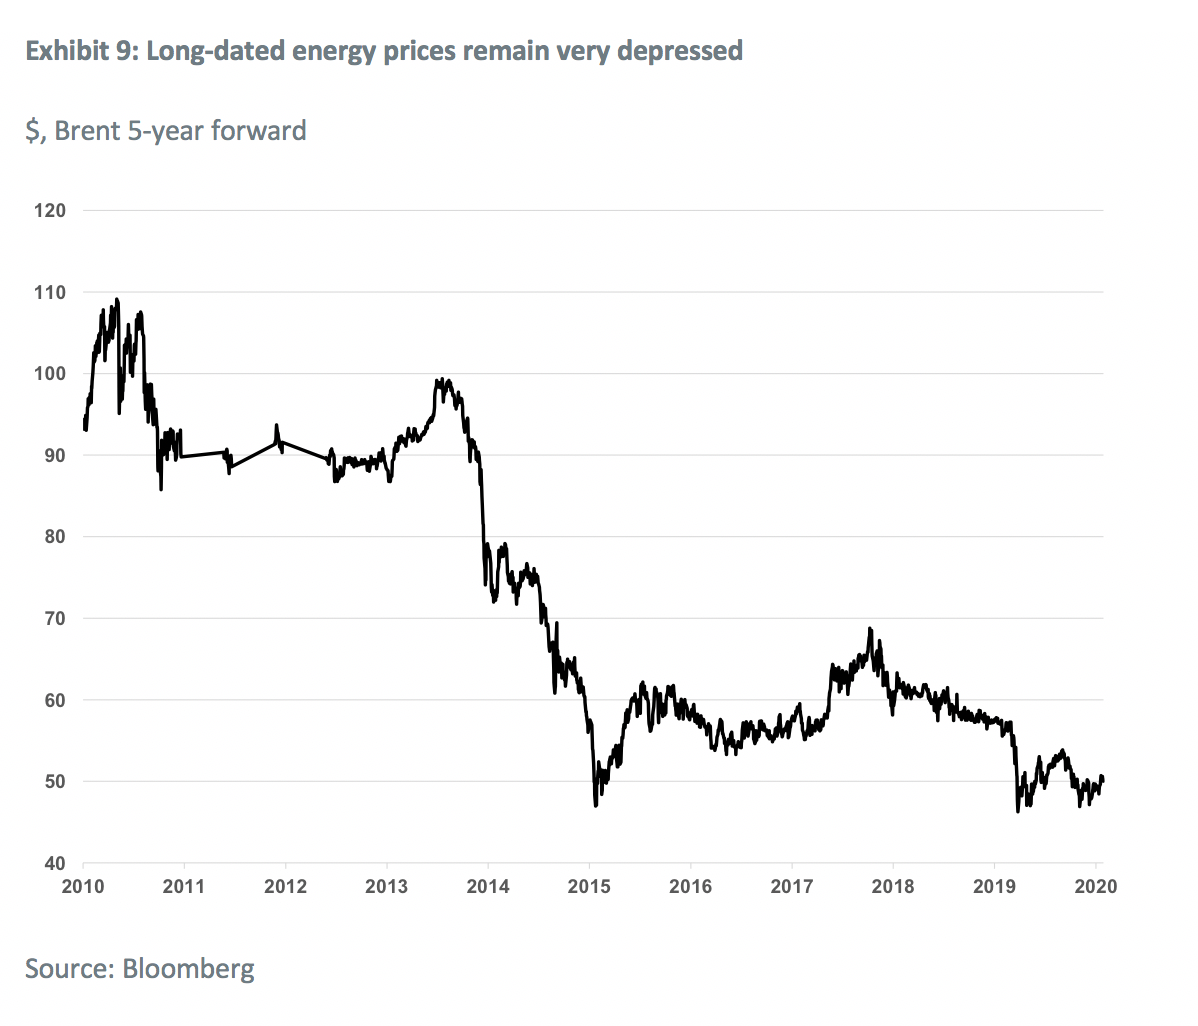
In addition to this, longer-dated energy prices have collapsed earlier last year as demand for oil and other energy commodities suffered an unprecedented decline. While longer-dated oil prices (and other energy commodities) have since recovered, they are still far below pre-pandemic levels (see Exhibit 9). Importantly, energy supply has also seen the largest contraction on record. While the demand impact is expected to be transitory in nature, the supply impact is likely to be longer lasting. This is a fertile ground for energy price inflation over the medium term. We explore this more in an upcoming report.
The unfolding of the current gold price cycle over the medium term
On net, we think we are still in the beginning of the current gold price cycle. While there remain some near-term risk from a spike in nominal rates (potentially triggered by a sharp correction in equity markets), we think central banks are ready to step in and act quickly, limiting the upside to nominal rates. The medium-term outlook for real-interest rate expectations and QE is very positive for gold in our view, and long-dated energy prices present some further upside risk.
Should real-interest rates fall to a similar extent as they have historically in the aftermath of a recession, that alone would push gold prices to around $2600-3100. Such a move over the entire gold price cycle would be in line with the 2008-2011 move of around 270% from bottom to top. Importantly, this scenario would still not assume a sharp pick up of inflation.
Uncategorized
Industrial Production Increased 0.1% in February
From the Fed: Industrial Production and Capacity Utilization
Industrial production edged up 0.1 percent in February after declining 0.5 percent in January. In February, the output of manufacturing rose 0.8 percent and the index for mining climbed 2.2 p…
Share this:


Industrial production edged up 0.1 percent in February after declining 0.5 percent in January. In February, the output of manufacturing rose 0.8 percent and the index for mining climbed 2.2 percent. Both gains partly reflected recoveries from weather-related declines in January. The index for utilities fell 7.5 percent in February because of warmer-than-typical temperatures. At 102.3 percent of its 2017 average, total industrial production in February was 0.2 percent below its year-earlier level. Capacity utilization for the industrial sector remained at 78.3 percent in February, a rate that is 1.3 percentage points below its long-run (1972–2023) average.
emphasis added
 Click on graph for larger image.
This graph shows Capacity Utilization. This series is up from the record low set in April 2020, and above the level in February 2020 (pre-pandemic).
Capacity utilization at 78.3% is 1.3% below the average from 1972 to 2022. This was below consensus expectations.
Note: y-axis doesn't start at zero to better show the change.
 The second graph shows industrial production since 1967.
Industrial production increased to 102.3. This is above the pre-pandemic level.
Industrial production was above consensus expectations.
International
Fuel poverty in England is probably 2.5 times higher than government statistics show
The top 40% most energy efficient homes aren’t counted as being in fuel poverty, no matter what their bills or income are.
Share this:


The cap set on how much UK energy suppliers can charge for domestic gas and electricity is set to fall by 15% from April 1 2024. Despite this, prices remain shockingly high. The average household energy bill in 2023 was £2,592 a year, dwarfing the pre-pandemic average of £1,308 in 2019.
The term “fuel poverty” refers to a household’s ability to afford the energy required to maintain adequate warmth and the use of other essential appliances. Quite how it is measured varies from country to country. In England, the government uses what is known as the low income low energy efficiency (Lilee) indicator.
Since energy costs started rising sharply in 2021, UK households’ spending powers have plummeted. It would be reasonable to assume that these increasingly hostile economic conditions have caused fuel poverty rates to rise.
However, according to the Lilee fuel poverty metric, in England there have only been modest changes in fuel poverty incidence year on year. In fact, government statistics show a slight decrease in the nationwide rate, from 13.2% in 2020 to 13.0% in 2023.
Our recent study suggests that these figures are incorrect. We estimate the rate of fuel poverty in England to be around 2.5 times higher than what the government’s statistics show, because the criteria underpinning the Lilee estimation process leaves out a large number of financially vulnerable households which, in reality, are unable to afford and maintain adequate warmth.

Energy security
In 2022, we undertook an in-depth analysis of Lilee fuel poverty in Greater London. First, we combined fuel poverty, housing and employment data to provide an estimate of vulnerable homes which are omitted from Lilee statistics.
We also surveyed 2,886 residents of Greater London about their experiences of fuel poverty during the winter of 2022. We wanted to gauge energy security, which refers to a type of self-reported fuel poverty. Both parts of the study aimed to demonstrate the potential flaws of the Lilee definition.
Introduced in 2019, the Lilee metric considers a household to be “fuel poor” if it meets two criteria. First, after accounting for energy expenses, its income must fall below the poverty line (which is 60% of median income).
Second, the property must have an energy performance certificate (EPC) rating of D–G (the lowest four ratings). The government’s apparent logic for the Lilee metric is to quicken the net-zero transition of the housing sector.
In Sustainable Warmth, the policy paper that defined the Lilee approach, the government says that EPC A–C-rated homes “will not significantly benefit from energy-efficiency measures”. Hence, the focus on fuel poverty in D–G-rated properties.
Generally speaking, EPC A–C-rated homes (those with the highest three ratings) are considered energy efficient, while D–G-rated homes are deemed inefficient. The problem with how Lilee fuel poverty is measured is that the process assumes that EPC A–C-rated homes are too “energy efficient” to be considered fuel poor: the main focus of the fuel poverty assessment is a characteristic of the property, not the occupant’s financial situation.
In other words, by this metric, anyone living in an energy-efficient home cannot be considered to be in fuel poverty, no matter their financial situation. There is an obvious flaw here.
Around 40% of homes in England have an EPC rating of A–C. According to the Lilee definition, none of these homes can or ever will be classed as fuel poor. Even though energy prices are going through the roof, a single-parent household with dependent children whose only income is universal credit (or some other form of benefits) will still not be considered to be living in fuel poverty if their home is rated A-C.
The lack of protection afforded to these households against an extremely volatile energy market is highly concerning.
In our study, we estimate that 4.4% of London’s homes are rated A-C and also financially vulnerable. That is around 171,091 households, which are currently omitted by the Lilee metric but remain highly likely to be unable to afford adequate energy.
In most other European nations, what is known as the 10% indicator is used to gauge fuel poverty. This metric, which was also used in England from the 1990s until the mid 2010s, considers a home to be fuel poor if more than 10% of income is spent on energy. Here, the main focus of the fuel poverty assessment is the occupant’s financial situation, not the property.
Were such alternative fuel poverty metrics to be employed, a significant portion of those 171,091 households in London would almost certainly qualify as fuel poor.
This is confirmed by the findings of our survey. Our data shows that 28.2% of the 2,886 people who responded were “energy insecure”. This includes being unable to afford energy, making involuntary spending trade-offs between food and energy, and falling behind on energy payments.
Worryingly, we found that the rate of energy insecurity in the survey sample is around 2.5 times higher than the official rate of fuel poverty in London (11.5%), as assessed according to the Lilee metric.
It is likely that this figure can be extrapolated for the rest of England. If anything, energy insecurity may be even higher in other regions, given that Londoners tend to have higher-than-average household income.
The UK government is wrongly omitting hundreds of thousands of English households from fuel poverty statistics. Without a more accurate measure, vulnerable households will continue to be overlooked and not get the assistance they desperately need to stay warm.
Torran Semple receives funding from Engineering and Physical Sciences Research Council (EPSRC) grant EP/S023305/1.
John Harvey does not work for, consult, own shares in or receive funding from any company or organisation that would benefit from this article, and has disclosed no relevant affiliations beyond their academic appointment.
european uk pandemicUncategorized
Southwest and United Airlines have bad news for passengers
Both airlines are facing the same problem, one that could lead to higher airfares and fewer flight options.
Share this:


Airlines operate in a market that's dictated by supply and demand: If more people want to fly a specific route than there are available seats, then tickets on those flights cost more.
That makes scheduling and predicting demand a huge part of maximizing revenue for airlines. There are, however, numerous factors that go into how airlines decide which flights to put on the schedule.
Related: Major airline faces Chapter 11 bankruptcy concerns
Every airport has only a certain number of gates, flight slots and runway capacity, limiting carriers' flexibility. That's why during times of high demand — like flights to Las Vegas during Super Bowl week — do not usually translate to airlines sending more planes to and from that destination.
Airlines generally do try to add capacity every year. That's become challenging as Boeing has struggled to keep up with demand for new airplanes. If you can't add airplanes, you can't grow your business. That's caused problems for the entire industry.
Every airline retires planes each year. In general, those get replaced by newer, better models that offer more efficiency and, in most cases, better passenger amenities.
If an airline can't get the planes it had hoped to add to its fleet in a given year, it can face capacity problems. And it's a problem that both Southwest Airlines (LUV) and United Airlines have addressed in a way that's inevitable but bad for passengers.
Image source: Kevin Dietsch/Getty Images
Southwest slows down its pilot hiring
In 2023, Southwest made a huge push to hire pilots. The airline lost thousands of pilots to retirement during the covid pandemic and it needed to replace them in order to build back to its 2019 capacity.
The airline successfully did that but will not continue that trend in 2024.
"Southwest plans to hire approximately 350 pilots this year, and no new-hire classes are scheduled after this month," Travel Weekly reported. "Last year, Southwest hired 1,916 pilots, according to pilot recruitment advisory firm Future & Active Pilot Advisors. The airline hired 1,140 pilots in 2022."
The slowdown in hiring directly relates to the airline expecting to grow capacity only in the low-single-digits percent in 2024.
"Moving into 2024, there is continued uncertainty around the timing of expected Boeing deliveries and the certification of the Max 7 aircraft. Our fleet plans remain nimble and currently differs from our contractual order book with Boeing," Southwest Airlines Chief Financial Officer Tammy Romo said during the airline's fourth-quarter-earnings call.
"We are planning for 79 aircraft deliveries this year and expect to retire roughly 45 700 and 4 800, resulting in a net expected increase of 30 aircraft this year."
That's very modest growth, which should not be enough of an increase in capacity to lower prices in any significant way.
United Airlines pauses pilot hiring
Boeing's (BA) struggles have had wide impact across the industry. United Airlines has also said it was going to pause hiring new pilots through the end of May.
United (UAL) Fight Operations Vice President Marc Champion explained the situation in a memo to the airline's staff.
"As you know, United has hundreds of new planes on order, and while we remain on path to be the fastest-growing airline in the industry, we just won't grow as fast as we thought we would in 2024 due to continued delays at Boeing," he said.
"For example, we had contractual deliveries for 80 Max 10s this year alone, but those aircraft aren't even certified yet, and it's impossible to know when they will arrive."
That's another blow to consumers hoping that multiple major carriers would grow capacity, putting pressure on fares. Until Boeing can get back on track, it's unlikely that competition between the large airlines will lead to lower fares.
In fact, it's possible that consumer demand will grow more than airline capacity which could push prices higher.
Related: Veteran fund manager picks favorite stocks for 2024
bankruptcy pandemic stocks

Key shipping company files for Chapter 11 bankruptcy


Net Zero, The Digital Panopticon, & The Future Of Food


Pharma industry reputation remains steady at a ‘new normal’ after Covid, Harris Poll finds


These Cities Have The Highest (And Lowest) Share Of Unaffordable Neighborhoods In 2024


Problems After COVID-19 Vaccination More Prevalent Among Naturally Immune: Study


For-profit nursing homes are cutting corners on safety and draining resources with financial shenanigans − especially at midsize chains that dodge public scrutiny


Tight inventory and frustrated buyers challenge agents in Virginia


The Question You Should Ask Whenever You’re Wrong


Trump nearly derailed democracy once − here’s what to watch out for in reelection campaign


Looking Back At COVID’s Authoritarian Regimes
-

 Uncategorized3 weeks ago
All Of The Elements Are In Place For An Economic Crisis Of Staggering Proportions
-

 International1 week ago
EyePoint poaches medical chief from Apellis; Sandoz CFO, longtime BioNTech exec to retire
-

 Uncategorized4 weeks ago
California Counties Could Be Forced To Pay $300 Million To Cover COVID-Era Program
-

 Uncategorized3 weeks ago
Apparel Retailer Express Moving Toward Bankruptcy
-

 Uncategorized4 weeks ago
Industrial Production Decreased 0.1% in January
-

 International7 days ago
Walmart launches clever answer to Target’s new membership program
-

 Spread & Containment2 days ago
IFM’s Hat Trick and Reflections On Option-To-Buy M&A
-

 Uncategorized4 weeks ago
RFK Jr: The Wuhan Cover-Up & The Rise Of The Biowarfare-Industrial Complex