Uncategorized
Global USB 3.0 Market to Reach $18.5 Billion by 2030
Global USB 3.0 Market to Reach $18.5 Billion by 2030
PR Newswire
NEW YORK, March 14, 2023
NEW YORK, March 14, 2023 /PRNewswire/ — The global economy is at a critical crossroads with a number of interlocking challenges and crises running in paralle…
Share this:

Global USB 3.0 Market to Reach $18.5 Billion by 2030
PR Newswire
NEW YORK, March 14, 2023
NEW YORK, March 14, 2023 /PRNewswire/ -- The global economy is at a critical crossroads with a number of interlocking challenges and crises running in parallel. The uncertainty around how Russia`s war on Ukraine will play out this year and the war`s role in creating global instability means that the trouble on the inflation front is not over yet. Food and fuel inflation will remain a persistent economic problem. Higher retail inflation will impact consumer confidence and spending. As governments combat inflation by raising interest rates, new job creation will slowdown and impact economic activity and growth. Lower capital expenditure is in the offing as companies go slow on investments, held back by inflation worries and weaker demand. With slower growth and high inflation, developed markets seem primed to enter into a recession. Fears of new COVID outbreaks and China's already uncertain post-pandemic path poses a real risk of the world experiencing more acute supply chain pain and manufacturing disruptions this year. Volatile financial markets, growing trade tensions, stricter regulatory environment and pressure to mainstream climate change into economic decisions will compound the complexity of challenges faced. Year 2023 is expected to be tough year for most markets, investors and consumers. Nevertheless, there is always opportunity for businesses and their leaders who can chart a path forward with resilience and adaptability.
Read the full report: https://www.reportlinker.com/p01171467/?utm_source=PRN
Global USB 3.0 Market to Reach $18.5 Billion by 2030
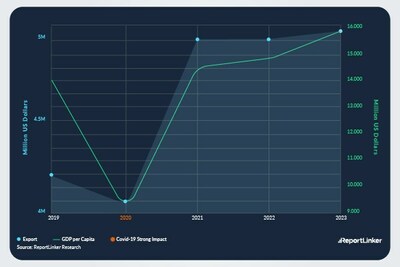
In the changed post COVID-19 business landscape, the global market for USB 3.0 estimated at US$4.4 Billion in the year 2022, is projected to reach a revised size of US$18.5 Billion by 2030, growing at aCAGR of 19.8% over the period 2022-2030. Chip-on-Board, one of the segments analyzed in the report, is projected to record 25% CAGR and reach US$14.1 Billion by the end of the analysis period. Taking into account the ongoing post pandemic recovery, growth in the Conventional segment is readjusted to a revised 10.4% CAGR for the next 8-year period.
The U.S. Market is Estimated at $1.2 Billion, While China is Forecast to Grow at 27.9% CAGR
The USB 3.0 market in the U.S. is estimated at US$1.2 Billion in the year 2022. China, the world`s second largest economy, is forecast to reach a projected market size of US$5.2 Billion by the year 2030 trailing a CAGR of 27.9% over the analysis period 2022 to 2030. Among the other noteworthy geographic markets are Japan and Canada, each forecast to grow at 12% and 16.3% respectively over the 2022-2030 period. Within Europe, Germany is forecast to grow at approximately 13.9% CAGR.
Select Competitors (Total 74 Featured)
- ADATA Technology Co. Ltd.
- Corsair Components Inc.
- Dexxon Group - Emtec
- ELECOM Co. Ltd.
- Gigastone Corporation
- HP Inc.
- Kingston Technology Company
- Monster Digital Inc.
- Patriot Memory LLC
- Samsung Electronics Co., Ltd.
- SanDisk Corporation
- Sony Corporation
- Toshiba Corporation
- Transcend Information Inc.
Read the full report: https://www.reportlinker.com/p01171467/?utm_source=PRN
I. METHODOLOGY
II. EXECUTIVE SUMMARY
1. MARKET OVERVIEW
Influencer Market Insights
World Market Trajectories
Impact of Covid-19 and a Looming Global Recession
A Prelude
Recent Market Activity
USB - An Evolution to 3.0
USB 3.0 Vs USB 2.0: A Comparative Analysis
USB 3.0 Vs USB 2.0: Comparison of Data Transfer Rates by File Size
USB 3.0 - Global Key Competitors Percentage Market Share in
2022 (E)
Competitive Market Presence - Strong/Active/Niche/Trivial for
Players Worldwide in 2022 (E)
2. FOCUS ON SELECT PLAYERS
ADATA Technology Co., Ltd. (Taiwan)
Corsair Components, Inc. (USA)
ELECOM Co., Ltd. (Japan)
EMTEC (France)
Gigastone Corporation (Taiwan)
HP, Inc. (USA)
Kingston Technology Company (USA)
Monster Digital, Inc. (USA)
Patriot Memory LLC (USA)
Samsung Electronics Co., Ltd. (South Korea)
Sony Corporation (Japan)
SanDisk Corporation (USA)
Toshiba Corporation (Japan)
Transcend Information, Inc. (Taiwan)
Verbatim Corporation (USA)
3. MARKET TRENDS & DRIVERS
Widespread Availability of Enabled Devices Drives the Market
Efficient Battery Maintenance - Business Case for USB 3.0
Backward Compatibility - A Marked Trait from Previous Versions
USB 3.0 Gears Up for Upward Growth
Opportunity Indicator:
Key Statistical Data:
Growing Demand for USB 3.0 Interface to Benefit USB 3.0 Chips
Market
PC Segment - The Early Adopter of USB 3.0 Interface
Rising Data Portability Needs Drive USB 3.0
USB 3.0 Flash Drives Make the Cut in Storage Market
Opportunity Indicators:
USB 3.0 High-Bandwidth Storage Devices - A Major Draw
Consumer Entertainment & Communication Devices Lap Up USB 3.0
Smartphones Phones - USB Type C Threat on the Anvil
USB 3.0 Takes Center Stage in Camera-Based Applications
Camera Interfaces: A Comparative Analysis
USB 3.0 Widens Footprint in Wide Range of Peripheral Devices
USB 3.0 in Switched Device Access
USB 3.0 Universal Docking Chipsets Attract Consumer Attention
in 4K Applications
USB 3.0 Chipmakers Turn to USB Hub Business
USB 3.0 Host ICs Market to Become More Competitive
Declining Costs to Drive Volume Sales
Developing Markets to Turbo Charge Future Growth
USB 3.0 Devices to Face Early 'In-House' Competition from USB 3.1
SSDs and Premium USB Drives - Vying for the Same Consumer
'Thunderbolt & Thunderbolt 2' - How Big is the Threat?
Will Cloud Services Pose Threat to USB Interface Technologies?
Cloud's Early Stage Status in Data Storage Market to Help USB
3.0 in Retaining Market Traction
Market Share Finding
4. GLOBAL MARKET PERSPECTIVE
Table 1: World Recent Past, Current & Future Analysis for Below
4 GB by Geographic Region - USA, Canada, Japan, China, Europe,
Asia-Pacific, Latin America, Middle East and Africa Markets -
Independent Analysis of Annual Sales in US$ Million for Years
2022 through 2030 and % CAGR
Table 2: World Historic Review for Below 4 GB by Geographic
Region - USA, Canada, Japan, China, Europe, Asia-Pacific, Latin
America, Middle East and Africa Markets - Independent Analysis
of Annual Sales in US$ Million for Years 2014 through 2021 and
% CAGR
Table 3: World 16-Year Perspective for Below 4 GB by Geographic
Region - Percentage Breakdown of Value Sales for USA, Canada,
Japan, China, Europe, Asia-Pacific, Latin America, Middle East
and Africa for Years 2014, 2023 & 2030
Table 4: World Recent Past, Current & Future Analysis for 128
GB by Geographic Region - USA, Canada, Japan, China, Europe,
Asia-Pacific, Latin America, Middle East and Africa Markets -
Independent Analysis of Annual Sales in US$ Million for Years
2022 through 2030 and % CAGR
Table 5: World Historic Review for 128 GB by Geographic Region -
USA, Canada, Japan, China, Europe, Asia-Pacific, Latin
America, Middle East and Africa Markets - Independent Analysis
of Annual Sales in US$ Million for Years 2014 through 2021 and
% CAGR
Table 6: World 16-Year Perspective for 128 GB by Geographic
Region - Percentage Breakdown of Value Sales for USA, Canada,
Japan, China, Europe, Asia-Pacific, Latin America, Middle East
and Africa for Years 2014, 2023 & 2030
Table 7: World Recent Past, Current & Future Analysis for 256
GB & Above by Geographic Region - USA, Canada, Japan, China,
Europe, Asia-Pacific, Latin America, Middle East and Africa
Markets - Independent Analysis of Annual Sales in US$ Million
for Years 2022 through 2030 and % CAGR
Table 8: World Historic Review for 256 GB & Above by Geographic
Region - USA, Canada, Japan, China, Europe, Asia-Pacific, Latin
America, Middle East and Africa Markets - Independent Analysis
of Annual Sales in US$ Million for Years 2014 through 2021 and
% CAGR
Table 9: World 16-Year Perspective for 256 GB & Above by
Geographic Region - Percentage Breakdown of Value Sales for
USA, Canada, Japan, China, Europe, Asia-Pacific, Latin America,
Middle East and Africa for Years 2014, 2023 & 2030
Table 10: World Recent Past, Current & Future Analysis for USB
3.0 by Geographic Region - USA, Canada, Japan, China, Europe,
Asia-Pacific, Latin America, Middle East and Africa Markets -
Independent Analysis of Annual Sales in US$ Million for Years
2022 through 2030 and % CAGR
Table 11: World Historic Review for USB 3.0 by Geographic
Region - USA, Canada, Japan, China, Europe, Asia-Pacific, Latin
America, Middle East and Africa Markets - Independent Analysis
of Annual Sales in US$ Million for Years 2014 through 2021 and
% CAGR
Table 12: World 16-Year Perspective for USB 3.0 by Geographic
Region - Percentage Breakdown of Value Sales for USA, Canada,
Japan, China, Europe, Asia-Pacific, Latin America, Middle East
and Africa Markets for Years 2014, 2023 & 2030
Table 13: World Recent Past, Current & Future Analysis for
Chip-on-Board by Geographic Region - USA, Canada, Japan, China,
Europe, Asia-Pacific, Latin America, Middle East and Africa
Markets - Independent Analysis of Annual Sales in US$ Million
for Years 2022 through 2030 and % CAGR
Table 14: World Historic Review for Chip-on-Board by Geographic
Region - USA, Canada, Japan, China, Europe, Asia-Pacific, Latin
America, Middle East and Africa Markets - Independent Analysis
of Annual Sales in US$ Million for Years 2014 through 2021 and
% CAGR
Table 15: World 16-Year Perspective for Chip-on-Board by
Geographic Region - Percentage Breakdown of Value Sales for
USA, Canada, Japan, China, Europe, Asia-Pacific, Latin America,
Middle East and Africa for Years 2014, 2023 & 2030
Table 16: World Recent Past, Current & Future Analysis for
Conventional by Geographic Region - USA, Canada, Japan, China,
Europe, Asia-Pacific, Latin America, Middle East and Africa
Markets - Independent Analysis of Annual Sales in US$ Million
for Years 2022 through 2030 and % CAGR
Table 17: World Historic Review for Conventional by Geographic
Region - USA, Canada, Japan, China, Europe, Asia-Pacific, Latin
America, Middle East and Africa Markets - Independent Analysis
of Annual Sales in US$ Million for Years 2014 through 2021 and
% CAGR
Table 18: World 16-Year Perspective for Conventional by
Geographic Region - Percentage Breakdown of Value Sales for
USA, Canada, Japan, China, Europe, Asia-Pacific, Latin America,
Middle East and Africa for Years 2014, 2023 & 2030
Table 19: World Recent Past, Current & Future Analysis for 4 -
16 GB by Geographic Region - USA, Canada, Japan, China, Europe,
Asia-Pacific, Latin America, Middle East and Africa Markets -
Independent Analysis of Annual Sales in US$ Million for Years
2022 through 2030 and % CAGR
Table 20: World Historic Review for 4 - 16 GB by Geographic
Region - USA, Canada, Japan, China, Europe, Asia-Pacific, Latin
America, Middle East and Africa Markets - Independent Analysis
of Annual Sales in US$ Million for Years 2014 through 2021 and
% CAGR
Table 21: World 16-Year Perspective for 4 - 16 GB by Geographic
Region - Percentage Breakdown of Value Sales for USA, Canada,
Japan, China, Europe, Asia-Pacific, Latin America, Middle East
and Africa for Years 2014, 2023 & 2030
Table 22: World Recent Past, Current & Future Analysis for 16 -
64 GB by Geographic Region - USA, Canada, Japan, China, Europe,
Asia-Pacific, Latin America, Middle East and Africa Markets -
Independent Analysis of Annual Sales in US$ Million for Years
2022 through 2030 and % CAGR
Table 23: World Historic Review for 16 - 64 GB by Geographic
Region - USA, Canada, Japan, China, Europe, Asia-Pacific, Latin
America, Middle East and Africa Markets - Independent Analysis
of Annual Sales in US$ Million for Years 2014 through 2021 and
% CAGR
Table 24: World 16-Year Perspective for 16 - 64 GB by
Geographic Region - Percentage Breakdown of Value Sales for
USA, Canada, Japan, China, Europe, Asia-Pacific, Latin America,
Middle East and Africa for Years 2014, 2023 & 2030
Table 25: World USB 3.0 Market Analysis of Annual Sales in US$
Million for Years 2014 through 2030
III. MARKET ANALYSIS
UNITED STATES
USB 3.0 Market Presence - Strong/Active/Niche/Trivial - Key
Competitors in the United States for 2023 (E)
Table 26: USA Recent Past, Current & Future Analysis for USB
3.0 by Capacity - Below 4 GB, 4 - 16 GB, 16 - 64 GB, 128 GB and
256 GB & Above - Independent Analysis of Annual Sales in US$
Million for the Years 2022 through 2030 and % CAGR
Table 27: USA Historic Review for USB 3.0 by Capacity - Below 4
GB, 4 - 16 GB, 16 - 64 GB, 128 GB and 256 GB & Above Markets -
Independent Analysis of Annual Sales in US$ Million for Years
2014 through 2021 and % CAGR
Table 28: USA 16-Year Perspective for USB 3.0 by Capacity -
Percentage Breakdown of Value Sales for Below 4 GB, 4 - 16 GB,
16 - 64 GB, 128 GB and 256 GB & Above for the Years 2014, 2023 &
2030
Table 29: USA Recent Past, Current & Future Analysis for USB
3.0 by Production Method - Chip-on-Board and Conventional -
Independent Analysis of Annual Sales in US$ Million for the
Years 2022 through 2030 and % CAGR
Table 30: USA Historic Review for USB 3.0 by Production Method -
Chip-on-Board and Conventional Markets - Independent Analysis
of Annual Sales in US$ Million for Years 2014 through 2021 and
% CAGR
Table 31: USA 16-Year Perspective for USB 3.0 by Production
Method - Percentage Breakdown of Value Sales for Chip-on-Board
and Conventional for the Years 2014, 2023 & 2030
CANADA
Table 32: Canada Recent Past, Current & Future Analysis for USB
3.0 by Capacity - Below 4 GB, 4 - 16 GB, 16 - 64 GB, 128 GB and
256 GB & Above - Independent Analysis of Annual Sales in US$
Million for the Years 2022 through 2030 and % CAGR
Table 33: Canada Historic Review for USB 3.0 by Capacity -
Below 4 GB, 4 - 16 GB, 16 - 64 GB, 128 GB and 256 GB & Above
Markets - Independent Analysis of Annual Sales in US$ Million
for Years 2014 through 2021 and % CAGR
Table 34: Canada 16-Year Perspective for USB 3.0 by Capacity -
Percentage Breakdown of Value Sales for Below 4 GB, 4 - 16 GB,
16 - 64 GB, 128 GB and 256 GB & Above for the Years 2014, 2023 &
2030
Table 35: Canada Recent Past, Current & Future Analysis for USB
3.0 by Production Method - Chip-on-Board and Conventional -
Independent Analysis of Annual Sales in US$ Million for the
Years 2022 through 2030 and % CAGR
Table 36: Canada Historic Review for USB 3.0 by Production
Method - Chip-on-Board and Conventional Markets - Independent
Analysis of Annual Sales in US$ Million for Years 2014 through
2021 and % CAGR
Table 37: Canada 16-Year Perspective for USB 3.0 by Production
Method - Percentage Breakdown of Value Sales for Chip-on-Board
and Conventional for the Years 2014, 2023 & 2030
JAPAN
USB 3.0 Market Presence - Strong/Active/Niche/Trivial - Key
Competitors in Japan for 2023 (E)
Table 38: Japan Recent Past, Current & Future Analysis for USB
3.0 by Capacity - Below 4 GB, 4 - 16 GB, 16 - 64 GB, 128 GB and
256 GB & Above - Independent Analysis of Annual Sales in US$
Million for the Years 2022 through 2030 and % CAGR
Table 39: Japan Historic Review for USB 3.0 by Capacity - Below
4 GB, 4 - 16 GB, 16 - 64 GB, 128 GB and 256 GB & Above Markets -
Independent Analysis of Annual Sales in US$ Million for Years
2014 through 2021 and % CAGR
Table 40: Japan 16-Year Perspective for USB 3.0 by Capacity -
Percentage Breakdown of Value Sales for Below 4 GB, 4 - 16 GB,
16 - 64 GB, 128 GB and 256 GB & Above for the Years 2014, 2023 &
2030
Table 41: Japan Recent Past, Current & Future Analysis for USB
3.0 by Production Method - Chip-on-Board and Conventional -
Independent Analysis of Annual Sales in US$ Million for the
Years 2022 through 2030 and % CAGR
Table 42: Japan Historic Review for USB 3.0 by Production
Method - Chip-on-Board and Conventional Markets - Independent
Analysis of Annual Sales in US$ Million for Years 2014 through
2021 and % CAGR
Table 43: Japan 16-Year Perspective for USB 3.0 by Production
Method - Percentage Breakdown of Value Sales for Chip-on-Board
and Conventional for the Years 2014, 2023 & 2030
CHINA
USB 3.0 Market Presence - Strong/Active/Niche/Trivial - Key
Competitors in China for 2023 (E)
Table 44: China Recent Past, Current & Future Analysis for USB
3.0 by Capacity - Below 4 GB, 4 - 16 GB, 16 - 64 GB, 128 GB and
256 GB & Above - Independent Analysis of Annual Sales in US$
Million for the Years 2022 through 2030 and % CAGR
Table 45: China Historic Review for USB 3.0 by Capacity - Below
4 GB, 4 - 16 GB, 16 - 64 GB, 128 GB and 256 GB & Above Markets -
Independent Analysis of Annual Sales in US$ Million for Years
2014 through 2021 and % CAGR
Table 46: China 16-Year Perspective for USB 3.0 by Capacity -
Percentage Breakdown of Value Sales for Below 4 GB, 4 - 16 GB,
16 - 64 GB, 128 GB and 256 GB & Above for the Years 2014, 2023 &
2030
Table 47: China Recent Past, Current & Future Analysis for USB
3.0 by Production Method - Chip-on-Board and Conventional -
Independent Analysis of Annual Sales in US$ Million for the
Years 2022 through 2030 and % CAGR
Table 48: China Historic Review for USB 3.0 by Production
Method - Chip-on-Board and Conventional Markets - Independent
Analysis of Annual Sales in US$ Million for Years 2014 through
2021 and % CAGR
Table 49: China 16-Year Perspective for USB 3.0 by Production
Method - Percentage Breakdown of Value Sales for Chip-on-Board
and Conventional for the Years 2014, 2023 & 2030
EUROPE
USB 3.0 Market Presence - Strong/Active/Niche/Trivial - Key
Competitors in Europe for 2023 (E)
Table 50: Europe Recent Past, Current & Future Analysis for USB
3.0 by Capacity - Below 4 GB, 4 - 16 GB, 16 - 64 GB, 128 GB and
256 GB & Above - Independent Analysis of Annual Sales in US$
Million for the Years 2022 through 2030 and % CAGR
Table 51: Europe Historic Review for USB 3.0 by Capacity -
Below 4 GB, 4 - 16 GB, 16 - 64 GB, 128 GB and 256 GB & Above
Markets - Independent Analysis of Annual Sales in US$ Million
for Years 2014 through 2021 and % CAGR
Table 52: Europe 16-Year Perspective for USB 3.0 by Capacity -
Percentage Breakdown of Value Sales for Below 4 GB, 4 - 16 GB,
16 - 64 GB, 128 GB and 256 GB & Above for the Years 2014, 2023 &
2030
Table 53: Europe Recent Past, Current & Future Analysis for USB
3.0 by Geographic Region - France, Germany, Italy, UK, Spain,
Russia and Rest of Europe Markets - Independent Analysis of
Annual Sales in US$ Million for Years 2022 through 2030 and %
CAGR
Table 54: Europe Historic Review for USB 3.0 by Geographic
Region - France, Germany, Italy, UK, Spain, Russia and Rest of
Europe Markets - Independent Analysis of Annual Sales in US$
Million for Years 2014 through 2021 and % CAGR
Table 55: Europe 16-Year Perspective for USB 3.0 by Geographic
Region - Percentage Breakdown of Value Sales for France,
Germany, Italy, UK, Spain, Russia and Rest of Europe Markets
for Years 2014, 2023 & 2030
Table 56: Europe Recent Past, Current & Future Analysis for USB
3.0 by Production Method - Chip-on-Board and Conventional -
Independent Analysis of Annual Sales in US$ Million for the
Years 2022 through 2030 and % CAGR
Table 57: Europe Historic Review for USB 3.0 by Production
Method - Chip-on-Board and Conventional Markets - Independent
Analysis of Annual Sales in US$ Million for Years 2014 through
2021 and % CAGR
Table 58: Europe 16-Year Perspective for USB 3.0 by Production
Method - Percentage Breakdown of Value Sales for Chip-on-Board
and Conventional for the Years 2014, 2023 & 2030
FRANCE
USB 3.0 Market Presence - Strong/Active/Niche/Trivial - Key
Competitors in France for 2023 (E)
Table 59: France Recent Past, Current & Future Analysis for USB
3.0 by Capacity - Below 4 GB, 4 - 16 GB, 16 - 64 GB, 128 GB and
256 GB & Above - Independent Analysis of Annual Sales in US$
Million for the Years 2022 through 2030 and % CAGR
Table 60: France Historic Review for USB 3.0 by Capacity -
Below 4 GB, 4 - 16 GB, 16 - 64 GB, 128 GB and 256 GB & Above
Markets - Independent Analysis of Annual Sales in US$ Million
for Years 2014 through 2021 and % CAGR
Table 61: France 16-Year Perspective for USB 3.0 by Capacity -
Percentage Breakdown of Value Sales for Below 4 GB, 4 - 16 GB,
16 - 64 GB, 128 GB and 256 GB & Above for the Years 2014, 2023 &
2030
Table 62: France Recent Past, Current & Future Analysis for USB
3.0 by Production Method - Chip-on-Board and Conventional -
Independent Analysis of Annual Sales in US$ Million for the
Years 2022 through 2030 and % CAGR
Table 63: France Historic Review for USB 3.0 by Production
Method - Chip-on-Board and Conventional Markets - Independent
Analysis of Annual Sales in US$ Million for Years 2014 through
2021 and % CAGR
Table 64: France 16-Year Perspective for USB 3.0 by Production
Method - Percentage Breakdown of Value Sales for Chip-on-Board
and Conventional for the Years 2014, 2023 & 2030
GERMANY
USB 3.0 Market Presence - Strong/Active/Niche/Trivial - Key
Competitors in Germany for 2023 (E)
Table 65: Germany Recent Past, Current & Future Analysis for
USB 3.0 by Capacity - Below 4 GB, 4 - 16 GB, 16 - 64 GB, 128 GB
and 256 GB & Above - Independent Analysis of Annual Sales in
US$ Million for the Years 2022 through 2030 and % CAGR
Table 66: Germany Historic Review for USB 3.0 by Capacity -
Below 4 GB, 4 - 16 GB, 16 - 64 GB, 128 GB and 256 GB & Above
Markets - Independent Analysis of Annual Sales in US$ Million
for Years 2014 through 2021 and % CAGR
Table 67: Germany 16-Year Perspective for USB 3.0 by Capacity -
Percentage Breakdown of Value Sales for Below 4 GB, 4 - 16 GB,
16 - 64 GB, 128 GB and 256 GB & Above for the Years 2014, 2023 &
2030
Table 68: Germany Recent Past, Current & Future Analysis for
USB 3.0 by Production Method - Chip-on-Board and Conventional -
Independent Analysis of Annual Sales in US$ Million for the
Years 2022 through 2030 and % CAGR
Table 69: Germany Historic Review for USB 3.0 by Production
Method - Chip-on-Board and Conventional Markets - Independent
Analysis of Annual Sales in US$ Million for Years 2014 through
2021 and % CAGR
Table 70: Germany 16-Year Perspective for USB 3.0 by Production
Method - Percentage Breakdown of Value Sales for Chip-on-Board
and Conventional for the Years 2014, 2023 & 2030
ITALY
Table 71: Italy Recent Past, Current & Future Analysis for USB
3.0 by Capacity - Below 4 GB, 4 - 16 GB, 16 - 64 GB, 128 GB and
256 GB & Above - Independent Analysis of Annual Sales in US$
Million for the Years 2022 through 2030 and % CAGR
Table 72: Italy Historic Review for USB 3.0 by Capacity - Below
4 GB, 4 - 16 GB, 16 - 64 GB, 128 GB and 256 GB & Above Markets -
Independent Analysis of Annual Sales in US$ Million for Years
2014 through 2021 and % CAGR
Table 73: Italy 16-Year Perspective for USB 3.0 by Capacity -
Percentage Breakdown of Value Sales for Below 4 GB, 4 - 16 GB,
16 - 64 GB, 128 GB and 256 GB & Above for the Years 2014, 2023 &
2030
Table 74: Italy Recent Past, Current & Future Analysis for USB
3.0 by Production Method - Chip-on-Board and Conventional -
Independent Analysis of Annual Sales in US$ Million for the
Years 2022 through 2030 and % CAGR
Table 75: Italy Historic Review for USB 3.0 by Production
Method - Chip-on-Board and Conventional Markets - Independent
Analysis of Annual Sales in US$ Million for Years 2014 through
2021 and % CAGR
Table 76: Italy 16-Year Perspective for USB 3.0 by Production
Method - Percentage Breakdown of Value Sales for Chip-on-Board
and Conventional for the Years 2014, 2023 & 2030
UNITED KINGDOM
USB 3.0 Market Presence - Strong/Active/Niche/Trivial - Key
Competitors in the United Kingdom for 2023 (E)
Table 77: UK Recent Past, Current & Future Analysis for USB 3.0
by Capacity - Below 4 GB, 4 - 16 GB, 16 - 64 GB, 128 GB and 256
GB & Above - Independent Analysis of Annual Sales in US$
Million for the Years 2022 through 2030 and % CAGR
Table 78: UK Historic Review for USB 3.0 by Capacity - Below 4
GB, 4 - 16 GB, 16 - 64 GB, 128 GB and 256 GB & Above Markets -
Independent Analysis of Annual Sales in US$ Million for Years
2014 through 2021 and % CAGR
Table 79: UK 16-Year Perspective for USB 3.0 by Capacity -
Percentage Breakdown of Value Sales for Below 4 GB, 4 - 16 GB,
16 - 64 GB, 128 GB and 256 GB & Above for the Years 2014, 2023 &
2030
Table 80: UK Recent Past, Current & Future Analysis for USB 3.0
by Production Method - Chip-on-Board and Conventional -
Independent Analysis of Annual Sales in US$ Million for the
Years 2022 through 2030 and % CAGR
Table 81: UK Historic Review for USB 3.0 by Production Method -
Chip-on-Board and Conventional Markets - Independent Analysis
of Annual Sales in US$ Million for Years 2014 through 2021 and
% CAGR
Table 82: UK 16-Year Perspective for USB 3.0 by Production
Method - Percentage Breakdown of Value Sales for Chip-on-Board
and Conventional for the Years 2014, 2023 & 2030
SPAIN
Table 83: Spain Recent Past, Current & Future Analysis for USB
3.0 by Capacity - Below 4 GB, 4 - 16 GB, 16 - 64 GB, 128 GB and
256 GB & Above - Independent Analysis of Annual Sales in US$
Million for the Years 2022 through 2030 and % CAGR
Table 84: Spain Historic Review for USB 3.0 by Capacity - Below
4 GB, 4 - 16 GB, 16 - 64 GB, 128 GB and 256 GB & Above Markets -
Independent Analysis of Annual Sales in US$ Million for Years
2014 through 2021 and % CAGR
Table 85: Spain 16-Year Perspective for USB 3.0 by Capacity -
Percentage Breakdown of Value Sales for Below 4 GB, 4 - 16 GB,
16 - 64 GB, 128 GB and 256 GB & Above for the Years 2014, 2023 &
2030
Table 86: Spain Recent Past, Current & Future Analysis for USB
3.0 by Production Method - Chip-on-Board and Conventional -
Independent Analysis of Annual Sales in US$ Million for the
Years 2022 through 2030 and % CAGR
Table 87: Spain Historic Review for USB 3.0 by Production
Method - Chip-on-Board and Conventional Markets - Independent
Analysis of Annual Sales in US$ Million for Years 2014 through
2021 and % CAGR
Table 88: Spain 16-Year Perspective for USB 3.0 by Production
Method - Percentage Breakdown of Value Sales for Chip-on-Board
and Conventional for the Years 2014, 2023 & 2030
RUSSIA
Table 89: Russia Recent Past, Current & Future Analysis for USB
3.0 by Capacity - Below 4 GB, 4 - 16 GB, 16 - 64 GB, 128 GB and
256 GB & Above - Independent Analysis of Annual Sales in US$
Million for the Years 2022 through 2030 and % CAGR
Table 90: Russia Historic Review for USB 3.0 by Capacity -
Below 4 GB, 4 - 16 GB, 16 - 64 GB, 128 GB and 256 GB & Above
Markets - Independent Analysis of Annual Sales in US$ Million
for Years 2014 through 2021 and % CAGR
Table 91: Russia 16-Year Perspective for USB 3.0 by Capacity -
Percentage Breakdown of Value Sales for Below 4 GB, 4 - 16 GB,
16 - 64 GB, 128 GB and 256 GB & Above for the Years 2014, 2023 &
2030
Table 92: Russia Recent Past, Current & Future Analysis for USB
3.0 by Production Method - Chip-on-Board and Conventional -
Independent Analysis of Annual Sales in US$ Million for the
Years 2022 through 2030 and % CAGR
Table 93: Russia Historic Review for USB 3.0 by Production
Method - Chip-on-Board and Conventional Markets - Independent
Analysis of Annual Sales in US$ Million for Years 2014 through
2021 and % CAGR
Table 94: Russia 16-Year Perspective for USB 3.0 by Production
Method - Percentage Breakdown of Value Sales for Chip-on-Board
and Conventional for the Years 2014, 2023 & 2030
REST OF EUROPE
Table 95: Rest of Europe Recent Past, Current & Future Analysis
for USB 3.0 by Capacity - Below 4 GB, 4 - 16 GB, 16 - 64 GB,
128 GB and 256 GB & Above - Independent Analysis of Annual
Sales in US$ Million for the Years 2022 through 2030 and % CAGR
Table 96: Rest of Europe Historic Review for USB 3.0 by
Capacity - Below 4 GB, 4 - 16 GB, 16 - 64 GB, 128 GB and 256 GB &
Above Markets - Independent Analysis of Annual Sales in US$
Million for Years 2014 through 2021 and % CAGR
Table 97: Rest of Europe 16-Year Perspective for USB 3.0 by
Capacity - Percentage Breakdown of Value Sales for Below 4 GB,
4 - 16 GB, 16 - 64 GB, 128 GB and 256 GB & Above for the Years
2014, 2023 & 2030
Table 98: Rest of Europe Recent Past, Current & Future Analysis
for USB 3.0 by Production Method - Chip-on-Board and
Conventional - Independent Analysis of Annual Sales in US$
Million for the Years 2022 through 2030 and % CAGR
Table 99: Rest of Europe Historic Review for USB 3.0 by
Production Method - Chip-on-Board and Conventional Markets -
Independent Analysis of Annual Sales in US$ Million for Years
2014 through 2021 and % CAGR
Table 100: Rest of Europe 16-Year Perspective for USB 3.0 by
Production Method - Percentage Breakdown of Value Sales for
Chip-on-Board and Conventional for the Years 2014, 2023 & 2030
ASIA-PACIFIC
USB 3.0 Market Presence - Strong/Active/Niche/Trivial - Key
Competitors in Asia-Pacific for 2023 (E)
Table 101: Asia-Pacific Recent Past, Current & Future Analysis
for USB 3.0 by Capacity - Below 4 GB, 4 - 16 GB, 16 - 64 GB,
128 GB and 256 GB & Above - Independent Analysis of Annual
Sales in US$ Million for the Years 2022 through 2030 and % CAGR
Table 102: Asia-Pacific Historic Review for USB 3.0 by Capacity -
Below 4 GB, 4 - 16 GB, 16 - 64 GB, 128 GB and 256 GB & Above
Markets - Independent Analysis of Annual Sales in US$ Million
for Years 2014 through 2021 and % CAGR
Table 103: Asia-Pacific 16-Year Perspective for USB 3.0 by
Capacity - Percentage Breakdown of Value Sales for Below 4 GB,
4 - 16 GB, 16 - 64 GB, 128 GB and 256 GB & Above for the Years
2014, 2023 & 2030
Table 104: Asia-Pacific Recent Past, Current & Future Analysis
for USB 3.0 by Geographic Region - Australia, India, South
Korea and Rest of Asia-Pacific Markets - Independent Analysis
of Annual Sales in US$ Million for Years 2022 through 2030 and
% CAGR
Table 105: Asia-Pacific Historic Review for USB 3.0 by
Geographic Region - Australia, India, South Korea and Rest of
Asia-Pacific Markets - Independent Analysis of Annual Sales in
US$ Million for Years 2014 through 2021 and % CAGR
Table 106: Asia-Pacific 16-Year Perspective for USB 3.0 by
Geographic Region - Percentage Breakdown of Value Sales for
Australia, India, South Korea and Rest of Asia-Pacific Markets
for Years 2014, 2023 & 2030
Table 107: Asia-Pacific Recent Past, Current & Future Analysis
for USB 3.0 by Production Method - Chip-on-Board and
Conventional - Independent Analysis of Annual Sales in US$
Million for the Years 2022 through 2030 and % CAGR
Table 108: Asia-Pacific Historic Review for USB 3.0 by
Production Method - Chip-on-Board and Conventional Markets -
Independent Analysis of Annual Sales in US$ Million for Years
2014 through 2021 and % CAGR
Table 109: Asia-Pacific 16-Year Perspective for USB 3.0 by
Production Method - Percentage Breakdown of Value Sales for
Chip-on-Board and Conventional for the Years 2014, 2023 & 2030
AUSTRALIA
USB 3.0 Market Presence - Strong/Active/Niche/Trivial - Key
Competitors in Australia for 2023 (E)
Table 110: Australia Recent Past, Current & Future Analysis for
USB 3.0 by Capacity - Below 4 GB, 4 - 16 GB, 16 - 64 GB, 128 GB
and 256 GB & Above - Independent Analysis of Annual Sales in
US$ Million for the Years 2022 through 2030 and % CAGR
Table 111: Australia Historic Review for USB 3.0 by Capacity -
Below 4 GB, 4 - 16 GB, 16 - 64 GB, 128 GB and 256 GB & Above
Markets - Independent Analysis of Annual Sales in US$ Million
for Years 2014 through 2021 and % CAGR
Table 112: Australia 16-Year Perspective for USB 3.0 by
Capacity - Percentage Breakdown of Value Sales for Below 4 GB,
4 - 16 GB, 16 - 64 GB, 128 GB and 256 GB & Above for the Years
2014, 2023 & 2030
Table 113: Australia Recent Past, Current & Future Analysis for
USB 3.0 by Production Method - Chip-on-Board and Conventional -
Independent Analysis of Annual Sales in US$ Million for the
Years 2022 through 2030 and % CAGR
Table 114: Australia Historic Review for USB 3.0 by Production
Method - Chip-on-Board and Conventional Markets - Independent
Analysis of Annual Sales in US$ Million for Years 2014 through
2021 and % CAGR
Table 115: Australia 16-Year Perspective for USB 3.0 by
Production Method - Percentage Breakdown of Value Sales for
Chip-on-Board and Conventional for the Years 2014, 2023 & 2030
INDIA
USB 3.0 Market Presence - Strong/Active/Niche/Trivial - Key
Competitors in India for 2023 (E)
Table 116: India Recent Past, Current & Future Analysis for USB
3.0 by Capacity - Below 4 GB, 4 - 16 GB, 16 - 64 GB, 128 GB and
256 GB & Above - Independent Analysis of Annual Sales in US$
Million for the Years 2022 through 2030 and % CAGR
Table 117: India Historic Review for USB 3.0 by Capacity -
Below 4 GB, 4 - 16 GB, 16 - 64 GB, 128 GB and 256 GB & Above
Markets - Independent Analysis of Annual Sales in US$ Million
for Years 2014 through 2021 and % CAGR
Table 118: India 16-Year Perspective for USB 3.0 by Capacity -
Percentage Breakdown of Value Sales for Below 4 GB, 4 - 16 GB,
16 - 64 GB, 128 GB and 256 GB & Above for the Years 2014, 2023 &
2030
Table 119: India Recent Past, Current & Future Analysis for USB
3.0 by Production Method - Chip-on-Board and Conventional -
Independent Analysis of Annual Sales in US$ Million for the
Years 2022 through 2030 and % CAGR
Table 120: India Historic Review for USB 3.0 by Production
Method - Chip-on-Board and Conventional Markets - Independent
Analysis of Annual Sales in US$ Million for Years 2014 through
2021 and % CAGR
Table 121: India 16-Year Perspective for USB 3.0 by Production
Method - Percentage Breakdown of Value Sales for Chip-on-Board
and Conventional for the Years 2014, 2023 & 2030
SOUTH KOREA
Table 122: South Korea Recent Past, Current & Future Analysis
for USB 3.0 by Capacity - Below 4 GB, 4 - 16 GB, 16 - 64 GB,
128 GB and 256 GB & Above - Independent Analysis of Annual
Sales in US$ Million for the Years 2022 through 2030 and % CAGR
Table 123: South Korea Historic Review for USB 3.0 by Capacity -
Below 4 GB, 4 - 16 GB, 16 - 64 GB, 128 GB and 256 GB & Above
Markets - Independent Analysis of Annual Sales in US$ Million
for Years 2014 through 2021 and % CAGR
Table 124: South Korea 16-Year Perspective for USB 3.0 by
Capacity - Percentage Breakdown of Value Sales for Below 4 GB,
4 - 16 GB, 16 - 64 GB, 128 GB and 256 GB & Above for the Years
2014, 2023 & 2030
Table 125: South Korea Recent Past, Current & Future Analysis
for USB 3.0 by Production Method - Chip-on-Board and
Conventional - Independent Analysis of Annual Sales in US$
Million for the Years 2022 through 2030 and % CAGR
Table 126: South Korea Historic Review for USB 3.0 by
Production Method - Chip-on-Board and Conventional Markets -
Independent Analysis of Annual Sales in US$ Million for Years
2014 through 2021 and % CAGR
Table 127: South Korea 16-Year Perspective for USB 3.0 by
Production Method - Percentage Breakdown of Value Sales for
Chip-on-Board and Conventional for the Years 2014, 2023 & 2030
REST OF ASIA-PACIFIC
Table 128: Rest of Asia-Pacific Recent Past, Current & Future
Please contact our Customer Support Center to get the complete Table of Contents
Read the full report: https://www.reportlinker.com/p01171467/?utm_source=PRN
About Reportlinker
ReportLinker is an award-winning market research solution. Reportlinker finds and organizes the latest industry data so you get all the market research you need - instantly, in one place.
Contact Clare: clare@reportlinker.com
US: (339)-368-6001
Intl: +1 339-368-6001
View original content to download multimedia:https://www.prnewswire.com/news-releases/global-usb-3-0-market-to-reach-18-5-billion-by-2030--301768790.html
SOURCE Reportlinker
Uncategorized
One more airline cracks down on lounge crowding in a way you won’t like
Qantas Airways is increasing the price of accessing its network of lounges by as much as 17%.
Share this:


Over the last two years, multiple airlines have dealt with crowding in their lounges. While they are designed as a luxury experience for a small subset of travelers, high numbers of people taking a trip post-pandemic as well as the different ways they are able to gain access through status or certain credit cards made it difficult for some airlines to keep up with keeping foods stocked, common areas clean and having enough staff to serve bar drinks at the rate that customers expect them.
In the fall of 2023, Delta Air Lines (DAL) caught serious traveler outcry after announcing that it was cracking down on crowding by raising how much one needs to spend for lounge access and limiting the number of times one can enter those lounges.
Related: Competitors pushed Delta to backtrack on its lounge and loyalty program changes
Some airlines saw the outcry with Delta as their chance to reassure customers that they would not raise their fees while others waited for the storm to pass to quietly implement their own increases.
Shutterstock
This is how much more you'll have to pay for Qantas lounge access
Australia's flagship carrier Qantas Airways (QUBSF) is the latest airline to announce that it would raise the cost accessing the 24 lounges across the country as well as the 600 international lounges available at airports across the world through partner airlines.
More Travel:
- A new travel term is taking over the internet (and reaching airlines and hotels)
- The 10 best airline stocks to buy now
- Airlines see a new kind of traveler at the front of the plane
Unlike other airlines which grant access primarily after reaching frequent flyer status, Qantas also sells it through a membership — starting from April 18, 2024, prices will rise from $600 Australian dollars ($392 USD) to $699 AUD ($456 USD) for one year, $1,100 ($718 USD) to $1,299 ($848 USD) for two years and $2,000 AUD ($1,304) to lock in the rate for four years.
Those signing up for lounge access for the first time also currently pay a joining fee of $99 AUD ($65 USD) that will rise to $129 AUD ($85 USD).
The airline also allows customers to purchase their membership with Qantas Points they collect through frequent travel; the membership fees are also being raised by the equivalent amount in points in what adds up to as much as 17% — from 308,000 to 399,900 to lock in access for four years.
Airline says hikes will 'cover cost increases passed on from suppliers'
"This is the first time the Qantas Club membership fees have increased in seven years and will help cover cost increases passed on from a range of suppliers over that time," a Qantas spokesperson confirmed to Simple Flying. "This follows a reduction in the membership fees for several years during the pandemic."
The spokesperson said the gains from the increases will go both towards making up for inflation-related costs and keeping existing lounges looking modern by updating features like furniture and décor.
While the price increases also do not apply for those who earned lounge access through frequent flyer status or change what it takes to earn that status, Qantas is also introducing even steeper increases for those renewing a membership or adding additional features such as spouse and partner memberships.
In some cases, the cost of these features will nearly double from what members are paying now.
stocks pandemicUncategorized
Star Wars icon gives his support to Disney, Bob Iger
Disney shareholders have a huge decision to make on April 3.
Share this:

Disney's (DIS) been facing some headwinds up top, but its leadership just got backing from one of the company's more prominent investors.
Star Wars creator George Lucas put out of statement in support of the company's current leadership team, led by CEO Bob Iger, ahead of the April 3 shareholders meeting which will see investors vote on the company's 12-member board.
"Creating magic is not for amateurs," Lucas said in a statement. "When I sold Lucasfilm just over a decade ago, I was delighted to become a Disney shareholder because of my long-time admiration for its iconic brand and Bob Iger’s leadership. When Bob recently returned to the company during a difficult time, I was relieved. No one knows Disney better. I remain a significant shareholder because I have full faith and confidence in the power of Disney and Bob’s track record of driving long-term value. I have voted all of my shares for Disney’s 12 directors and urge other shareholders to do the same."
Related: Disney stands against Nelson Peltz as leadership succession plan heats up
Lucasfilm was acquired by Disney for $4 billion in 2012 — notably under the first term of Iger. He received over 37 million in shares of Disney during the acquisition.
Lucas' statement seems to be an attempt to push investors away from the criticism coming from The Trian Partners investment group, led by Nelson Peltz. The group, owns about $3 million in shares of the media giant, is pushing two candidates for positions on the board, which are Peltz and former Disney CFO Jay Rasulo.
Peltz and Co. have called out a pair of Disney directors — Michael Froman and Maria Elena Lagomasino — for their lack of experience in the media space.
Related: Women's basketball is gaining ground, but is March Madness ready to rival the men's game?
Blackwells Capital is also pushing three of its candidates to take seats during the early April shareholder meeting, though Reuters has reported that the firm has been supportive of the company's current direction.
Disney has struggled in recent years amid the changes in media and the effects of the pandemic — which triggered the return of Iger at the helm in late 2022. After going through mass layoffs in the spring of 2023 and focusing on key growth brands, the company has seen a steady recovery with its stock up over 25% year-to-date and around 40% for the last six months.
Related: Veteran fund manager picks favorite stocks for 2024
stocks pandemic recoveryUncategorized
Another airline is making lounge fees more expensive
Qantas Airways is increasing the price of accessing its network of lounges by as much as 17%.
Share this:

Over the last two years, multiple airlines have dealt with crowding in their lounges. While they are designed as a luxury experience for a small subset of travelers, high numbers of people taking a trip post-pandemic as well as the different ways they are able to gain access through status or certain credit cards made it difficult for some airlines to keep up with keeping foods stocked, common areas clean and having enough staff to serve bar drinks at the rate that customers expect them.
In the fall of 2023, Delta Air Lines (DAL) caught serious traveler outcry after announcing that it was cracking down on crowding by raising how much one needs to spend for lounge access and limiting the number of times one can enter those lounges.
Related: Competitors pushed Delta to backtrack on its lounge and loyalty program changes
Some airlines saw the outcry with Delta as their chance to reassure customers that they would not raise their fees while others waited for the storm to pass to quietly implement their own increases.
Shutterstock
This is how much more you'll have to pay for Qantas lounge access
Australia's flagship carrier Qantas Airways (QUBSF) is the latest airline to announce that it would raise the cost accessing the 24 lounges across the country as well as the 600 international lounges available at airports across the world through partner airlines.
More Travel:
- A new travel term is taking over the internet (and reaching airlines and hotels)
- The 10 best airline stocks to buy now
- Airlines see a new kind of traveler at the front of the plane
Unlike other airlines which grant access primarily after reaching frequent flyer status, Qantas also sells it through a membership — starting from April 18, 2024, prices will rise from $600 Australian dollars ($392 USD) to $699 AUD ($456 USD) for one year, $1,100 ($718 USD) to $1,299 ($848 USD) for two years and $2,000 AUD ($1,304) to lock in the rate for four years.
Those signing up for lounge access for the first time also currently pay a joining fee of $99 AUD ($65 USD) that will rise to $129 AUD ($85 USD).
The airline also allows customers to purchase their membership with Qantas Points they collect through frequent travel; the membership fees are also being raised by the equivalent amount in points in what adds up to as much as 17% — from 308,000 to 399,900 to lock in access for four years.
Airline says hikes will 'cover cost increases passed on from suppliers'
"This is the first time the Qantas Club membership fees have increased in seven years and will help cover cost increases passed on from a range of suppliers over that time," a Qantas spokesperson confirmed to Simple Flying. "This follows a reduction in the membership fees for several years during the pandemic."
The spokesperson said the gains from the increases will go both towards making up for inflation-related costs and keeping existing lounges looking modern by updating features like furniture and décor.
While the price increases also do not apply for those who earned lounge access through frequent flyer status or change what it takes to earn that status, Qantas is also introducing even steeper increases for those renewing a membership or adding additional features such as spouse and partner memberships.
In some cases, the cost of these features will nearly double from what members are paying now.
stocks pandemic

Manufacturing and construction vs. the still-inverted yield curve


When words make you sick


How much stress is too much? A psychiatrist explains the links between toxic stress and poor health − and how to get help


Caitlin Clark, Coach Prime, and Linsanity: The Anatomy of a Viewership ‘Craze’


PR55α-controlled PP2A Inhibits p16 Expression and Blocks Cellular Senescence Induction


Half Of Downtown Pittsburgh Office Space Could Be Empty In 4 Years


US Economic Conditions Scream “Buy Gold”


Wall Street Bonuses Fall For Second Year To 2019 Lows Amid Capital Markets Freeze


One more airline cracks down on lounge crowding in a way you won’t like


Airline, travel companies face Chapter 11 bankruptcy, default risk
-

 Spread & Containment7 days ago
IFM’s Hat Trick and Reflections On Option-To-Buy M&A
-

 Uncategorized4 weeks ago
All Of The Elements Are In Place For An Economic Crisis Of Staggering Proportions
-

 International2 weeks ago
EyePoint poaches medical chief from Apellis; Sandoz CFO, longtime BioNTech exec to retire
-

 Uncategorized1 month ago
California Counties Could Be Forced To Pay $300 Million To Cover COVID-Era Program
-

 Uncategorized4 weeks ago
Apparel Retailer Express Moving Toward Bankruptcy
-

 Uncategorized1 month ago
Industrial Production Decreased 0.1% in January
-

 International2 weeks ago
Walmart launches clever answer to Target’s new membership program
-

 Uncategorized1 month ago
RFK Jr: The Wuhan Cover-Up & The Rise Of The Biowarfare-Industrial Complex