Connect with us

Uncategorized

Global Outdoor Furniture Market to Reach $35.1 Billion by 2030

Global Outdoor Furniture Market to Reach $35.1 Billion by 2030
PR Newswire
NEW YORK, March 14, 2023

NEW YORK, March 14, 2023 /PRNewswire/ — The global economy is at a critical crossroads with a number of interlocking challenges and crises running …

Published

on

Global Outdoor Furniture Market to Reach $35.1 Billion by 2030

PR Newswire

NEW YORK, March 14, 2023 /PRNewswire/ -- The global economy is at a critical crossroads with a number of interlocking challenges and crises running in parallel. The uncertainty around how Russia`s war on Ukraine will play out this year and the war`s role in creating global instability means that the trouble on the inflation front is not over yet. Food and fuel inflation will remain a persistent economic problem. Higher retail inflation will impact consumer confidence and spending. As governments combat inflation by raising interest rates, new job creation will slowdown and impact economic activity and growth. Lower capital expenditure is in the offing as companies go slow on investments, held back by inflation worries and weaker demand. With slower growth and high inflation, developed markets seem primed to enter into a recession. Fears of new COVID outbreaks and China's already uncertain post-pandemic path poses a real risk of the world experiencing more acute supply chain pain and manufacturing disruptions this year. Volatile financial markets, growing trade tensions, stricter regulatory environment and pressure to mainstream climate change into economic decisions will compound the complexity of challenges faced. Year 2023 is expected to be tough year for most markets, investors and consumers. Nevertheless, there is always opportunity for businesses and their leaders who can chart a path forward with resilience and adaptability.

Read the full report: https://www.reportlinker.com/p0397792/?utm_source=PRN

Global Outdoor Furniture Market to Reach $35.1 Billion by 2030

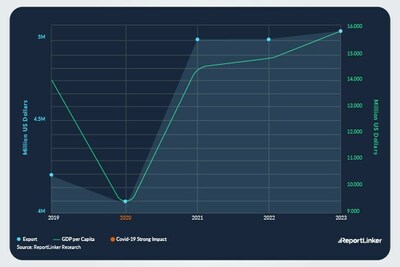
In the changed post COVID-19 business landscape, the global market for Outdoor Furniture estimated at US$17.4 Billion in the year 2022, is projected to reach a revised size of US$35.1 Billion by 2030, growing at aCAGR of 9.2% over the period 2022-2030. Wood, one of the segments analyzed in the report, is projected to record 9.5% CAGR and reach US$19.5 Billion by the end of the analysis period. Taking into account the ongoing post pandemic recovery, growth in the Metal segment is readjusted to a revised 8.7% CAGR for the next 8-year period.

The U.S. Market is Estimated at $4.7 Billion, While China is Forecast to Grow at 14.4% CAGR

The Outdoor Furniture market in the U.S. is estimated at US$4.7 Billion in the year 2022. China, the world`s second largest economy, is forecast to reach a projected market size of US$8.6 Billion by the year 2030 trailing a CAGR of 14.4% over the analysis period 2022 to 2030. Among the other noteworthy geographic markets are Japan and Canada, each forecast to grow at 5.3% and 7.4% respectively over the 2022-2030 period. Within Europe, Germany is forecast to grow at approximately 6.5% CAGR.

Select Competitors (Total 152 Featured)

- Ace Hardware

- Adams Manufacturing

- Agio International Co.,

- Barbeques Galore

- Brown Jordan

- Casual Living

- Century Furniture

- DEDON

- Emu Group S.p.A.

- Fischer Möbel GmbH

- Forever Patio

- Hartman

- Heritage Home Group

- Homecrest Outdoor Living LLC

- KETTAL Group

- Royal Botania NV

- The Home Depot Inc.

- The Keter Group

- Treasure Garden Inc.

- Trex Company Inc.

- Winston Furniture Co. Inc.

- Yotrio Corp.

Read the full report: https://www.reportlinker.com/p0397792/?utm_source=PRN

I. METHODOLOGY

II. EXECUTIVE SUMMARY

1. MARKET OVERVIEW

Influencer Market Insights

World Market Trajectories

A Prelude

Recent Market Activity

Developing Economies to Drive Future Growth

Macro-Economic Indicators

Improvement in GDP Performance Bodes Well for the Market

Construction Industry - Revival in the Residential & Commercial

Construction Sectors Aid Outdoor Furniture Market

Growing Middle Class Population Propels Outdoor Furniture Market

Outdoor Furniture - Global Key Competitors Percentage Market

Share in 2022 (E)

Competitive Market Presence - Strong/Active/Niche/Trivial for

Players Worldwide in 2022 (E)

Impact of Covid-19 and a Looming Global Recession

2. FOCUS ON SELECT PLAYERS

Ace Hardware (USA)

Adams Manufacturing (USA)

Agio International Co. (USA)

Barbeques Galore (Australia)

Brown Jordan (USA)

Casual Living (USA)

Century Furniture (USA)

DEDON (Germany)

Emu Group S.p.A. (Italy)

Fischer Möbel GmbH (Germany)

Forever Patio (USA)

Hartman (The Netherlands)

Heritage Home Group (USA)

Homecrest Outdoor Living, LLC (USA)

KETTAL GROUP (Spain)

Royal Botania NV (Belgium)

The Home Depot, Inc. (USA)

The Keter Group (Israel)

Treasure Garden Inc. (USA)

Trex Company, Inc. (USA)

Winston Furniture Co. Inc. (USA)

Yotrio Corporation (USA)

3. MARKET TRENDS & DRIVERS

Socializing and Recreation Bolster the Need for Outdoor Furniture

Evolving Consumer Preferences

Innovations Blur the Difference between Outdoor and Indoor

Furniture

Innovations Blur the Difference between Outdoor and Indoor

Furniture

Ultramodern and Chic Furniture in Vogue

Comfort: A Key Determinant of Product Success

A Style Statement Rather Than A Necessity

High-End Technology Grips Outdoor Furniture Design Space

Outdoor Furniture: No Longer an Afterthought for Improving

Outdoor Comfort

Online Purchases Gain Steam

Retailers and Manufacturers Hop on to the ?M-Commerce? Bandwagon

Fast-Paced and Stressful Lifestyles Create the Need for Outdoor

Furniture

Innovative Weather Resistant Materials & Fabrics Help Fan the

Demand

Eco-Friendly Outdoor Furniture Gains Prominence

Ergonomics: A Key Design Variable

Styling and Aesthetics Gain Prominence

Premium Products Take On a High Profile

Innovative Fabrics Catch the Fancy of Homeowners

Customers Become Increasingly Hard-to-Please

Aluminium Patio Furniture Gains Steam

Outdoor Benches: A Part of the Must-Have Outdoor Furniture

Collectables

Patio Umbrellas Offer a Much Needed Respite from the Sun & Rain

Comfort - A Key Driving Factor for Hammocks

Thin Line Dividing the Indoor and Outdoor Products

Outdoor Furniture Made To Look & Feel Like Indoor Furniture

DIY Multiples and Garden Centers: The Key Channels

4. GLOBAL MARKET PERSPECTIVE

Table 1: World Recent Past, Current & Future Analysis for

Outdoor Furniture by Geographic Region - USA, Canada, Japan,

China, Europe, Asia-Pacific, Latin America, Middle East and

Africa Markets - Independent Analysis of Annual Sales in US$

Million for Years 2022 through 2030 and % CAGR

Table 2: World Historic Review for Outdoor Furniture by

Geographic Region - USA, Canada, Japan, China, Europe,

Asia-Pacific, Latin America, Middle East and Africa Markets -

Independent Analysis of Annual Sales in US$ Million for Years

2014 through 2021 and % CAGR

Table 3: World 16-Year Perspective for Outdoor Furniture by

Geographic Region - Percentage Breakdown of Value Sales for

USA, Canada, Japan, China, Europe, Asia-Pacific, Latin America,

Middle East and Africa Markets for Years 2014, 2023 & 2030

Table 4: World Recent Past, Current & Future Analysis for Wood

by Geographic Region - USA, Canada, Japan, China, Europe,

Asia-Pacific, Latin America, Middle East and Africa Markets -

Independent Analysis of Annual Sales in US$ Million for Years

2022 through 2030 and % CAGR

Table 5: World Historic Review for Wood by Geographic Region -

USA, Canada, Japan, China, Europe, Asia-Pacific, Latin America,

Middle East and Africa Markets - Independent Analysis of Annual

Sales in US$ Million for Years 2014 through 2021 and % CAGR

Table 6: World 16-Year Perspective for Wood by Geographic

Region - Percentage Breakdown of Value Sales for USA, Canada,

Japan, China, Europe, Asia-Pacific, Latin America, Middle East

and Africa for Years 2014, 2023 & 2030

Table 7: World Recent Past, Current & Future Analysis for Metal

by Geographic Region - USA, Canada, Japan, China, Europe,

Asia-Pacific, Latin America, Middle East and Africa Markets -

Independent Analysis of Annual Sales in US$ Million for Years

2022 through 2030 and % CAGR

Table 8: World Historic Review for Metal by Geographic Region -

USA, Canada, Japan, China, Europe, Asia-Pacific, Latin America,

Middle East and Africa Markets - Independent Analysis of Annual

Sales in US$ Million for Years 2014 through 2021 and % CAGR

Table 9: World 16-Year Perspective for Metal by Geographic

Region - Percentage Breakdown of Value Sales for USA, Canada,

Japan, China, Europe, Asia-Pacific, Latin America, Middle East

and Africa for Years 2014, 2023 & 2030

Table 10: World Recent Past, Current & Future Analysis for

Seating Sets by Geographic Region - USA, Canada, Japan, China,

Europe, Asia-Pacific, Latin America, Middle East and Africa

Markets - Independent Analysis of Annual Sales in US$ Million

for Years 2022 through 2030 and % CAGR

Table 11: World Historic Review for Seating Sets by Geographic

Region - USA, Canada, Japan, China, Europe, Asia-Pacific, Latin

America, Middle East and Africa Markets - Independent Analysis

of Annual Sales in US$ Million for Years 2014 through 2021 and

% CAGR

Table 12: World 16-Year Perspective for Seating Sets by

Geographic Region - Percentage Breakdown of Value Sales for

USA, Canada, Japan, China, Europe, Asia-Pacific, Latin America,

Middle East and Africa for Years 2014, 2023 & 2030

Table 13: World Recent Past, Current & Future Analysis for

Chairs by Geographic Region - USA, Canada, Japan, China,

Europe, Asia-Pacific, Latin America, Middle East and Africa

Markets - Independent Analysis of Annual Sales in US$ Million

for Years 2022 through 2030 and % CAGR

Table 14: World Historic Review for Chairs by Geographic Region -

USA, Canada, Japan, China, Europe, Asia-Pacific, Latin

America, Middle East and Africa Markets - Independent Analysis

of Annual Sales in US$ Million for Years 2014 through 2021 and

% CAGR

Table 15: World 16-Year Perspective for Chairs by Geographic

Region - Percentage Breakdown of Value Sales for USA, Canada,

Japan, China, Europe, Asia-Pacific, Latin America, Middle East

and Africa for Years 2014, 2023 & 2030

Table 16: World Recent Past, Current & Future Analysis for

Tables by Geographic Region - USA, Canada, Japan, China,

Europe, Asia-Pacific, Latin America, Middle East and Africa

Markets - Independent Analysis of Annual Sales in US$ Million

for Years 2022 through 2030 and % CAGR

Table 17: World Historic Review for Tables by Geographic Region -

USA, Canada, Japan, China, Europe, Asia-Pacific, Latin

America, Middle East and Africa Markets - Independent Analysis

of Annual Sales in US$ Million for Years 2014 through 2021 and

% CAGR

Table 18: World 16-Year Perspective for Tables by Geographic

Region - Percentage Breakdown of Value Sales for USA, Canada,

Japan, China, Europe, Asia-Pacific, Latin America, Middle East

and Africa for Years 2014, 2023 & 2030

Table 19: World Recent Past, Current & Future Analysis for

Dining Sets by Geographic Region - USA, Canada, Japan, China,

Europe, Asia-Pacific, Latin America, Middle East and Africa

Markets - Independent Analysis of Annual Sales in US$ Million

for Years 2022 through 2030 and % CAGR

Table 20: World Historic Review for Dining Sets by Geographic

Region - USA, Canada, Japan, China, Europe, Asia-Pacific, Latin

America, Middle East and Africa Markets - Independent Analysis

of Annual Sales in US$ Million for Years 2014 through 2021 and

% CAGR

Table 21: World 16-Year Perspective for Dining Sets by

Geographic Region - Percentage Breakdown of Value Sales for

USA, Canada, Japan, China, Europe, Asia-Pacific, Latin America,

Middle East and Africa for Years 2014, 2023 & 2030

Table 22: World Recent Past, Current & Future Analysis for

Other Product Types by Geographic Region - USA, Canada, Japan,

China, Europe, Asia-Pacific, Latin America, Middle East and

Africa Markets - Independent Analysis of Annual Sales in US$

Million for Years 2022 through 2030 and % CAGR

Table 23: World Historic Review for Other Product Types by

Geographic Region - USA, Canada, Japan, China, Europe,

Asia-Pacific, Latin America, Middle East and Africa Markets -

Independent Analysis of Annual Sales in US$ Million for Years

2014 through 2021 and % CAGR

Table 24: World 16-Year Perspective for Other Product Types by

Geographic Region - Percentage Breakdown of Value Sales for

USA, Canada, Japan, China, Europe, Asia-Pacific, Latin America,

Middle East and Africa for Years 2014, 2023 & 2030

Table 25: World Recent Past, Current & Future Analysis for

Residential by Geographic Region - USA, Canada, Japan, China,

Europe, Asia-Pacific, Latin America, Middle East and Africa

Markets - Independent Analysis of Annual Sales in US$ Million

for Years 2022 through 2030 and % CAGR

Table 26: World Historic Review for Residential by Geographic

Region - USA, Canada, Japan, China, Europe, Asia-Pacific, Latin

America, Middle East and Africa Markets - Independent Analysis

of Annual Sales in US$ Million for Years 2014 through 2021 and

% CAGR

Table 27: World 16-Year Perspective for Residential by

Geographic Region - Percentage Breakdown of Value Sales for

USA, Canada, Japan, China, Europe, Asia-Pacific, Latin America,

Middle East and Africa for Years 2014, 2023 & 2030

Table 28: World Recent Past, Current & Future Analysis for

Commercial by Geographic Region - USA, Canada, Japan, China,

Europe, Asia-Pacific, Latin America, Middle East and Africa

Markets - Independent Analysis of Annual Sales in US$ Million

for Years 2022 through 2030 and % CAGR

Table 29: World Historic Review for Commercial by Geographic

Region - USA, Canada, Japan, China, Europe, Asia-Pacific, Latin

America, Middle East and Africa Markets - Independent Analysis

of Annual Sales in US$ Million for Years 2014 through 2021 and

% CAGR

Table 30: World 16-Year Perspective for Commercial by

Geographic Region - Percentage Breakdown of Value Sales for

USA, Canada, Japan, China, Europe, Asia-Pacific, Latin America,

Middle East and Africa for Years 2014, 2023 & 2030

Table 31: World Recent Past, Current & Future Analysis for

Resin & Plastic by Geographic Region - USA, Canada, Japan,

China, Europe, Asia-Pacific, Latin America, Middle East and

Africa Markets - Independent Analysis of Annual Sales in US$

Million for Years 2022 through 2030 and % CAGR

Table 32: World Historic Review for Resin & Plastic by

Geographic Region - USA, Canada, Japan, China, Europe,

Asia-Pacific, Latin America, Middle East and Africa Markets -

Independent Analysis of Annual Sales in US$ Million for Years

2014 through 2021 and % CAGR

Table 33: World 16-Year Perspective for Resin & Plastic by

Geographic Region - Percentage Breakdown of Value Sales for

USA, Canada, Japan, China, Europe, Asia-Pacific, Latin America,

Middle East and Africa for Years 2014, 2023 & 2030

Table 34: World Recent Past, Current & Future Analysis for

Other Materials by Geographic Region - USA, Canada, Japan,

China, Europe, Asia-Pacific, Latin America, Middle East and

Africa Markets - Independent Analysis of Annual Sales in US$

Million for Years 2022 through 2030 and % CAGR

Table 35: World Historic Review for Other Materials by

Geographic Region - USA, Canada, Japan, China, Europe,

Asia-Pacific, Latin America, Middle East and Africa Markets -

Independent Analysis of Annual Sales in US$ Million for Years

2014 through 2021 and % CAGR

Table 36: World 16-Year Perspective for Other Materials by

Geographic Region - Percentage Breakdown of Value Sales for

USA, Canada, Japan, China, Europe, Asia-Pacific, Latin America,

Middle East and Africa for Years 2014, 2023 & 2030

Table 37: World Outdoor Furniture Market Analysis of Annual

Sales in US$ Million for Years 2014 through 2030

III. MARKET ANALYSIS

UNITED STATES

Outdoor Furniture Market Presence - Strong/Active/Niche/Trivial -

Key Competitors in the United States for 2023 (E)

Table 38: USA Recent Past, Current & Future Analysis for

Outdoor Furniture by Material Type - Wood, Metal, Resin &

Plastic and Other Materials - Independent Analysis of Annual

Sales in US$ Million for the Years 2022 through 2030 and % CAGR

Table 39: USA Historic Review for Outdoor Furniture by Material

Type - Wood, Metal, Resin & Plastic and Other Materials Markets -

Independent Analysis of Annual Sales in US$ Million for Years

2014 through 2021 and % CAGR

Table 40: USA 16-Year Perspective for Outdoor Furniture by

Material Type - Percentage Breakdown of Value Sales for Wood,

Metal, Resin & Plastic and Other Materials for the Years 2014,

2023 & 2030

Table 41: USA Recent Past, Current & Future Analysis for

Outdoor Furniture by Product Type - Seating Sets, Chairs,

Tables, Dining Sets and Other Product Types - Independent

Analysis of Annual Sales in US$ Million for the Years 2022

through 2030 and % CAGR

Table 42: USA Historic Review for Outdoor Furniture by Product

Type - Seating Sets, Chairs, Tables, Dining Sets and Other

Product Types Markets - Independent Analysis of Annual Sales in

US$ Million for Years 2014 through 2021 and % CAGR

Table 43: USA 16-Year Perspective for Outdoor Furniture by

Product Type - Percentage Breakdown of Value Sales for Seating

Sets, Chairs, Tables, Dining Sets and Other Product Types for

the Years 2014, 2023 & 2030

Table 44: USA Recent Past, Current & Future Analysis for

Outdoor Furniture by End-Use - Residential and Commercial -

Independent Analysis of Annual Sales in US$ Million for the

Years 2022 through 2030 and % CAGR

Table 45: USA Historic Review for Outdoor Furniture by End-Use -

Residential and Commercial Markets - Independent Analysis of

Annual Sales in US$ Million for Years 2014 through 2021 and %

CAGR

Table 46: USA 16-Year Perspective for Outdoor Furniture by

End-Use - Percentage Breakdown of Value Sales for Residential

and Commercial for the Years 2014, 2023 & 2030

CANADA

Table 47: Canada Recent Past, Current & Future Analysis for

Outdoor Furniture by Material Type - Wood, Metal, Resin &

Plastic and Other Materials - Independent Analysis of Annual

Sales in US$ Million for the Years 2022 through 2030 and % CAGR

Table 48: Canada Historic Review for Outdoor Furniture by

Material Type - Wood, Metal, Resin & Plastic and Other

Materials Markets - Independent Analysis of Annual Sales in US$

Million for Years 2014 through 2021 and % CAGR

Table 49: Canada 16-Year Perspective for Outdoor Furniture by

Material Type - Percentage Breakdown of Value Sales for Wood,

Metal, Resin & Plastic and Other Materials for the Years 2014,

2023 & 2030

Table 50: Canada Recent Past, Current & Future Analysis for

Outdoor Furniture by Product Type - Seating Sets, Chairs,

Tables, Dining Sets and Other Product Types - Independent

Analysis of Annual Sales in US$ Million for the Years 2022

through 2030 and % CAGR

Table 51: Canada Historic Review for Outdoor Furniture by

Product Type - Seating Sets, Chairs, Tables, Dining Sets and

Other Product Types Markets - Independent Analysis of Annual

Sales in US$ Million for Years 2014 through 2021 and % CAGR

Table 52: Canada 16-Year Perspective for Outdoor Furniture by

Product Type - Percentage Breakdown of Value Sales for Seating

Sets, Chairs, Tables, Dining Sets and Other Product Types for

the Years 2014, 2023 & 2030

Table 53: Canada Recent Past, Current & Future Analysis for

Outdoor Furniture by End-Use - Residential and Commercial -

Independent Analysis of Annual Sales in US$ Million for the

Years 2022 through 2030 and % CAGR

Table 54: Canada Historic Review for Outdoor Furniture by

End-Use - Residential and Commercial Markets - Independent

Analysis of Annual Sales in US$ Million for Years 2014 through

2021 and % CAGR

Table 55: Canada 16-Year Perspective for Outdoor Furniture by

End-Use - Percentage Breakdown of Value Sales for Residential

and Commercial for the Years 2014, 2023 & 2030

JAPAN

Outdoor Furniture Market Presence - Strong/Active/Niche/Trivial -

Key Competitors in Japan for 2023 (E)

Table 56: Japan Recent Past, Current & Future Analysis for

Outdoor Furniture by Material Type - Wood, Metal, Resin &

Plastic and Other Materials - Independent Analysis of Annual

Sales in US$ Million for the Years 2022 through 2030 and % CAGR

Table 57: Japan Historic Review for Outdoor Furniture by

Material Type - Wood, Metal, Resin & Plastic and Other

Materials Markets - Independent Analysis of Annual Sales in US$

Million for Years 2014 through 2021 and % CAGR

Table 58: Japan 16-Year Perspective for Outdoor Furniture by

Material Type - Percentage Breakdown of Value Sales for Wood,

Metal, Resin & Plastic and Other Materials for the Years 2014,

2023 & 2030

Table 59: Japan Recent Past, Current & Future Analysis for

Outdoor Furniture by Product Type - Seating Sets, Chairs,

Tables, Dining Sets and Other Product Types - Independent

Analysis of Annual Sales in US$ Million for the Years 2022

through 2030 and % CAGR

Table 60: Japan Historic Review for Outdoor Furniture by

Product Type - Seating Sets, Chairs, Tables, Dining Sets and

Other Product Types Markets - Independent Analysis of Annual

Sales in US$ Million for Years 2014 through 2021 and % CAGR

Table 61: Japan 16-Year Perspective for Outdoor Furniture by

Product Type - Percentage Breakdown of Value Sales for Seating

Sets, Chairs, Tables, Dining Sets and Other Product Types for

the Years 2014, 2023 & 2030

Table 62: Japan Recent Past, Current & Future Analysis for

Outdoor Furniture by End-Use - Residential and Commercial -

Independent Analysis of Annual Sales in US$ Million for the

Years 2022 through 2030 and % CAGR

Table 63: Japan Historic Review for Outdoor Furniture by

End-Use - Residential and Commercial Markets - Independent

Analysis of Annual Sales in US$ Million for Years 2014 through

2021 and % CAGR

Table 64: Japan 16-Year Perspective for Outdoor Furniture by

End-Use - Percentage Breakdown of Value Sales for Residential

and Commercial for the Years 2014, 2023 & 2030

CHINA

Outdoor Furniture Market Presence - Strong/Active/Niche/Trivial -

Key Competitors in China for 2023 (E)

Table 65: China Recent Past, Current & Future Analysis for

Outdoor Furniture by Material Type - Wood, Metal, Resin &

Plastic and Other Materials - Independent Analysis of Annual

Sales in US$ Million for the Years 2022 through 2030 and % CAGR

Table 66: China Historic Review for Outdoor Furniture by

Material Type - Wood, Metal, Resin & Plastic and Other

Materials Markets - Independent Analysis of Annual Sales in US$

Million for Years 2014 through 2021 and % CAGR

Table 67: China 16-Year Perspective for Outdoor Furniture by

Material Type - Percentage Breakdown of Value Sales for Wood,

Metal, Resin & Plastic and Other Materials for the Years 2014,

2023 & 2030

Table 68: China Recent Past, Current & Future Analysis for

Outdoor Furniture by Product Type - Seating Sets, Chairs,

Tables, Dining Sets and Other Product Types - Independent

Analysis of Annual Sales in US$ Million for the Years 2022

through 2030 and % CAGR

Table 69: China Historic Review for Outdoor Furniture by

Product Type - Seating Sets, Chairs, Tables, Dining Sets and

Other Product Types Markets - Independent Analysis of Annual

Sales in US$ Million for Years 2014 through 2021 and % CAGR

Table 70: China 16-Year Perspective for Outdoor Furniture by

Product Type - Percentage Breakdown of Value Sales for Seating

Sets, Chairs, Tables, Dining Sets and Other Product Types for

the Years 2014, 2023 & 2030

Table 71: China Recent Past, Current & Future Analysis for

Outdoor Furniture by End-Use - Residential and Commercial -

Independent Analysis of Annual Sales in US$ Million for the

Years 2022 through 2030 and % CAGR

Table 72: China Historic Review for Outdoor Furniture by

End-Use - Residential and Commercial Markets - Independent

Analysis of Annual Sales in US$ Million for Years 2014 through

2021 and % CAGR

Table 73: China 16-Year Perspective for Outdoor Furniture by

End-Use - Percentage Breakdown of Value Sales for Residential

and Commercial for the Years 2014, 2023 & 2030

EUROPE

Outdoor Furniture Market Presence - Strong/Active/Niche/Trivial -

Key Competitors in Europe for 2023 (E)

Table 74: Europe Recent Past, Current & Future Analysis for

Outdoor Furniture by Geographic Region - France, Germany,

Italy, UK, Spain, Russia and Rest of Europe Markets -

Independent Analysis of Annual Sales in US$ Million for Years

2022 through 2030 and % CAGR

Table 75: Europe Historic Review for Outdoor Furniture by

Geographic Region - France, Germany, Italy, UK, Spain, Russia

and Rest of Europe Markets - Independent Analysis of Annual

Sales in US$ Million for Years 2014 through 2021 and % CAGR

Table 76: Europe 16-Year Perspective for Outdoor Furniture by

Geographic Region - Percentage Breakdown of Value Sales for

France, Germany, Italy, UK, Spain, Russia and Rest of Europe

Markets for Years 2014, 2023 & 2030

Table 77: Europe Recent Past, Current & Future Analysis for

Outdoor Furniture by Material Type - Wood, Metal, Resin &

Plastic and Other Materials - Independent Analysis of Annual

Sales in US$ Million for the Years 2022 through 2030 and % CAGR

Table 78: Europe Historic Review for Outdoor Furniture by

Material Type - Wood, Metal, Resin & Plastic and Other

Materials Markets - Independent Analysis of Annual Sales in US$

Million for Years 2014 through 2021 and % CAGR

Table 79: Europe 16-Year Perspective for Outdoor Furniture by

Material Type - Percentage Breakdown of Value Sales for Wood,

Metal, Resin & Plastic and Other Materials for the Years 2014,

2023 & 2030

Table 80: Europe Recent Past, Current & Future Analysis for

Outdoor Furniture by Product Type - Seating Sets, Chairs,

Tables, Dining Sets and Other Product Types - Independent

Analysis of Annual Sales in US$ Million for the Years 2022

through 2030 and % CAGR

Table 81: Europe Historic Review for Outdoor Furniture by

Product Type - Seating Sets, Chairs, Tables, Dining Sets and

Other Product Types Markets - Independent Analysis of Annual

Sales in US$ Million for Years 2014 through 2021 and % CAGR

Table 82: Europe 16-Year Perspective for Outdoor Furniture by

Product Type - Percentage Breakdown of Value Sales for Seating

Sets, Chairs, Tables, Dining Sets and Other Product Types for

the Years 2014, 2023 & 2030

Table 83: Europe Recent Past, Current & Future Analysis for

Outdoor Furniture by End-Use - Residential and Commercial -

Independent Analysis of Annual Sales in US$ Million for the

Years 2022 through 2030 and % CAGR

Table 84: Europe Historic Review for Outdoor Furniture by

End-Use - Residential and Commercial Markets - Independent

Analysis of Annual Sales in US$ Million for Years 2014 through

2021 and % CAGR

Table 85: Europe 16-Year Perspective for Outdoor Furniture by

End-Use - Percentage Breakdown of Value Sales for Residential

and Commercial for the Years 2014, 2023 & 2030

FRANCE

Outdoor Furniture Market Presence - Strong/Active/Niche/Trivial -

Key Competitors in France for 2023 (E)

Table 86: France Recent Past, Current & Future Analysis for

Outdoor Furniture by Material Type - Wood, Metal, Resin &

Plastic and Other Materials - Independent Analysis of Annual

Sales in US$ Million for the Years 2022 through 2030 and % CAGR

Table 87: France Historic Review for Outdoor Furniture by

Material Type - Wood, Metal, Resin & Plastic and Other

Materials Markets - Independent Analysis of Annual Sales in US$

Million for Years 2014 through 2021 and % CAGR

Table 88: France 16-Year Perspective for Outdoor Furniture by

Material Type - Percentage Breakdown of Value Sales for Wood,

Metal, Resin & Plastic and Other Materials for the Years 2014,

2023 & 2030

Table 89: France Recent Past, Current & Future Analysis for

Outdoor Furniture by Product Type - Seating Sets, Chairs,

Tables, Dining Sets and Other Product Types - Independent

Analysis of Annual Sales in US$ Million for the Years 2022

through 2030 and % CAGR

Table 90: France Historic Review for Outdoor Furniture by

Product Type - Seating Sets, Chairs, Tables, Dining Sets and

Other Product Types Markets - Independent Analysis of Annual

Sales in US$ Million for Years 2014 through 2021 and % CAGR

Table 91: France 16-Year Perspective for Outdoor Furniture by

Product Type - Percentage Breakdown of Value Sales for Seating

Sets, Chairs, Tables, Dining Sets and Other Product Types for

the Years 2014, 2023 & 2030

Table 92: France Recent Past, Current & Future Analysis for

Outdoor Furniture by End-Use - Residential and Commercial -

Independent Analysis of Annual Sales in US$ Million for the

Years 2022 through 2030 and % CAGR

Table 93: France Historic Review for Outdoor Furniture by

End-Use - Residential and Commercial Markets - Independent

Analysis of Annual Sales in US$ Million for Years 2014 through

2021 and % CAGR

Table 94: France 16-Year Perspective for Outdoor Furniture by

End-Use - Percentage Breakdown of Value Sales for Residential

and Commercial for the Years 2014, 2023 & 2030

GERMANY

Outdoor Furniture Market Presence - Strong/Active/Niche/Trivial -

Key Competitors in Germany for 2023 (E)

Table 95: Germany Recent Past, Current & Future Analysis for

Outdoor Furniture by Material Type - Wood, Metal, Resin &

Plastic and Other Materials - Independent Analysis of Annual

Sales in US$ Million for the Years 2022 through 2030 and % CAGR

Table 96: Germany Historic Review for Outdoor Furniture by

Material Type - Wood, Metal, Resin & Plastic and Other

Materials Markets - Independent Analysis of Annual Sales in US$

Million for Years 2014 through 2021 and % CAGR

Table 97: Germany 16-Year Perspective for Outdoor Furniture by

Material Type - Percentage Breakdown of Value Sales for Wood,

Metal, Resin & Plastic and Other Materials for the Years 2014,

2023 & 2030

Table 98: Germany Recent Past, Current & Future Analysis for

Outdoor Furniture by Product Type - Seating Sets, Chairs,

Tables, Dining Sets and Other Product Types - Independent

Analysis of Annual Sales in US$ Million for the Years 2022

through 2030 and % CAGR

Table 99: Germany Historic Review for Outdoor Furniture by

Product Type - Seating Sets, Chairs, Tables, Dining Sets and

Other Product Types Markets - Independent Analysis of Annual

Sales in US$ Million for Years 2014 through 2021 and % CAGR

Table 100: Germany 16-Year Perspective for Outdoor Furniture by

Product Type - Percentage Breakdown of Value Sales for Seating

Sets, Chairs, Tables, Dining Sets and Other Product Types for

the Years 2014, 2023 & 2030

Table 101: Germany Recent Past, Current & Future Analysis for

Outdoor Furniture by End-Use - Residential and Commercial -

Independent Analysis of Annual Sales in US$ Million for the

Years 2022 through 2030 and % CAGR

Table 102: Germany Historic Review for Outdoor Furniture by

End-Use - Residential and Commercial Markets - Independent

Analysis of Annual Sales in US$ Million for Years 2014 through

2021 and % CAGR

Table 103: Germany 16-Year Perspective for Outdoor Furniture by

End-Use - Percentage Breakdown of Value Sales for Residential

and Commercial for the Years 2014, 2023 & 2030

ITALY

Table 104: Italy Recent Past, Current & Future Analysis for

Outdoor Furniture by Material Type - Wood, Metal, Resin &

Plastic and Other Materials - Independent Analysis of Annual

Sales in US$ Million for the Years 2022 through 2030 and % CAGR

Table 105: Italy Historic Review for Outdoor Furniture by

Material Type - Wood, Metal, Resin & Plastic and Other

Materials Markets - Independent Analysis of Annual Sales in US$

Million for Years 2014 through 2021 and % CAGR

Table 106: Italy 16-Year Perspective for Outdoor Furniture by

Material Type - Percentage Breakdown of Value Sales for Wood,

Metal, Resin & Plastic and Other Materials for the Years 2014,

2023 & 2030

Table 107: Italy Recent Past, Current & Future Analysis for

Outdoor Furniture by Product Type - Seating Sets, Chairs,

Tables, Dining Sets and Other Product Types - Independent

Analysis of Annual Sales in US$ Million for the Years 2022

through 2030 and % CAGR

Table 108: Italy Historic Review for Outdoor Furniture by

Product Type - Seating Sets, Chairs, Tables, Dining Sets and

Other Product Types Markets - Independent Analysis of Annual

Sales in US$ Million for Years 2014 through 2021 and % CAGR

Table 109: Italy 16-Year Perspective for Outdoor Furniture by

Product Type - Percentage Breakdown of Value Sales for Seating

Sets, Chairs, Tables, Dining Sets and Other Product Types for

the Years 2014, 2023 & 2030

Table 110: Italy Recent Past, Current & Future Analysis for

Outdoor Furniture by End-Use - Residential and Commercial -

Independent Analysis of Annual Sales in US$ Million for the

Years 2022 through 2030 and % CAGR

Table 111: Italy Historic Review for Outdoor Furniture by

End-Use - Residential and Commercial Markets - Independent

Analysis of Annual Sales in US$ Million for Years 2014 through

2021 and % CAGR

Table 112: Italy 16-Year Perspective for Outdoor Furniture by

End-Use - Percentage Breakdown of Value Sales for Residential

and Commercial for the Years 2014, 2023 & 2030

UNITED KINGDOM

Outdoor Furniture Market Presence - Strong/Active/Niche/Trivial -

Key Competitors in the United Kingdom for 2023 (E)

Table 113: UK Recent Past, Current & Future Analysis for

Outdoor Furniture by Material Type - Wood, Metal, Resin &

Plastic and Other Materials - Independent Analysis of Annual

Sales in US$ Million for the Years 2022 through 2030 and % CAGR

Table 114: UK Historic Review for Outdoor Furniture by Material

Type - Wood, Metal, Resin & Plastic and Other Materials Markets -

Independent Analysis of Annual Sales in US$ Million for Years

2014 through 2021 and % CAGR

Table 115: UK 16-Year Perspective for Outdoor Furniture by

Material Type - Percentage Breakdown of Value Sales for Wood,

Metal, Resin & Plastic and Other Materials for the Years 2014,

2023 & 2030

Table 116: UK Recent Past, Current & Future Analysis for

Outdoor Furniture by Product Type - Seating Sets, Chairs,

Tables, Dining Sets and Other Product Types - Independent

Analysis of Annual Sales in US$ Million for the Years 2022

through 2030 and % CAGR

Table 117: UK Historic Review for Outdoor Furniture by Product

Type - Seating Sets, Chairs, Tables, Dining Sets and Other

Product Types Markets - Independent Analysis of Annual Sales in

US$ Million for Years 2014 through 2021 and % CAGR

Table 118: UK 16-Year Perspective for Outdoor Furniture by

Product Type - Percentage Breakdown of Value Sales for Seating

Sets, Chairs, Tables, Dining Sets and Other Product Types for

the Years 2014, 2023 & 2030

Table 119: UK Recent Past, Current & Future Analysis for

Outdoor Furniture by End-Use - Residential and Commercial -

Independent Analysis of Annual Sales in US$ Million for the

Years 2022 through 2030 and % CAGR

Table 120: UK Historic Review for Outdoor Furniture by End-Use -

Residential and Commercial Markets - Independent Analysis of

Annual Sales in US$ Million for Years 2014 through 2021 and %

CAGR

Table 121: UK 16-Year Perspective for Outdoor Furniture by

End-Use - Percentage Breakdown of Value Sales for Residential

and Commercial for the Years 2014, 2023 & 2030

SPAIN

Table 122: Spain Recent Past, Current & Future Analysis for

Outdoor Furniture by Material Type - Wood, Metal, Resin &

Plastic and Other Materials - Independent Analysis of Annual

Sales in US$ Million for the Years 2022 through 2030 and % CAGR

Please contact our Customer Support Center to get the complete Table of Contents

Read the full report: https://www.reportlinker.com/p0397792/?utm_source=PRN

About Reportlinker

ReportLinker is an award-winning market research solution. Reportlinker finds and organizes the latest industry data so you get all the market research you need - instantly, in one place.

__________________________

Contact Clare: clare@reportlinker.com

US: (339)-368-6001

Intl: +1 339-368-6001

View original content to download multimedia:https://www.prnewswire.com/news-releases/global-outdoor-furniture-market-to-reach-35-1-billion-by-2030--301768785.html

SOURCE Reportlinker

Read More

Continue Reading

Uncategorized

The best real estate coaching programs for 2024

Hone your skills and level up your business this year by investing in an expert real estate coaching program

Published

on

Real estate is a vibrant, dynamic and competitive industry. From the thrill of a sale to the pursuit of new leads, it keeps you on your toes. That said, it can also be incredibly isolating, and it can be hard to stay motivated. As a way to deal with this, many agents and brokers seek out professional mentorship as a means to gain insight and level up their performance. Across the country, the best real estate coaches serve as valuable mentors who can help agents and brokers achieve the success they deserve. 

“It’s really hard for independent business owners to get unbiased advice from themselves,” says Kyle Scott, President of SERHANT. Ventures. “So they need unbiased experts to work with that will help them grow their business — someone who has been there, who has done it, and who is able to see their business from both the 35,000-foot view and down in the weeds.” 

A quick internet search will prove that real estate coaching programs are plentiful. Whether you’re looking to expand your team or client network or figure out how to delegate work so you can focus on the tasks you do best, a real estate coaching program could be a valuable launchpad. But when it comes to choosing the right one for your unique needs, there’s a lot to consider. Here, we highlight some of the best real estate coaches in the industry and their programs.

Summary

Who can benefit most from real estate coaching?

An unbiased view is worth millions. Often, we turn to our closest friends and family for guidance. Unfortunately, they’re usually not familiar with the ins and outs of the real estate industry and can’t provide you with the relevant feedback you need. As a result, many independent contractors rely on themselves, which generally doesn’t work either.

You can’t advise yourself, you’re too close to it. A coach works best for someone who is actually looking to grow their business, someone who is looking to put in the time and the energy to make a difference in achieving more income this year. Hire a coach if you want to start taking your business to the next level for any reason — you want to make more money, have more freedom with your time, or stop riding the ins and outs of the commission cycle.President of SERHANT. Ventures

1. Sell It Like Serhant

Key Facts

Grown throughout the pandemic, the Sell It Like Serhant program has been carefully adapted to the current market. It follows a weekly and bi-weekly platform featuring one-on-one virtual coaching from Serhant’s proprietary video platform. After a half-hour or hour-long group meeting every week or every other week, participants follow actionable steps to help them grow their business. Thus far, more than 22,000 enrollees in 128 countries have been through the Sell It Like Serhant program.

What We Love

Serhant offers daily office hours so participants can pop into virtual sessions to ask questions or get expert advice between their regularly scheduled sessions. A community platform also allows participants to pass referrals to each other. Thus far, it seems to have worked: To date, participating agents have closed over $250 million of referral deals.

Pricing

There are different membership tiers, depending on the level of guidance you need. The introductory Real Estate Core Course starts at $497. Prices are higher for a more specific course or one with 1:1 coaching.

Who’s it Best For?

If you’re looking to build a memorable personal brand, SERHANT. is the way to go. “The number one differentiator about our program is we understand that as a real estate agent, you have one job: to generate leads,” says SERHANT. Ventures President Kyle Scott. “Our number one focus is helping you build a clear, compelling, memorable personal brand and put your lead generation on autopilot. So that way, you can do what you do best, which is build relationships and close deals.”

Visit Sell It Like Serhant

2. Tom Ferry International

Headshot-Serhant

Key Facts

For good reason, Ferry International refers to itself as the real estate industry’s leading coaching and training company. Focused on Ferry’s “8 Levels of Performance,” the programs are a staple of real estate coaching. Their new group coaching sessions cover various aspects of real estate sales.

Prospecting Bootcamp is a 14-hour program comprised of seven two-hour group coaching sessions, and includes a peer-to-peer collaboration space. It involves independent work pulled from training videos and downloadable resources.

Recruitment Roadmap consists of hour-long sessions each week for ten weeks. Completed over Zoom and through the Tom Ferry video platform, each group coaching program offers a high level of specialization.

Finally, their Fast Track program offers 12 interactive group coaching sessions designed to help new agents build the necessary skills to succeed — like mastering listing presentations and handling objections. 

What we love 

If you’re looking for the gold standard of real estate coaching, Tom Ferry has the goods to back up the bravado. Because of their many years in the biz, Tom Ferry has a huge base of coaches, which means there are plenty of options to find the program best suited for your specific needs.

Pricing

Tom Ferry’s Prospecting Bootcamp and Fast Track coaching programs cost $999 but can be broken down into three monthly payments. The Recruitment Roadmap group coaching costs $1,499 but can be split into three monthly payments of $500. Consider their free coaching consultation if you want to dip your toes in the water. Check out their customer reviews, where several coaching program alums rave about the program.

Who’s it Best For?

If you thrive in a group setting that allows you to feed off the energy of others, Tom Ferry might be right for you. Their group coaching programs are new and more affordable alternatives to often costly 1:1 coaching fees.

Visit Tom Ferry

3. Tim and Julie Harris

Headshot-Serhant

Key Facts

The dynamic duo of real estate coaching, Tim and Julie Harris are a major name in the industry. Under their business, Harris Real Estate Coaching, their programs are divided into three tiers: Premier, Premier Plus, and VIP, all of which rely on a user-friendly online platform.

Pricing 

Premier platform costs $197 per month, but a 30-day free trial is available. Premier Plus costs $599 per month, while VIP costs $999 per month. Of course, their wildly successful podcast is a great free resource to tap into, as well as Tim and Julie’s many written contributions to HousingWire.

Who’s it Best For? 

If you’re constantly on the go, the ability to access the course from any device is a major asset.


4. Candy Miles-Crocker

Headshot-Serhant

Key Facts

Newbies are welcome at Candy Miles Crocker’s program. Known as the “Real Life Realtor,” she’s the brain behind Real Life Real Estate Training. With a variety of courses in her offerings, including a plethora of self-paced online courses, Miles-Crocker gives new agents a leg-up on the rest.

What we love

Miles-Crocker is still an active agent, working with clients to close deals. Her 20+ years of experience practicing in Washington, D.C., Virginia and Maryland have helped her build “systems, strategies and scripts” that she shares with her coaching clients.

Pricing

The CORE Essentials Blueprint program retails for $1,597. Smaller, more specific courses, such as The Buyer Presentation, are priced at $347.  While all pricing isn’t listed on her website, Miles-Crocker also offers a free course that includes her 6-point system for growth.

Who’s it Best For?

Miles-Crocker’s courses could be beneficial if you are new to agent life or looking to get your business reorganized. She even has one specifically for your first 30 days as a real estate agent.


5. Ashley Harwood

Ashley Harwood_headshot

Key Facts

Boston-based Ashley Harwood inspires introverts with her convincing, heartfelt and high-touch approach to practicing real estate. Her very human, very relatable Move Over Extroverts coaching approach is the perfect antidote for cheerleader-style coaches that urge you to door-knock, chase down divorce leads or become a social media superstar.

What we love

Harwood is a licensed agent coaching agents week-in and week-out at no less than three Keller-Williams offices in the great Boston metro. We love her humanity, inspiring videos, and her latest enterpise — The Quiet Success Club. Inspired by Susan Cain’s New York Times bestseller Quiet, about the power of introverts, Harwood brings together a community of like-minded real estate agents wanting a more client-centric approach to succeeding as an agent.

Pricing

Join The Quiet Success Club for $45 per month (paid monthly) or get two months free when you pay for an annual subscription (for $450). The club is currently offering founding member pricing for $25 per month or $250, but it’s a limited-time offer available only under April 30, 2024. Or get a lifetime membership to Harwood’s suite of courses, called IntrovertU, for a one-time cost of $997.

Who’s it Best For?

Introverts, of course! While you may not count yourself as one, if you read Susan Cain’s book, you may unearth your more introverted traits — like recharging your battery by being alone. Ok, even if you don’t bask in solitude, Harwood promises a calming community where agents can be themselves, be seen, and where they don’t have to be the loudest voice in her mastermind group, purposefully (and quietly) designed to teach successful lead generation and other strategies.


6. Levi Lascsak

If you’re looking to improve your social media game, Levi Lascsak is the YouTube master. The author of Passive Prospecting specializes in helping real estate professionals embrace the video platform, and he does so in jam-packed, 2-day virtual events. Discover how he earned over $4 million in gross commission income as a new agent.

What we love  

Lascsak’s social media marketing skills are top-of-the-line. While he may not be part of the traditional world of real estate coaching, Lascak’s ability to relate to younger audiences is an asset that Millennial and Gen Z agents might appreciate.

Pricing

The live, 2-day events are available at a discount for $47. But as you can expect, he’s got endless information available for free on YouTube.

Who’s it best for?

If you’re a digital native looking to pack a bunch of education into a short period, a Lascsak course is particularly beneficial.


7. Jess Lenouvel

Headshot-Serhant

Key Facts

Promising to help agents scale from six to seven figures, The Listings Lab founder Jess Lenouvel is the author of More Money, Less Hustle. A strong example of a coach with a significant understanding of social media, Lenouvel hosts vibrant live events that hype up the audience and prepare them to take their career to the next level.

What we Love

Lenouvel emphasizes the significant power of mindset to achieve one’s goals. She understands how quickly the market shifts and emphasizes staying on top of trends to succeed.

Pricing

Tickets to The Listings Lab retail for $997, but Lenouvel offers a variety of free resources as well, like her Listing Lab guide.

Who’s it best for?

Lenouvel’s live events focus on messaging. For those looking to solidify their brand and develop a clear, concise message, her events might be what you need.


8. Buffini & Company

Headshot-Serhant

Key Facts

Another giant of the real estate coaching industry, Buffini & Company is one of the largest coaching and training companies in the United States. They have two major coaching programs:  The Leadership Coaching program includes three monthly coaching calls, free admission to a 2-day conference, and curriculums and training led by Brian Buffini. There are also bi-monthly coaching sessions and a monthly web series with a live Q&A.

Buffini & Company also performs a REALstrengths profile — an in-depth personality assessment. In the One2One Coaching program, there are two coaching calls per month, a monthly marketing kit, the REALStrengths profile, and as with the SERHANT. program, Buffini features the Buffini Referral Network, allowing participants to send and receive referrals with other agents.

What We Love

Buffini coaches aren’t independent contractors. Instead, they’re full-time employees who go through intense training. Thus far, they’ve conducted 1.7 million coaching calls and more than one million hours of coaching.

Pricing

The Leadership Coaching program costs $1,499 a month. Private coaching, referred to as One2One Coaching, costs $549 per month. Two tiers of Referral Maker courses are available from $45 to $149 each per month.

Who’s it Best For?

Team spirit is the name of the game for Buffini’s Leadership Coaching program. If you’re a team leader looking to improve your coaching skills and assist your team in leveling up, the Leadership Coaching program might be right for you. If you want a more personalized path as a solo agent, the One2One Coaching program may be a better fit.


9. Vanda Martin

Key Facts

A popular name in the real estate coaching industry, Vanda Martin’s VIP Coaching Program follows three components: coaching, content, and community. Martin doesn’t shy away from mistakes – instead, she emphasizes avoiding indecision that puts you behind the pack. 

What we love

Positive vibes are plentiful in Martin’s world, and her energy is tangible. Just check out her Instagram videos.

Pricing

Martin’s pricing isn’t listed.

Who’s it best for?

If you’re looking for a female leader who emphasizes loving your job and building habits that will take you to a greater level of success, Martin’s ability to convey those feelings is clear. Just check out the endless testimonials on her website.


9. Tat Londono

Key Facts

Tatiana Londono is the founder and CEO of Londono Realty Group Inc. The author of Real Estate Unfiltered, she offers a variety of programming that ranges from free templates to intensive coaching sessions. The Millionaire Realtor Membership provides weekly input from Londono, while the intensive Millionaire Real Estate Agent Coaching Program focuses on building 12-month objectives using a custom success action plan. It uses live programming and workshops with Londono herself, as well as an exclusive online community and referral network for members.

What we love

Londono’s keen sense of social media and her posts are a masterclass in how to boost your engagement on platforms like TikTok and Instagram. Don’t miss her takes on Taylor Swift’s real estate portfolio.

Pricing

There are several tiers of Londono’s programs. The Millionaire Realtor Membership costs $97 per month, while the intensive Millionaire Real Estate Agent Coaching Program doesn’t publicly list its price tag. However, you can access her “six-figure real estate scripts” for free on her website.

Who’s it Best For?

Londono’s programs specifically target agents who are looking to scale their business. If you’re struggling with lead generation or want to increase the number of views you’re racking up on social media, Londono is a valuable source within the industry.


10. Steve Shull

Headshot-Serhant

Key Facts

Steve Shull’s Performance Coaching focuses on using consistent execution to achieve your goals. With options ranging from 1:1 private coaching to small group coaching for 10 to 20 agents, the groups have 30-minute Zoom calls three times a day, but the number of sessions you choose to attend is up to you.  Several self-directed courses are also available on the website, focusing on topics ranging from mindset to time blocking.

What we love

If you’re not positive you want to make the investment, Performance Coaching allows a 14-day free trial of daily accountability calls. 

Pricing

Small group coaching costs $6,000 a year, and while 1:1 coaching prices aren’t listed online, you should prepare for a hefty price tag. 

Who’s it Best For?

If you have a specific area you’re looking to improve upon, Performance Coaching offers coaches with unique areas of expertise, ranging from CRMs to business strategy. Tailoring your program to your greatest areas of weakness can help you become a more well-rounded agent.


11. Aaron Novello

Headshot-Serhant

Key Facts

Aaron Novello of Elite Real Estate Coaching has several programs tailor-made for agents looking to hone their craft. A Masterclass in Systems works to teach agents how to scale their real estate business, organize their team, and use programming like Follow Up Boss to manage their business.

The Role Play Mastermind is for agents looking to prepare themselves for tough discussions by working with a role-play partner for 15 to 30 minutes, five days a week. The group coaching option includes a variety of scripts Novello used to close on homes, as well as mindset guides, skill sheets, and expert guidance from experts in the field.

What we love

Novello’s exclusive accountability group allows active members and former coaching clients to share everything from guidance to motivation. If you’re looking to save money, Novello also has a free podcast available on YouTube.

Pricing

Group coaching costs $250 per month and comes with a money-back guarantee. Novello’s masterclass also retails for $250. The Role Play Mastermind costs $500 per year.

Who’s it best for?

If you struggle with having difficult conversations and are looking for solid templates to guide you, Novello’s Role Play Mastermind is a solid investment. The group coaching option emphasizes taking the educational portion and putting it into practice in the real world rather than just watching videos.


12. Krista Mashore Coaching

Key Facts

Filled with energy and known for popping up in the press, Krista Mashore is the mind behind Unstoppable Agent, her 3-day mastery class. It includes over 15 hours of coaching, group workshops, breakout sessions, and skill-building workshops to provide you with the skills to implement digital marketing successfully into your real estate business. 

What we love 

A positive attitude counts for a lot, and Mashore’s personality is a key component of the success of her course.

Pricing

Mashore’s accessibility is another one of her program’s best assets. Her 3-day class is currently priced at $47, but pricing occasionally varies.

Who’s it best for?

If you crave energy and enthusiasm, Krista Mashore has the goods. She’s also an expert on working in today’s low-inventory market, which is ideal for someone struggling with the current housing shortage. But she’s also got a good sense of humor, which shines through in her social media presence.


The full picture: The best real estate coaches for 2024

Hiring a top real estate coach goes far beyond just expanding your skills. While growing and educating yourself as you navigate your career is essential, hiring a coach is all about seeking to achieve more. Whether you’re looking to boost lead generation, build a solid personal brand, or make more commission income, having the input of a seasoned expert is a priceless step in the right direction. As you can see through the endless reviews and testimonials on coaches’ websites, agents who want to scale their business and take their profits to a higher level often seek the outside guidance of a coach. While the cost of hiring someone may be significant, the return on investment is equally as monumental.

Frequently Asked Questions

  • How much does real estate coaching cost?

    Real estate coaching programs vary in price significantly. Most cost over $500 per month, with others charging several thousand dollars per month. “Oftentimes, it is the case that you get what you pay for,” said Kyle Scott, President of SERHANT. Ventures.

    However, prices can also vary depending on the specific niche of real estate coaching you’re focusing on. The more specificity you’re seeking, the higher the financial investment. Of course, self-led courses are likely to cost much less.

  • When is the best time to take advantage of real estate coaching?

    Does your career feel stalled right now? Are you ready to take your career to the next level, but you’re not sure where to start? In a down market, you can channel your time and energy into actively improving your business skills so that you’ll be sufficiently prepared for when the market changes.

    “When things pick up again, you’re ready to capture the climbing market,” says Scott. “If that’s the case, then the best time to embrace coaching is now. At the same time, a thriving market presents agents with new challenges, ranging from having to turn away business or being unable to service your existing business in a way you’re proud of,” Scott noted. “In that type of market, a real estate coach can help you determine what kind of junior agent or assistant would serve you best. How do I figure out how to manage my business in a way that I can keep up with the volume?”

Read More

Continue Reading

Uncategorized

Part 1: Current State of the Housing Market; Overview for mid-March 2024

Today, in the Calculated Risk Real Estate Newsletter: Part 1: Current State of the Housing Market; Overview for mid-March 2024
A brief excerpt: This 2-part overview for mid-March provides a snapshot of the current housing market.

I always like to star…

Published

on

Today, in the Calculated Risk Real Estate Newsletter: Part 1: Current State of the Housing Market; Overview for mid-March 2024

A brief excerpt:
This 2-part overview for mid-March provides a snapshot of the current housing market.

I always like to start with inventory, since inventory usually tells the tale!
...
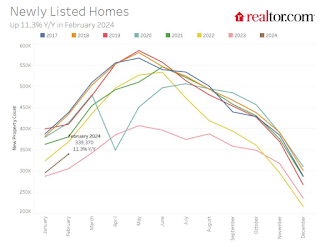
Here is a graph of new listing from Realtor.com’s February 2024 Monthly Housing Market Trends Report showing new listings were up 11.3% year-over-year in February. This is still well below pre-pandemic levels. From Realtor.com:

However, providing a boost to overall inventory, sellers turned out in higher numbers this February as newly listed homes were 11.3% above last year’s levels. This marked the fourth month of increasing listing activity after a 17-month streak of decline.
Note the seasonality for new listings. December and January are seasonally the weakest months of the year for new listings, followed by February and November. New listings will be up year-over-year in 2024, but we will have to wait for the March and April data to see how close new listings are to normal levels.

There are always people that need to sell due to the so-called 3 D’s: Death, Divorce, and Disease. Also, in certain times, some homeowners will need to sell due to unemployment or excessive debt (neither is much of an issue right now).

And there are homeowners who want to sell for a number of reasons: upsizing (more babies), downsizing, moving for a new job, or moving to a nicer home or location (move-up buyers). It is some of the “want to sell” group that has been locked in with the golden handcuffs over the last couple of years, since it is financially difficult to move when your current mortgage rate is around 3%, and your new mortgage rate will be in the 6 1/2% to 7% range.

But time is a factor for this “want to sell” group, and eventually some of them will take the plunge. That is probably why we are seeing more new listings now.
There is much more in the article.

Read More

Continue Reading

Uncategorized

Pharma industry reputation remains steady at a ‘new normal’ after Covid, Harris Poll finds

The pharma industry is hanging on to reputation gains notched during the Covid-19 pandemic. Positive perception of the pharma industry is steady at 45%…

Published

on

The pharma industry is hanging on to reputation gains notched during the Covid-19 pandemic. Positive perception of the pharma industry is steady at 45% of US respondents in 2023, according to the latest Harris Poll data. That’s exactly the same as the previous year.

Pharma’s highest point was in February 2021 — as Covid vaccines began to roll out — with a 62% positive US perception, and helping the industry land at an average 55% positive sentiment at the end of the year in Harris’ 2021 annual assessment of industries. The pharma industry’s reputation hit its most recent low at 32% in 2019, but it had hovered around 30% for more than a decade prior.

Rob Jekielek

“Pharma has sustained a lot of the gains, now basically one and half times higher than pre-Covid,” said Harris Poll managing director Rob Jekielek. “There is a question mark around how sustained it will be, but right now it feels like a new normal.”

The Harris survey spans 11 global markets and covers 13 industries. Pharma perception is even better abroad, with an average 58% of respondents notching favorable sentiments in 2023, just a slight slip from 60% in each of the two previous years.

Pharma’s solid global reputation puts it in the middle of the pack among international industries, ranking higher than government at 37% positive, insurance at 48%, financial services at 51% and health insurance at 52%. Pharma ranks just behind automotive (62%), manufacturing (63%) and consumer products (63%), although it lags behind leading industries like tech at 75% positive in the first spot, followed by grocery at 67%.

The bright spotlight on the pharma industry during Covid vaccine and drug development boosted its reputation, but Jekielek said there’s maybe an argument to be made that pharma is continuing to develop innovative drugs outside that spotlight.

“When you look at pharma reputation during Covid, you have clear sense of a very dynamic industry working very quickly and getting therapies and products to market. If you’re looking at things happening now, you could argue that pharma still probably doesn’t get enough credit for its advances, for example, in oncology treatments,” he said.

Read More

Continue Reading

Trending