Uncategorized
Get Ready – The Best Time to Sell is April 16-22, according to Realtor.com®
Get Ready – The Best Time to Sell is April 16-22, according to Realtor.com®
PR Newswire
SANTA CLARA, Calif., March 15, 2023
Homeowners who list that week will experience the best combination of market conditions and could get $48,000 more for their…
Share this:

Get Ready - The Best Time to Sell is April 16-22, according to Realtor.com®
PR Newswire
SANTA CLARA, Calif., March 15, 2023
Homeowners who list that week will experience the best combination of market conditions and could get $48,000 more for their home than the start of the year
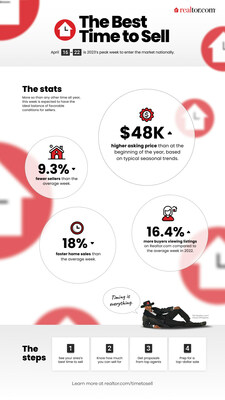
SANTA CLARA, Calif., March 15, 2023 /PRNewswire/ -- While it's nearly impossible to time the real estate market, there is one week that is most likely to get home sellers the best possible outcome, according to Realtor.com®. Nationally, homeowners who list the week of April 16-22, 2023 will hit the sweet spot in terms of the best combination of higher prices, fewer homes to compete against, faster sales time and strong buyer demand. A recent survey from Realtor.com® and HarrisX found that 60% of home sellers took up to 3 months to get their home ready to list, so for homeowners who have been making preparations, listing during that crucial April week could get $48,000 more for their home than they would have at the start of the year.
"Many home shoppers kick off their search in the early spring and they often beat the majority of home sellers to the punch," said Realtor.com® Chief Economist Danielle Hale. "For this reason, sellers who list on the earlier side will get more buyer attention and therefore be more likely to sell quickly and for a higher price."
Why is April 16-22 the best time to sell?
While mortgage rates are expected to remain elevated through 2023, for-sale inventory is still well below pre-pandemic levels, so sellers can still expect well-priced homes to be in high demand. Those looking to take advantage of seasonal market trends should consider getting ready to list April 16-22, which is anticipated to have the best mix of market conditions for sellers, including:
- Higher prices – Homes listed during this week have historically had prices 2.1% higher than the average week throughout the year, and are typically 12.1% higher than the start of the year. If 2023 follows the typical seasonal trend, the national median listing price could reach $8,400 higher than the average week, and $48,000 more than the start of the year.
- Strong buyer demand – The more buyers looking at a home, the better, as the home is likely to get more offers and sell quickly. Historically, this week garnered 16.4% more views per listing than the typical week, but in 2022 this week got 32.5% more views per listing than the average week, as buyer demand dropped in the latter part of the year.
- Fast-selling homes – Thanks to above-average demand, homes tend to sell more quickly during this week. Historically, homes actively for sale during this week sold 18.0% faster than the average week. In the fast-moving 2022 market, this week saw homes typically on the market for 32 days, 13 days faster than the year's average, and 37 days faster than was typical in 2019. The 2023 market is not expected to move as quickly as in 2022, but the best week is still expected to see faster sales than the year's typical pace.
- Less competition from other sellers – Typically, there would be 9.3% fewer sellers on the market during this week compared to the average week throughout the year. Last year saw significant inventory gains as buyer demand cooled, but sellers responded by pulling back on listings by the end of the year. Active inventory was 65.5% higher at the start of 2023 versus 2022, but still 43.2% lower than pre-pandemic levels. This gap means there continues to be opportunities for sellers who enter the market this spring.
Tips on prepping a home for sale
According to Realtor.com®'s survey, it took most recent sellers (80%) between 2 weeks and 6 months to prepare their home for sale, with the sweet spot being between 1-3 months (32%). For most (56%) it took more time than expected to list their home, while 23% said it was faster than expected and 22% said it took about as long as they expected. For those considering a home sale this year, it's best to start preparing now in case it takes longer than anticipated.
For the best chance at a quick sale and high price, homeowners should make sure that their home looks its best, has been well cared for and is up-to-date with routine maintenance. To get ready to list, about a third of recent sellers (35%) made repairs/updates to the home, did some cleaning and decluttering (33%) and found an agent to help them (31%). In order to best market their home, owners and their agents had listing photos taken (34%); created marketing materials such as flyers (27%); created a 3D/virtual tour (20%) and staged the home (11%).
Making minor repairs can go a long way during a showing. Potentially, a buyer who sees leaky faucets and closet doors that don't close might become concerned about larger potential problems with the home. The most common repairs made by survey respondents were:
- Minor cosmetic updates such as replacing light fixtures or faucets (16%)
- Carpet/floor replacement or refinishing (14%)
- Landscaping such as mulch, vegetation, etc. (13%)
- Full painting of exterior (12%)
- Touch-up paint (12%)
- Full painting of interior (12%)
- Replacing appliances such as kitchen or laundry (11%)
- Replacing the roof (9%)
- Replacing major systems such as HVAC, hot water (8%)
- Caulking (6%)
- Replacing grout (6%)
"In today's market, it's really important to price your home well and make sure that it looks its best in order to get top dollar and find a buyer quickly," said Hannah Jones, economic research analyst Realtor.com®. "There are still buyers in the market, but due to high prices and interest rates, they're being a bit more picky than they were the past several years."
Homeowners who are looking to sell their home can visit Realtor.com® to find a trusted agent in their area and check out Realtor.com®'s Complete Guide for Selling Your Home.
Report Methodology
Listing metrics (e.g. list prices) from 2018-2019 and 2021-2022 were measured on a weekly basis, with each week compared against a benchmark from the first full week of the year. Averaging across the years yielded the "typical" seasonal trend for each metric. Percentile levels for each week were calculated along each metric (prices, listings, days on market, etc.), and were then averaged together across metrics to determine a Best Time to List score for each week. Rankings for each week were based on these Best Time to List scores.
Survey Methodology
The survey was conducted online from Feb. 3-10, 2023, among 2,286 adults in the U.S. by HarrisX. The sampling margin of error of this poll is +/- 2.1 percentage points and larger for subgroups. The results reflect a nationally representative sample of U.S. adults. Results were weighted for age by gender, region, race/ethnicity, and income where necessary to align them with their actual proportions in the population.
About Realtor.com®
Realtor.com® is an open real estate marketplace built for everyone. Realtor.com® pioneered the world of digital real estate more than 25 years ago. Today, through its website and mobile apps, Realtor.com® is a trusted guide for consumers, empowering more people to find their way home by breaking down barriers, helping them make the right connections, and creating confidence through expert insights and guidance. For professionals, Realtor.com® is a trusted partner for business growth, offering consumer connections and branding solutions that help them succeed in today's on-demand world. Realtor.com® is operated by News Corp [Nasdaq: NWS, NWSA] [ASX: NWS, NWSLV] subsidiary Move, Inc. For more information, visit Realtor.com®.
Media contact: press@realtor.com
View original content to download multimedia:https://www.prnewswire.com/news-releases/get-ready--the-best-time-to-sell-is-april-16-22-according-to-realtorcom-301772468.html
SOURCE Realtor.com
Uncategorized
February Employment Situation
By Paul Gomme and Peter Rupert The establishment data from the BLS showed a 275,000 increase in payroll employment for February, outpacing the 230,000…
Share this:


By Paul Gomme and Peter Rupert
The establishment data from the BLS showed a 275,000 increase in payroll employment for February, outpacing the 230,000 average over the previous 12 months. The payroll data for January and December were revised down by a total of 167,000. The private sector added 223,000 new jobs, the largest gain since May of last year.

Temporary help services employment continues a steep decline after a sharp post-pandemic rise.


Average hours of work increased from 34.2 to 34.3. The increase, along with the 223,000 private employment increase led to a hefty increase in total hours of 5.6% at an annualized rate, also the largest increase since May of last year.

The establishment report, once again, beat “expectations;” the WSJ survey of economists was 198,000. Other than the downward revisions, mentioned above, another bit of negative news was a smallish increase in wage growth, from $34.52 to $34.57.

The household survey shows that the labor force increased 150,000, a drop in employment of 184,000 and an increase in the number of unemployed persons of 334,000. The labor force participation rate held steady at 62.5, the employment to population ratio decreased from 60.2 to 60.1 and the unemployment rate increased from 3.66 to 3.86. Remember that the unemployment rate is the number of unemployed relative to the labor force (the number employed plus the number unemployed). Consequently, the unemployment rate can go up if the number of unemployed rises holding fixed the labor force, or if the labor force shrinks holding the number unemployed unchanged. An increase in the unemployment rate is not necessarily a bad thing: it may reflect a strong labor market drawing “marginally attached” individuals from outside the labor force. Indeed, there was a 96,000 decline in those workers.


Earlier in the week, the BLS announced JOLTS (Job Openings and Labor Turnover Survey) data for January. There isn’t much to report here as the job openings changed little at 8.9 million, the number of hires and total separations were little changed at 5.7 million and 5.3 million, respectively.

As has been the case for the last couple of years, the number of job openings remains higher than the number of unemployed persons.

Also earlier in the week the BLS announced that productivity increased 3.2% in the 4th quarter with output rising 3.5% and hours of work rising 0.3%.

The bottom line is that the labor market continues its surprisingly (to some) strong performance, once again proving stronger than many had expected. This strength makes it difficult to justify any interest rate cuts soon, particularly given the recent inflation spike.
unemployment pandemic unemploymentUncategorized
Mortgage rates fall as labor market normalizes
Jobless claims show an expanding economy. We will only be in a recession once jobless claims exceed 323,000 on a four-week moving average.
Share this:


Everyone was waiting to see if this week’s jobs report would send mortgage rates higher, which is what happened last month. Instead, the 10-year yield had a muted response after the headline number beat estimates, but we have negative job revisions from previous months. The Federal Reserve’s fear of wage growth spiraling out of control hasn’t materialized for over two years now and the unemployment rate ticked up to 3.9%. For now, we can say the labor market isn’t tight anymore, but it’s also not breaking.
The key labor data line in this expansion is the weekly jobless claims report. Jobless claims show an expanding economy that has not lost jobs yet. We will only be in a recession once jobless claims exceed 323,000 on a four-week moving average.
From the Fed: In the week ended March 2, initial claims for unemployment insurance benefits were flat, at 217,000. The four-week moving average declined slightly by 750, to 212,250
Below is an explanation of how we got here with the labor market, which all started during COVID-19.
1. I wrote the COVID-19 recovery model on April 7, 2020, and retired it on Dec. 9, 2020. By that time, the upfront recovery phase was done, and I needed to model out when we would get the jobs lost back.
2. Early in the labor market recovery, when we saw weaker job reports, I doubled and tripled down on my assertion that job openings would get to 10 million in this recovery. Job openings rose as high as to 12 million and are currently over 9 million. Even with the massive miss on a job report in May 2021, I didn’t waver.
Currently, the jobs openings, quit percentage and hires data are below pre-COVID-19 levels, which means the labor market isn’t as tight as it once was, and this is why the employment cost index has been slowing data to move along the quits percentage.

3. I wrote that we should get back all the jobs lost to COVID-19 by September of 2022. At the time this would be a speedy labor market recovery, and it happened on schedule, too
Total employment data
4. This is the key one for right now: If COVID-19 hadn’t happened, we would have between 157 million and 159 million jobs today, which would have been in line with the job growth rate in February 2020. Today, we are at 157,808,000. This is important because job growth should be cooling down now. We are more in line with where the labor market should be when averaging 140K-165K monthly. So for now, the fact that we aren’t trending between 140K-165K means we still have a bit more recovery kick left before we get down to those levels.

From BLS: Total nonfarm payroll employment rose by 275,000 in February, and the unemployment rate increased to 3.9 percent, the U.S. Bureau of Labor Statistics reported today. Job gains occurred in health care, in government, in food services and drinking places, in social assistance, and in transportation and warehousing.
Here are the jobs that were created and lost in the previous month:

In this jobs report, the unemployment rate for education levels looks like this:
- Less than a high school diploma: 6.1%
- High school graduate and no college: 4.2%
- Some college or associate degree: 3.1%
- Bachelor’s degree or higher: 2.2%

Today’s report has continued the trend of the labor data beating my expectations, only because I am looking for the jobs data to slow down to a level of 140K-165K, which hasn’t happened yet. I wouldn’t categorize the labor market as being tight anymore because of the quits ratio and the hires data in the job openings report. This also shows itself in the employment cost index as well. These are key data lines for the Fed and the reason we are going to see three rate cuts this year.
recession unemployment covid-19 fed federal reserve mortgage rates recession recovery unemploymentUncategorized
Inside The Most Ridiculous Jobs Report In History: Record 1.2 Million Immigrant Jobs Added In One Month
Inside The Most Ridiculous Jobs Report In History: Record 1.2 Million Immigrant Jobs Added In One Month
Last month we though that the January…
Share this:


Last month we though that the January jobs report was the "most ridiculous in recent history" but, boy, were we wrong because this morning the Biden department of goalseeked propaganda (aka BLS) published the February jobs report, and holy crap was that something else. Even Goebbels would blush.
What happened? Let's take a closer look.
On the surface, it was (almost) another blockbuster jobs report, certainly one which nobody expected, or rather just one bank out of 76 expected. Starting at the top, the BLS reported that in February the US unexpectedly added 275K jobs, with just one research analyst (from Dai-Ichi Research) expecting a higher number.
Some context: after last month's record 4-sigma beat, today's print was "only" 3 sigma higher than estimates. Needless to say, two multiple sigma beats in a row used to only happen in the USSR... and now in the US, apparently.

Before we go any further, a quick note on what last month we said was "the most ridiculous jobs report in recent history": it appears the BLS read our comments and decided to stop beclowing itself. It did that by slashing last month's ridiculous print by over a third, and revising what was originally reported as a massive 353K beat to just 229K, a 124K revision, which was the biggest one-month negative revision in two years!

Of course, that does not mean that this month's jobs print won't be revised lower: it will be, and not just that month but every other month until the November election because that's the only tool left in the Biden admin's box: pretend the economic and jobs are strong, then revise them sharply lower the next month, something we pointed out first last summer and which has not failed to disappoint once.
In the past month the Biden department of goalseeking stuff higher before revising it lower, has revised the following data sharply lower:
— zerohedge (@zerohedge) August 30, 2023
- Jobs
- JOLTS
- New Home sales
- Housing Starts and Permits
- Industrial Production
- PCE and core PCE
To be fair, not every aspect of the jobs report was stellar (after all, the BLS had to give it some vague credibility). Take the unemployment rate, after flatlining between 3.4% and 3.8% for two years - and thus denying expectations from Sahm's Rule that a recession may have already started - in February the unemployment rate unexpectedly jumped to 3.9%, the highest since February 2022 (with Black unemployment spiking by 0.3% to 5.6%, an indicator which the Biden admin will quickly slam as widespread economic racism or something).

And then there were average hourly earnings, which after surging 0.6% MoM in January (since revised to 0.5%) and spooking markets that wage growth is so hot, the Fed will have no choice but to delay cuts, in February the number tumbled to just 0.1%, the lowest in two years...

... for one simple reason: last month's average wage surge had nothing to do with actual wages, and everything to do with the BLS estimate of hours worked (which is the denominator in the average wage calculation) which last month tumbled to just 34.1 (we were led to believe) the lowest since the covid pandemic...

... but has since been revised higher while the February print rose even more, to 34.3, hence why the latest average wage data was once again a product not of wages going up, but of how long Americans worked in any weekly period, in this case higher from 34.1 to 34.3, an increase which has a major impact on the average calculation.

While the above data points were examples of some latent weakness in the latest report, perhaps meant to give it a sheen of veracity, it was everything else in the report that was a problem starting with the BLS's latest choice of seasonal adjustments (after last month's wholesale revision), which have gone from merely laughable to full clownshow, as the following comparison between the monthly change in BLS and ADP payrolls shows. The trend is clear: the Biden admin numbers are now clearly rising even as the impartial ADP (which directly logs employment numbers at the company level and is far more accurate), shows an accelerating slowdown.

But it's more than just the Biden admin hanging its "success" on seasonal adjustments: when one digs deeper inside the jobs report, all sorts of ugly things emerge... such as the growing unprecedented divergence between the Establishment (payrolls) survey and much more accurate Household (actual employment) survey. To wit, while in January the BLS claims 275K payrolls were added, the Household survey found that the number of actually employed workers dropped for the third straight month (and 4 in the past 5), this time by 184K (from 161.152K to 160.968K).

This means that while the Payrolls series hits new all time highs every month since December 2020 (when according to the BLS the US had its last month of payrolls losses), the level of Employment has not budged in the past year. Worse, as shown in the chart below, such a gaping divergence has opened between the two series in the past 4 years, that the number of Employed workers would need to soar by 9 million (!) to catch up to what Payrolls claims is the employment situation.

There's more: shifting from a quantitative to a qualitative assessment, reveals just how ugly the composition of "new jobs" has been. Consider this: the BLS reports that in February 2024, the US had 132.9 million full-time jobs and 27.9 million part-time jobs. Well, that's great... until you look back one year and find that in February 2023 the US had 133.2 million full-time jobs, or more than it does one year later! And yes, all the job growth since then has been in part-time jobs, which have increased by 921K since February 2023 (from 27.020 million to 27.941 million).

Here is a summary of the labor composition in the past year: all the new jobs have been part-time jobs!

But wait there's even more, because now that the primary season is over and we enter the heart of election season and political talking points will be thrown around left and right, especially in the context of the immigration crisis created intentionally by the Biden administration which is hoping to import millions of new Democratic voters (maybe the US can hold the presidential election in Honduras or Guatemala, after all it is their citizens that will be illegally casting the key votes in November), what we find is that in February, the number of native-born workers tumbled again, sliding by a massive 560K to just 129.807 million. Add to this the December data, and we get a near-record 2.4 million plunge in native-born workers in just the past 3 months (only the covid crash was worse)!

The offset? A record 1.2 million foreign-born (read immigrants, both legal and illegal but mostly illegal) workers added in February!

Said otherwise, not only has all job creation in the past 6 years has been exclusively for foreign-born workers...

... but there has been zero job-creation for native born workers since June 2018!

This is a huge issue - especially at a time of an illegal alien flood at the southwest border...

... and is about to become a huge political scandal, because once the inevitable recession finally hits, there will be millions of furious unemployed Americans demanding a more accurate explanation for what happened - i.e., the illegal immigration floodgates that were opened by the Biden admin.
Which is also why Biden's handlers will do everything in their power to insure there is no official recession before November... and why after the election is over, all economic hell will finally break loose. Until then, however, expect the jobs numbers to get even more ridiculous.


Wendy’s has a new deal for daylight savings time haters


Watch Live: President Biden Reminds Americans Just How Good They’ve Got It Thanks To Him


Mortgage rates fall as labor market normalizes


Racial and Ethnic Wealth Inequality in the Post‑Pandemic Era


Watch: President Biden Delivers The “Darkest, Most Un-American Speech Given By A President”


Wealth Inequality by Age in the Post‑Pandemic Era


Interest rates, the best it gets. It’s time to deploy cash


Is the biotech market rally real? Data suggest comeback in private, public markets


February Employment Situation


People Who Received Ivermectin Were Better Off, Study Finds
-

 Uncategorized2 weeks ago
All Of The Elements Are In Place For An Economic Crisis Of Staggering Proportions
-

 Uncategorized1 month ago
Cathie Wood sells a major tech stock (again)
-

 Uncategorized3 weeks ago
California Counties Could Be Forced To Pay $300 Million To Cover COVID-Era Program
-

 Uncategorized2 weeks ago
Apparel Retailer Express Moving Toward Bankruptcy
-

 Uncategorized3 weeks ago
Industrial Production Decreased 0.1% in January
-

 International1 day ago
Walmart launches clever answer to Target’s new membership program
-

 Uncategorized3 weeks ago
RFK Jr: The Wuhan Cover-Up & The Rise Of The Biowarfare-Industrial Complex
-

 Uncategorized3 weeks ago
GOP Efforts To Shore Up Election Security In Swing States Face Challenges