Connect with us

FOMC Minutes Confirm Tapering Begins Mid-Nov or Dec At $15BN Monthly, Several Preferred “More Rapid” Bond-Buying Cuts

FOMC Minutes Confirm Tapering Begins Mid-Nov or Dec At $15BN Monthly, Several Preferred "More Rapid" Bond-Buying Cuts

Since the last FOMC meeting (September 22nd) – when Chair Powell began to detail the taper and rate-hike traajectory to…

Published

on

FOMC Minutes Confirm Tapering Begins Mid-Nov or Dec At $15BN Monthly, Several Preferred "More Rapid" Bond-Buying Cuts

Since the last FOMC meeting (September 22nd) - when Chair Powell began to detail the taper and rate-hike traajectory to come - bonds are down (yields higher) but stocks, gold, and the dollar are all up around 1%...

Source: Bloomberg

And even more notably, the trajectory (and initial timing) or rate-hikes has soared...

Source: Bloomberg

But the long-end of the yield curve is signaling that The Fed will once again commit a faux-pass...

Source: Bloomberg

So the big question the market is trying to glean from today's Minutes is - just how 'consensus' is the imminent taper talk... and potentially a sooner than expected rate-hike? Especially after today showed that consumer price readings have come in at 5% or higher on a year-over-year basis for five straight months, undermining the "transitory" theme put forward by central bankers.

As a reminder, The Fed confirmed plans to begin reducing their bond-buying stimulus program in November and to possibly end the asset purchases entirely by the middle of next year - this was confirmed in the Minutes...

Participants also expressed their views on how slowing in the pace of purchases might proceed.

In particular, participants commented on an illustrative path, developed by the staff and reflecting participants' discussions at the Committee's July meeting, that gave the speed and composition associated with a tapering of asset purchases. The illustrative tapering path was designed to be simple to communicate and entailed a gradual reduction in the pace of net asset purchases that, if begun later this year, would lead the Federal Reserve to end purchases around the middle of next year.

The path featured monthly reductions in the pace of asset purchases, by $10 billion in the case of Treasury securities and $5 billion in the case of agency mortgage-backed securities (MBS). Participants generally commented that the illustrative path provided a straightforward and appropriate template that policymakers might follow, and a couple of participants observed that giving advance notice to the general public of a plan along these lines may reduce the risk of an adverse market reaction to a moderation in asset purchases. Participants noted that, in keeping with the outcome-based standard for initiating a tapering of asset purchases, the Committee could adjust the pace of the moderation of its purchases if economic developments were to differ substantially from what they expected. Several participants indicated that they preferred to proceed with a more rapid moderation of purchases than described in the illustrative examples.

No decision to proceed with a moderation of asset purchases was made at the meeting, but participants generally assessed that, provided that the economic recovery remained broadly on track, a gradual tapering process that concluded around the middle of next year would likely be appropriate.

Participants noted that if a decision to begin tapering purchases occurred at the next meeting, the process of tapering could commence with the monthly purchase calendars beginning in either mid-November or mid-December.

Several participants indicated that they preferred to proceed with a more rapid moderation of purchases than described in the illustrative examples.

This is what that looks like...

“Many” thought the progress test would be met “soon”

A number of participants assessed that the standard of substantial further progress toward the goal of maximum employment had not yet been attained but that, if the economy proceeded roughly as they anticipated, it may soon be reached.”

On rate-hikes:

“Various participants stressed that economic conditions were likely to justify keeping the rate at or near its lower bound over the next couple of years.”

On Inflation:

Some participants expressed concerns that elevated rates of inflation could feed through into longer-term inflation expectations of households and businesses or saw recent inflation data as suggestive of broader inflation pressures. Several other participants pointed out that the largest contributors to the recent elevated measures of inflation were a handful of COVID-related, pandemic-sensitive categories in which specific, identifiable bottlenecks were at play. This observation suggested that the upward pressure on prices would abate as the COVID-related demand and supply imbalances subsided. These participants noted that prices in some of those categories showed signs of stabilizing or even turned down of late. Many participants pointed out that the owners' equivalent rent component of price indexes should be monitored carefully, as rising home prices could lead to upward pressure on rents. A few participants noted that there was not yet evidence that robust wage growth was exerting upward pressure on prices to a significant degree, but also that the possibility merited close monitoring.

On "Transitory" Inflation:

Participants noted that their contacts generally did not expect bottlenecks to be fully resolved until sometime next year or even later.

On Evergrande contagion:

Concerns over the period about the effects of COVID-19 developments on economic performance and, late in the period, about a heavily indebted Chinese property developer appeared to have only marginal net effects on financial asset prices.

...

On September 20, stock market prices fell notably and speculative-grade yield spreads widened amid rising concerns about the creditworthiness of a Chinese property developer, but these moves were mostly reversed during the following day, particularly in the stock market.

On the economy:

In discussing the uncertainty and risks associated with the economic outlook, participants noted that uncertainty remained high.

A number of participants judged that the uncertain course of the virus, supply chain disruptions, and labor shortages complicated the task of interpreting incoming economic data and assessing progress toward the Committee's goals. Participants generally saw the risks to the outlook for economic activity as broadly balanced. Uncertainty around the course of the virus, the resolution of supply constraints, and fiscal measures were cited as presenting both upside and downside risks. In addition, some participants mentioned the risks associated with high asset valuations in the United States and abroad, and a number of participants commented on the importance of resolving the issues involving the federal government budget and debt ceiling in a timely manner. Most participants saw inflation risks as weighted to the upside because of concerns that supply disruptions and labor shortages might last longer and might have larger or more persistent effects on prices and wages than they currently assumed.

A few participants commented that there were also some downside risks for inflation, as the factors that had held inflation down over the previous long expansion were likely still in place.

There was complete unanimity in the decision to taper:

All participants agreed that it would be appropriate for the current meeting's postmeeting statement to relay the Committee's judgment that, if progress continued broadly as expected, a moderation in the pace of asset purchases may soon be warranted

Finally, there were 18 mentions of COVID in Sept Minutes, up from 3 in August.

*  *  *

Read the full FOMC Minutes below:

Tyler Durden Wed, 10/13/2021 - 14:08

Read More

Continue Reading

International

Chronic stress and inflammation linked to societal and environmental impacts in new study

From anxiety about the state of the world to ongoing waves of Covid-19, the stresses we face can seem relentless and even overwhelming. Worse, these stressors…

Published

on

From anxiety about the state of the world to ongoing waves of Covid-19, the stresses we face can seem relentless and even overwhelming. Worse, these stressors can cause chronic inflammation in our bodies. Chronic inflammation is linked to serious conditions such as cardiovascular disease and cancer – and may also affect our thinking and behavior.   

Credit: Image: Vodovotz et al/Frontiers

From anxiety about the state of the world to ongoing waves of Covid-19, the stresses we face can seem relentless and even overwhelming. Worse, these stressors can cause chronic inflammation in our bodies. Chronic inflammation is linked to serious conditions such as cardiovascular disease and cancer – and may also affect our thinking and behavior.   

A new hypothesis published in Frontiers in Science suggests the negative impacts may extend far further.   

“We propose that stress, inflammation, and consequently impaired cognition in individuals can scale up to communities and populations,” explained lead author Prof Yoram Vodovotz of the University of Pittsburgh, USA.

“This could affect the decision-making and behavior of entire societies, impair our cognitive ability to address complex issues like climate change, social unrest, and infectious disease – and ultimately lead to a self-sustaining cycle of societal dysfunction and environmental degradation,” he added.

Bodily inflammation ‘mapped’ in the brain  

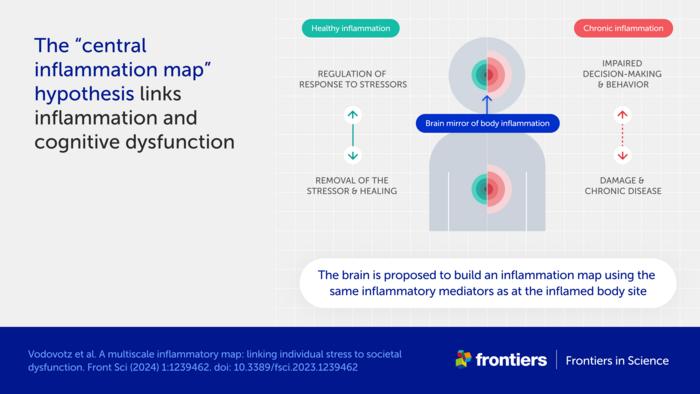
One central premise to the hypothesis is an association between chronic inflammation and cognitive dysfunction.  

“The cause of this well-known phenomenon is not currently known,” said Vodovotz. “We propose a mechanism, which we call the ‘central inflammation map’.”    

The authors’ novel idea is that the brain creates its own copy of bodily inflammation. Normally, this inflammation map allows the brain to manage the inflammatory response and promote healing.   

When inflammation is high or chronic, however, the response goes awry and can damage healthy tissues and organs. The authors suggest the inflammation map could similarly harm the brain and impair cognition, emotion, and behavior.   

Accelerated spread of stress and inflammation online   

A second premise is the spread of chronic inflammation from individuals to populations.  

“While inflammation is not contagious per se, it could still spread via the transmission of stress among people,” explained Vodovotz.   

The authors further suggest that stress is being transmitted faster than ever before, through social media and other digital communications.  

“People are constantly bombarded with high levels of distressing information, be it the news, negative online comments, or a feeling of inadequacy when viewing social media feeds,” said Vodovotz. “We hypothesize that this new dimension of human experience, from which it is difficult to escape, is driving stress, chronic inflammation, and cognitive impairment across global societies.”   

Inflammation as a driver of social and planetary disruption  

These ideas shift our view of inflammation as a biological process restricted to an individual. Instead, the authors see it as a multiscale process linking molecular, cellular, and physiological interactions in each of us to altered decision-making and behavior in populations – and ultimately to large-scale societal and environmental impacts.  

“Stress-impaired judgment could explain the chaotic and counter-intuitive responses of large parts of the global population to stressful events such as climate change and the Covid-19 pandemic,” explained Vodovotz.  

“An inability to address these and other stressors may propagate a self-fulfilling sense of pervasive danger, causing further stress, inflammation, and impaired cognition in a runaway, positive feedback loop,” he added.  

The fact that current levels of global stress have not led to widespread societal disorder could indicate an equally strong stabilizing effect from “controllers” such as trust in laws, science, and multinational organizations like the United Nations.   

“However, societal norms and institutions are increasingly being questioned, at times rightly so as relics of a foregone era,” said Prof Paul Verschure of Radboud University, the Netherlands, and a co-author of the article. “The challenge today is how we can ward off a new adversarial era of instability due to global stress caused by a multi-scale combination of geopolitical fragmentation, conflicts, and ecological collapse amplified by existential angst, cognitive overload, and runaway disinformation.”    

Reducing social media exposure as part of the solution  

The authors developed a mathematical model to test their ideas and explore ways to reduce stress and build resilience.  

“Preliminary results highlight the need for interventions at multiple levels and scales,” commented co-author Prof Julia Arciero of Indiana University, USA.  

“While anti-inflammatory drugs are sometimes used to treat medical conditions associated with inflammation, we do not believe these are the whole answer for individuals,” said Dr David Katz, co-author and a specialist in preventive and lifestyle medicine based in the US. “Lifestyle changes such as healthy nutrition, exercise, and reducing exposure to stressful online content could also be important.”  

“The dawning new era of precision and personalized therapeutics could also offer enormous potential,” he added.  

At the societal level, the authors suggest creating calm public spaces and providing education on the norms and institutions that keep our societies stable and functioning.  

“While our ‘inflammation map’ hypothesis and corresponding mathematical model are a start, a coordinated and interdisciplinary research effort is needed to define interventions that would improve the lives of individuals and the resilience of communities to stress. We hope our article stimulates scientists around the world to take up this challenge,” Vodovotz concluded.  

The article is part of the Frontiers in Science multimedia article hub ‘A multiscale map of inflammatory stress’. The hub features a video, an explainer, a version of the article written for kids, and an editorial, viewpoints, and policy outlook from other eminent experts: Prof David Almeida (Penn State University, USA), Prof Pietro Ghezzi (University of Urbino Carlo Bo, Italy), and Dr Ioannis P Androulakis (Rutgers, The State University of New Jersey, USA). 


Read More

Continue Reading

International

Acadia’s Nuplazid fails PhIII study due to higher-than-expected placebo effect

After years of trying to expand the market territory for Nuplazid, Acadia Pharmaceuticals might have hit a dead end, with a Phase III fail in schizophrenia…

Published

on

After years of trying to expand the market territory for Nuplazid, Acadia Pharmaceuticals might have hit a dead end, with a Phase III fail in schizophrenia due to the placebo arm performing better than expected.

Steve Davis

“We will continue to analyze these data with our scientific advisors, but we do not intend to conduct any further clinical trials with pimavanserin,” CEO Steve Davis said in a Monday press release. Acadia’s stock $ACAD dropped by 17.41% before the market opened Tuesday.

Pimavanserin, a serotonin inverse agonist and also a 5-HT2A receptor antagonist, is already in the market with the brand name Nuplazid for Parkinson’s disease psychosis. Efforts to expand into other indications such as Alzheimer’s-related psychosis and major depression have been unsuccessful, and previous trials in schizophrenia have yielded mixed data at best. Its February presentation does not list other pimavanserin studies in progress.

The Phase III ADVANCE-2 trial investigated 34 mg pimavanserin versus placebo in 454 patients who have negative symptoms of schizophrenia. The study used the negative symptom assessment-16 (NSA-16) total score as a primary endpoint and followed participants up to week 26. Study participants have control of positive symptoms due to antipsychotic therapies.

The company said that the change from baseline in this measure for the treatment arm was similar between the Phase II ADVANCE-1 study and ADVANCE-2 at -11.6 and -11.8, respectively. However, the placebo was higher in ADVANCE-2 at -11.1, when this was -8.5 in ADVANCE-1. The p-value in ADVANCE-2 was 0.4825.

In July last year, another Phase III schizophrenia trial — by Sumitomo and Otsuka — also reported negative results due to what the company noted as Covid-19 induced placebo effect.

According to Mizuho Securities analysts, ADVANCE-2 data were disappointing considering the company applied what it learned from ADVANCE-1, such as recruiting patients outside the US to alleviate a high placebo effect. The Phase III recruited participants in Argentina and Europe.

Analysts at Cowen added that the placebo effect has been a “notorious headwind” in US-based trials, which appears to “now extend” to ex-US studies. But they also noted ADVANCE-1 reported a “modest effect” from the drug anyway.

Nonetheless, pimavanserin’s safety profile in the late-stage study “was consistent with previous clinical trials,” with the drug having an adverse event rate of 30.4% versus 40.3% with placebo, the company said. Back in 2018, even with the FDA approval for Parkinson’s psychosis, there was an intense spotlight on Nuplazid’s safety profile.

Acadia previously aimed to get Nuplazid approved for Alzheimer’s-related psychosis but had many hurdles. The drug faced an adcomm in June 2022 that voted 9-3 noting that the drug is unlikely to be effective in this setting, culminating in a CRL a few months later.

As for the company’s next R&D milestones, Mizuho analysts said it won’t be anytime soon: There is the Phase III study for ACP-101 in Prader-Willi syndrome with data expected late next year and a Phase II trial for ACP-204 in Alzheimer’s disease psychosis with results anticipated in 2026.

Acadia collected $549.2 million in full-year 2023 revenues for Nuplazid, with $143.9 million in the fourth quarter.

Read More

Continue Reading

Uncategorized

Digital Currency And Gold As Speculative Warnings

Over the last few years, digital currencies and gold have become decent barometers of speculative investor appetite. Such isn’t surprising given the evolution…

Published

on

Over the last few years, digital currencies and gold have become decent barometers of speculative investor appetite. Such isn’t surprising given the evolution of the market into a “casino” following the pandemic, where retail traders have increased their speculative appetites.

“Such is unsurprising, given that retail investors often fall victim to the psychological behavior of the “fear of missing out.” The chart below shows the “dumb money index” versus the S&P 500. Once again, retail investors are very long equities relative to the institutional players ascribed to being the “smart money.””

“The difference between “smart” and “dumb money” investors shows that, more often than not, the “dumb money” invests near market tops and sells near market bottoms.”

Net Smart Dumb Money vs Market

That enthusiasm has increased sharply since last November as stocks surged in hopes that the Federal Reserve would cut interest rates. As noted by Sentiment Trader:

“Over the past 18 weeks, the straight-up rally has moved us to an interesting juncture in the Sentiment Cycle. For the past few weeks, the S&P 500 has demonstrated a high positive correlation to the ‘Enthusiasm’ part of the cycle and a highly negative correlation to the ‘Panic’ phase.”

Investor Enthusiasm

That frenzy to chase the markets, driven by the psychological bias of the “fear of missing out,” has permeated the entirety of the market. As noted in This Is Nuts:”

“Since then, the entire market has surged higher following last week’s earnings report from Nvidia (NVDA). The reason I say “this is nuts” is the assumption that all companies were going to grow earnings and revenue at Nvidia’s rate. There is little doubt about Nvidia’s earnings and revenue growth rates. However, to maintain that growth pace indefinitely, particularly at 32x price-to-sales, means others like AMD and Intel must lose market share.”

Nvidia Price To Sales

Of course, it is not just a speculative frenzy in the markets for stocks, specifically anything related to “artificial intelligence,” but that exuberance has spilled over into gold and cryptocurrencies.

Birds Of A Feather

There are a couple of ways to measure exuberance in the assets. While sentiment measures examine the broad market, technical indicators can reflect exuberance on individual asset levels. However, before we get to our charts, we need a brief explanation of statistics, specifically, standard deviation.

As I discussed in “Revisiting Bob Farrell’s 10 Investing Rules”:

“Like a rubber band that has been stretched too far – it must be relaxed in order to be stretched again. This is exactly the same for stock prices that are anchored to their moving averages. Trends that get overextended in one direction, or another, always return to their long-term average. Even during a strong uptrend or strong downtrend, prices often move back (revert) to a long-term moving average.”

The idea of “stretching the rubber band” can be measured in several ways, but I will limit our discussion this week to Standard Deviation and measuring deviation with “Bollinger Bands.”

“Standard Deviation” is defined as:

“A measure of the dispersion of a set of data from its mean. The more spread apart the data, the higher the deviation. Standard deviation is calculated as the square root of the variance.”

In plain English, this means that the further away from the average that an event occurs, the more unlikely it becomes. As shown below, out of 1000 occurrences, only three will fall outside the area of 3 standard deviations. 95.4% of the time, events will occur within two standard deviations.

Standard Deviation Chart

A second measure of “exuberance” is “relative strength.”

“In technical analysis, the relative strength index (RSI) is a momentum indicator that measures the magnitude of recent price changes to evaluate overbought or oversold conditions in the price of a stock or other asset. The RSI is displayed as an oscillator (a line graph that moves between two extremes) and can read from 0 to 100.

Traditional interpretation and usage of the RSI are that values of 70 or above indicate that a security is becoming overbought or overvalued and may be primed for a trend reversal or corrective pullback in price. An RSI reading of 30 or below indicates an oversold or undervalued condition.” – Investopedia

With those two measures, let’s look at Nvidia (NVDA), the poster child of speculative momentum trading in the markets. Nvidia trades more than 3 standard deviations above its moving average, and its RSI is 81. The last time this occurred was in July of 2023 when Nvidia consolidated and corrected prices through November.

NVDA chart vs Bollinger Bands

Interestingly, gold also trades well into 3 standard deviation territory with an RSI reading of 75. Given that gold is supposed to be a “safe haven” or “risk off” asset, it is instead getting swept up in the current market exuberance.

Gold vs Bollinger Bands

The same is seen with digital currencies. Given the recent approval of spot, Bitcoin exchange-traded funds (ETFs), the panic bid to buy Bitcoin has pushed the price well into 3 standard deviation territory with an RSI of 73.

Bitcoin vs Bollinger Bands

In other words, the stock market frenzy to “buy anything that is going up” has spread from just a handful of stocks related to artificial intelligence to gold and digital currencies.

It’s All Relative

We can see the correlation between stock market exuberance and gold and digital currency, which has risen since 2015 but accelerated following the post-pandemic, stimulus-fueled market frenzy. Since the market, gold and cryptocurrencies, or Bitcoin for our purposes, have disparate prices, we have rebased the performance to 100 in 2015.

Gold was supposed to be an inflation hedge. Yet, in 2022, gold prices fell as the market declined and inflation surged to 9%. However, as inflation has fallen and the stock market surged, so has gold. Notably, since 2015, gold and the market have moved in a more correlated pattern, which has reduced the hedging effect of gold in portfolios. In other words, during the subsequent market decline, gold will likely track stocks lower, failing to provide its “wealth preservation” status for investors.

SP500 vs Gold

The same goes for cryptocurrencies. Bitcoin is substantially more volatile than gold and tends to ebb and flow with the overall market. As sentiment surges in the S&P 500, Bitcoin and other cryptocurrencies follow suit as speculative appetites increase. Unfortunately, for individuals once again piling into Bitcoin to chase rising prices, if, or when, the market corrects, the decline in cryptocurrencies will likely substantially outpace the decline in market-based equities. This is particularly the case as Wall Street can now short the spot-Bitcoin ETFs, creating additional selling pressure on Bitcoin.

SP500 vs Bitcoin

Just for added measure, here is Bitcoin versus gold.

Gold vs Bitcoin

Not A Recommendation

There are many narratives surrounding the markets, digital currency, and gold. However, in today’s market, more than in previous years, all assets are getting swept up into the investor-feeding frenzy.

Sure, this time could be different. I am only making an observation and not an investment recommendation.

However, from a portfolio management perspective, it will likely pay to remain attentive to the correlated risk between asset classes. If some event causes a reversal in bullish exuberance, cash and bonds may be the only place to hide.

The post Digital Currency And Gold As Speculative Warnings appeared first on RIA.

Read More

Continue Reading

Trending