First Citizens BancShares Reports Fourth Quarter 2022 Earnings
PR Newswire
RALEIGH, N.C., Jan. 26, 2023
RALEIGH, N.C., Jan. 26, 2023 /PRNewswire/ -- First Citizens BancShares, Inc. ("BancShares") (NASDAQ: FCNCA) reported earnings for the fourth quarter and year-to-date period ended December 31, 2022.
Chairman and CEO Frank B. Holding, Jr. commented on the financial results for the quarter and year ended December 31, 2022: "First Citizens delivered solid financial results in 2022 marked by strong top line growth, low credit losses and well controlled expenses. Since the completion of our merger with CIT on January 3, 2022, we have successfully integrated our two companies and are now focused on capitalizing on opportunities to create positive operating leverage by growing revenues and optimizing our operations. We continued to execute on our capital strategy in the fourth quarter, completing our stock repurchase plan while still exceeding our CET 1 target. Looking ahead, we believe that we will have the ability to resume share buybacks in the second half of this year. We have also remained diligent in positioning ourselves to meet the regulatory requirements of a new large financial institution."
Holding added: "We are pleased with the performance of our lines of business during the year, achieving robust loan growth in the General Bank and in Industry Verticals and Business Capital within the Commercial Bank. Despite a challenging environment for deposits driven by unprecedented quantitative tightening, we experienced modest growth in noninterest checking accounts and only experienced a slight decline in deposits during the year. During the fourth quarter, deposits grew at an annualized rate of 8.4% driven by growth in our Direct Bank."
Holding concluded: "While we acknowledge concerns in the broader economy, and although we experienced an increase in nonaccrual loans during the fourth quarter, overall credit quality remains strong, and we are not seeing signs of significant loan portfolio deterioration. We enter 2023 with solid capital and liquidity positions and we believe that we are well positioned to continue to build customer relationships and grow our balance sheet profitably. And last but not least, I want to thank all of our associates for working so hard in 2022 on merger integration and to support our stockholders, customers and communities."
FINANCIAL HIGHLIGHTS
For the fourth quarter, net income available to common stockholders was $243 million, or $16.67 per diluted common share, compared to $303 million, or $19.25 per diluted common share in the third quarter of 2022. Fourth quarter results were impacted by the strategic decision to exit $1.2 billion of Bank Owned Life Insurance policies. The surrender of the policies resulted in a tax charge of $55 million. Favorable market conditions prompted us to exit this long-term, illiquid asset and, as we receive proceeds from the surrender, it increases our capital and liquidity positions while at the same time allowing us to invest in highly liquid assets at higher yields. During the fourth quarter, we repurchased 472,586 shares of Class A common stock for a total cost of $398 million. For the year, we repurchased 1,500,000 shares of Class A common stock for a total cost of $1.2 billion.
Fourth quarter adjusted net income available to common stockholders was $306 million, or $20.94 per diluted common share, as compared to $326 million, or $20.77 per diluted common share in the third quarter. The following bullets highlight significant changes in the components of net income and adjusted net income between the third and fourth quarters (see the supporting tables for a reconciliation of GAAP net income to adjusted net income):
Net interest income - Reported
Net interest income totaled $802 million compared to $795 million in the third quarter. The $7 million increase was primarily due to a higher yield on earning assets and loan growth, partially offset by higher funding costs and average balances.
Net interest margin was 3.36%, a decrease of 4 basis points compared to the third quarter. The yield on earning assets increased by 49 basis points while the cost of funding them increased by 53 basis points. The cost of funding earning assets increased due to higher rates paid on interest-bearing deposits and borrowings as well as a mix shift between noninterest-bearing and interest-bearing deposits.
Noninterest income and expense - Reported
Noninterest income totaled $429 million compared to $433 million in the third quarter, a decrease of $4 million. Rental income on operating lease equipment increased $5 million on a gross basis driven by continued improvement in utilization and a higher lease rate. Noninterest income from fee generating lines of business including service charges on deposit accounts, factoring and insurance commissions, card services and fee income and other service charges increased $8 million. Other noninterest income declined by $17 million, spread among various accounts.
Noninterest expense totaled $760 million for both the third and fourth quarters. While the total was unchanged over the prior quarter, there was a $6 million increase in marketing costs related to the Direct Bank and a $3 million increase in net occupancy expense due to increased repairs and utilities costs. These were offset by a $4 million decline in maintenance and depreciation expense on operating lease equipment, a $4 million decline in merger-related expenses and a $1 million decline in other operating expenses spread among various accounts.
Noninterest income and expense - Adjusted
Adjusted noninterest income totaled $290 million compared to $288 million in the third quarter, an increase of $2 million. The combination of higher rental income discussed above and a $4 million decline in depreciation and maintenance expense on operating lease equipment resulted in a $9 million increase in adjusted rental income on operating lease equipment. Noninterest income from fee generating lines of business including service charges on deposit accounts, factoring and insurance commissions, card services and fee income and other service charges increased $8 million. Other noninterest income declined by $15 million, spread among various accounts.
Adjusted noninterest expense totaled $590 million compared to $577 million in the third quarter, an increase of $13 million primarily due to the $6 million increase in marketing costs related to the Direct Bank, the $3 million increase in net occupancy expense noted above and a $4 million increase in other operating expenses spread among various accounts.
Credit
Provision for credit losses totaled $79 million compared to $60 million in the third quarter, an increase of $19 million. The increase was primarily due to an increase in net charge-offs and a reserve build in the quarter. The increase in allowance for credit losses over the prior quarter was due to changes in reserves on individually evaluated loans, loan growth and continued deterioration in the economic outlook, partially offset by a change in portfolio mix.
Net charge-offs totaled $24 million or a ratio of 0.14% of average loans, compared to $18 million or a ratio of 0.10% of average loans during the third quarter.
Nonaccrual loans as a percentage of total loans increased this quarter to 0.89% from 0.65%. The increase in nonaccrual loans was driven primarily by our non-owner occupied commercial real estate portfolio and more specifically related to general office exposure in the Commercial Bank segment.
Balance Sheet
Loans totaled $70.8 billion, an increase of $1.0 billion, or 5.6% on an annualized basis due to strong growth in our branch network, Mortgage and Business Capital, partially offset by declines in Commercial Services and Real Estate Finance.
Deposits totaled $89.4 billion, an increase of $1.9 billion, or 8.4% on an annualized basis. Interest-bearing deposits increased $3.5 billion driven primarily by the $2.5 billion of growth in the Direct Bank and the addition of $0.7 billion in brokered deposits.
Borrowings decreased $1.7 billion during the quarter, replaced by interest-bearing deposits to support our asset growth.
EARNINGS CALL DETAILS
BancShares will host a conference call and webcast to discuss the company's financial results on Thursday, January 26, 2023, at 9 a.m. Eastern time.
To access this call, dial:
United States: 1-844-200-6205 Canada: 1-833-950-0062 All other locations: 1-929-526-1599
Access code: 836216
The fourth quarter 2022 earnings presentation and this news release are available on the company's website at ir.firstcitizens.com, and the conference call will be webcast live at this same location.
A replay of the call will be available until Thursday, February 16, 2023, by calling 1-866-813-9403 (United States), 1-226-828-7578 (Canada) or +44-204-525-0658 (all other locations) and referencing access code 724723. A webcast archive of the conference call will be available through February 16, 2023, at ir.firstcitizens.com.
ABOUT FIRST CITIZENS BANCSHARES
First Citizens BancShares, Inc. (NASDAQ: FCNCA), a top 20 U.S. financial institution with more than $100 billion in assets, is the financial holding company for First-Citizens Bank & Trust Company ("First Citizens Bank"). First Citizens Bank helps personal, business, commercial and wealth clients build financial strength that lasts. Founded in 1898 and headquartered in Raleigh, N.C., First Citizens is the largest family-controlled bank in the United States, providing a unique legacy of strength, stability and long-term thinking that has spanned generations. First Citizens Bank offers an array of general banking services including a network of 500-plus branches in 22 states; commercial banking expertise delivering best-in-class lending, leasing and other financial services coast to coast; and a nationwide direct bank. Discover more at firstcitizens.com.
FORWARD-LOOKING STATEMENTS
This communication contains "forward-looking statements" within the meaning of the Private Securities Litigation Reform Act of 1995 regarding the financial condition, results of operations, business plans and future performance of BancShares. Words such as "anticipates," "believes," "estimates," "expects," "predicts," "forecasts," "intends," "plans," "projects," "targets," "designed," "could," "may," "should," "will," "potential," "continue", "aims" or other similar words and expressions are intended to identify these forward-looking statements. These forward-looking statements are based on BancShares' current expectations and assumptions regarding BancShares' business, the economy, and other future conditions.
Because forward-looking statements relate to future results and occurrences, they are subject to inherent risks, uncertainties, changes in circumstances and other risk factors that are difficult to predict. Many possible events or factors could affect BancShares' future financial results and performance and could cause the actual results, performance or achievements of BancShares to differ materially from any anticipated results expressed or implied by such forward-looking statements. Such risks and uncertainties include, among others, general competitive, economic, political, geopolitical events (including the military conflict between Russia and Ukraine) and market conditions, the impacts of the global COVID-19 pandemic on BancShares' business and customers, the financial success or changing conditions or strategies of BancShares' customers or vendors, fluctuations in interest rates, actions of government regulators, including the recent and projected interest rate hikes by the Board of Governors of the Federal Reserve Board (the "Federal Reserve"), the potential impact of decisions by the Federal Reserve on BancShares' capital plans, adverse developments with respect to U.S. or global economic conditions, including the significant turbulence in the capital or financial markets, the impact of the current inflationary environment, the impact of implementation and compliance with current or proposed laws, regulations and regulatory interpretations, the availability of capital and personnel, the timing and authorization of any future repurchases of our Class A common under potential share repurchase programs and the failure to realize the anticipated benefits of BancShares' previous acquisition transaction(s), including the recently completed transaction with CIT, which acquisition risks include (1) disruption from the transaction, or recently completed mergers, with customer, supplier or employee relationships, (2) the possibility that the amount of the costs, fees, expenses and charges related to the transaction may be greater than anticipated, including as a result of unexpected or unknown factors, events or liabilities, (3) reputational risk and the reaction of the parties' customers to the transaction, (4) the risk that the cost savings and any revenue synergies from the transaction may not be realized or take longer than anticipated to be realized and (5) difficulties experienced in the integration of the businesses.
Except to the extent required by applicable laws or regulations, BancShares disclaims any obligation to update forward-looking statements or to publicly announce the results of any revisions to any of the forward-looking statements included herein to reflect future events or developments. Additional factors which could affect the forward-looking statements can be found in BancShares' Annual Report on Form 10-K for the fiscal year ended December 31, 2021, and its other filings with the Securities and Exchange Commission (the "SEC").
NON-GAAP MEASURES
Certain measures in this release and supporting tables, including those referenced as "Adjusted", are "Non-GAAP", meaning they are not presented in accordance with generally accepted accounting principles in the U.S. ("GAAP") and also are not codified in U.S. banking regulations currently applicable to BancShares. BancShares believes that Non-GAAP financial measures, when reviewed in conjunction with GAAP financial information, can provide transparency about or an alternative means of assessing its operating results and financial position to its investors, analysts and management. Non-GAAP measures should be considered a supplement to, and not a substitute for, financial measures prepared in accordance with GAAP. The Non-GAAP measures are reconciled to the most directly comparable GAAP measure, in the Non-GAAP reconciliation table(s) at the end of this earnings release, and notable items are summarized in a separate table.
Dollars in millions, except per share data
BancShares
BancShares
BancShares
BancShares
BancShares
QTD
QTD
QTD
YTD
YTD
Summary Financial Data & Key Metrics
12/31/22
9/30/22
12/31/21
12/31/22
12/31/21
Results of Operations:
Net interest income
$
802
795
357
2,946
1,390
Provision (benefit) for credit losses
79
60
(5)
645
(37)
Net interest income after provision for credit losses
723
735
362
2,301
1,427
Noninterest income
429
433
114
2,136
508
Noninterest expense
760
760
323
3,075
1,234
Income before income taxes
392
408
153
1,362
701
Income tax expense
135
93
30
264
154
Net income
257
315
123
1,098
547
Preferred stock dividends
14
12
4
50
18
Net income available to common stockholders
$
243
303
119
1,048
529
Adjusted net income available to common stockholders(1)
306
326
126
1,201
509
Pre-tax, pre-provision net revenue (PPNR)(1)
471
468
148
2,007
664
Per Share Information:
Diluted earnings per common share (EPS)
$
16.67
19.25
12.09
67.40
53.88
Adjusted diluted earnings per common share (EPS)(1)
20.94
20.77
12.82
77.24
51.88
Book value per common share
605.36
597.75
447.95
605.36
447.95
Tangible book value per common share (TBV)(1)
571.89
564.97
410.74
571.89
410.74
Key Performance Metrics:
Return on average assets (ROA)
0.93 %
1.16 %
0.84 %
1.01 %
1.00 %
Adjusted ROA(1)
1.15
1.24
0.89
1.15
0.96
PPNR ROA(1)
1.70
1.72
1.01
1.84
1.21
Adjusted PPNR ROA(1)
1.81
1.86
1.08
1.64
1.16
Return on average common equity (ROE)
11.05
12.49
10.96
11.15
12.84
Adjusted ROE(1)
13.89
13.47
11.63
12.78
12.36
Return on average tangible common equity (ROTCE)(1)
11.70
13.17
12.00
11.78
14.12
Adjusted ROTCE(1)
14.71
14.20
12.72
13.50
13.60
Efficiency ratio
61.74
61.91
68.52
60.50
64.98
Adjusted efficiency ratio(1)
54.08
53.32
66.31
56.40
65.11
Net interest margin (NIM)(2)
3.36
3.40
2.58
3.14
2.66
Select Balance Sheet Items at Period End:
Total investment securities
$
19,369
18,841
13,110
19,369
13,110
Total loans and leases
70,781
69,790
32,372
70,781
32,372
Total operating lease equipment, net
8,156
7,984
—
8,156
—
Total deposits
89,408
87,553
51,406
89,408
51,406
Total borrowings
6,645
8,343
1,784
6,645
1,784
Loan to deposit ratio
79.17 %
79.71 %
62.97 %
79.17 %
62.97 %
Noninterest-bearing deposits to total deposits
27.87 %
30.37 %
41.64 %
27.87 %
41.64 %
Capital Ratios at Period End: (3)
Total risk-based capital ratio
13.18 %
13.46 %
14.35 %
13.18 %
14.35 %
Tier 1 risk-based capital ratio
11.06
11.36
12.47
11.06
12.47
Common equity Tier 1 ratio
10.08
10.37
11.50
10.08
11.50
Tier 1 leverage capital ratio
9.06
9.31
7.59
9.06
7.59
Asset Quality at Period End:
Nonaccrual loans to total loans and leases
0.89 %
0.65 %
0.37 %
0.89 %
0.37 %
Allowance for credit losses (ACL) to loans and leases
1.30
1.26
0.55
1.30
0.55
Net charge-off ratio
0.14
0.10
-0.01
0.12
0.03
(1) Denotes a non-GAAP measure. Refer to the non-GAAP reconciliation subsequently included in these materials for a reconciliation to the most directly comparable GAAP measure. "Adjusted" items exclude the impact of Notable Items.
(2) Calculated net of average credit balances of factoring clients.
(3) Capital ratios for the current quarter are preliminary pending completion of quarterly regulatory filings.
Dollars in millions, except share and per share data
BancShares
BancShares
BancShares
BancShares
BancShares
QTD
QTD
QTD
YTD
YTD
Income Statement (unaudited)
12/31/22
9/30/22
12/31/21
12/31/22
12/31/21
Interest income
Interest and fees on loans
$
892
785
328
2,953
1,295
Interest on investment securities
92
90
39
354
145
Interest on deposits at banks
56
31
4
106
11
Total interest income
1,040
906
371
3,413
1,451
Interest expense
Deposits
176
78
8
335
33
Borrowings
62
33
6
132
28
Total interest expense
238
111
14
467
61
Net interest income
802
795
357
2,946
1,390
Provision (benefit) for credit losses
79
60
(5)
645
(37)
Net interest income after provision for credit losses
723
735
362
2,301
1,427
Noninterest income
Rental income on operating lease equipment
224
219
—
864
—
Fee income and other service charges
45
44
11
163
42
Wealth management services
35
35
33
142
129
Service charges on deposit accounts
23
21
26
100
95
Factoring commissions
26
24
—
104
—
Cardholder services, net
26
25
22
102
87
Merchant services, net
8
8
7
35
33
Insurance commissions
13
11
4
47
16
Realized gain on sale of investment securities available for sale, net
—
—
—
—
33
Fair value adjustment on marketable equity securities, net
2
(2)
3
(3)
34
Bank-owned life insurance
7
8
1
32
3
Gain on sale of leasing equipment, net
2
2
—
15
—
Gain on acquisition
—
—
—
431
—
Gain on extinguishment of debt
—
1
—
7
—
Other noninterest income
18
37
7
97
36
Total noninterest income
429
433
114
2,136
508
Noninterest expense
Depreciation on operating lease equipment
88
87
—
345
—
Maintenance and other operating lease expenses
47
52
—
189
—
Salaries and benefits
352
351
193
1,396
759
Net occupancy expense
50
47
30
194
117
Equipment expense
55
55
30
216
119
Professional fees
13
13
7
57
20
Third-party processing fees
26
27
16
103
60
FDIC insurance expense
5
5
4
31
14
Marketing
21
15
3
53
10
Merger-related expenses
29
33
9
231
29
Intangible asset amortization
6
5
3
23
12
Other noninterest expense
68
70
28
237
94
Total noninterest expense
760
760
323
3,075
1,234
Income before income taxes
392
408
153
1,362
701
Income tax expense
135
93
30
264
154
Net income
$
257
315
123
1,098
547
Preferred stock dividends
14
12
4
50
18
Net income available to common stockholders
$
243
303
119
1,048
529
Basic earnings per common share
$
16.69
19.27
12.09
67.47
53.88
Diluted earnings per common share
$
16.67
19.25
12.09
67.40
53.88
Weighted average common shares outstanding (basic)
14,590,387
15,711,976
9,816,405
15,531,924
9,816,405
Weighted average common shares outstanding (diluted)
14,607,426
15,727,993
9,816,405
15,549,944
9,816,405
Dollars in millions
BancShares
BancShares
BancShares
Balance Sheet (unaudited)
12/31/22
9/30/22
12/31/21
Assets
Cash and due from banks
$
518
481
338
Interest-earning deposits at banks
5,025
6,172
9,115
Investment in marketable equity securities
95
92
98
Investment securities available for sale
8,995
9,088
9,203
Investment securities held to maturity
10,279
9,661
3,809
Assets held for sale
60
21
99
Loans and leases
70,781
69,790
32,372
Allowance for credit losses
(922)
(882)
(178)
Loans and leases, net of allowance for credit losses
69,859
68,908
32,194
Operating lease equipment, net
8,156
7,984
—
Premises and equipment, net
1,456
1,410
1,233
Goodwill
346
346
346
Other intangible assets
140
145
19
Other assets
4,369
5,002
1,855
Total assets
$
109,298
109,310
58,309
Liabilities
Deposits:
Noninterest-bearing
$
24,922
26,587
21,405
Interest-bearing
64,486
60,966
30,001
Total deposits
89,408
87,553
51,406
Credit balances of factoring clients
995
1,147
—
Borrowings:
Short-term borrowings
2,186
3,128
589
Long-term borrowings
4,459
5,215
1,195
Total borrowings
6,645
8,343
1,784
Other liabilities
2,588
2,434
381
Total liabilities
99,636
99,477
53,571
Stockholders' equity
Preferred stock
881
881
340
Common stock:
Class A - $1 par value
14
14
9
Class B - $1 par value
1
1
1
Additional paid in capital
4,109
4,506
—
Retained earnings
5,392
5,160
4,378
Accumulated other comprehensive loss
(735)
(729)
10
Total stockholders' equity
9,662
9,833
4,738
Total liabilities and stockholders' equity
$
109,298
109,310
58,309
Dollars in millions, except share per share data
BancShares
BancShares
BancShares
BancShares
BancShares
QTD
QTD
QTD
YTD
YTD
Notable Items (1)
12/31/22
9/30/22
12/31/21
12/31/22
12/31/21
Noninterest income
Rental income on operating lease equipment (2)
$
(135)
(139)
—
(534)
—
Realized gain on sale of investment securities available for sale, net
—
—
—
—
(33)
Fair value adjustment on marketable equity securities, net
(2)
2
(3)
3
(34)
Gain on sale of leasing equipment, net
(2)
(2)
—
(15)
—
Gain on acquisition
—
—
—
(431)
—
Gain on extinguishment of debt
—
(1)
—
(7)
—
Other noninterest income (3)
—
(5)
—
(11)
—
Impact on adjusted noninterest income
(139)
(145)
(3)
(995)
(67)
Noninterest expense
Depreciation on operating lease equipment (2)
(88)
(87)
—
(345)
—
Maintenance and other operating lease expenses (2)
(47)
(52)
—
(189)
—
Merger-related expenses
(29)
(33)
(9)
(231)
(29)
Intangible asset amortization
(6)
(5)
(3)
(23)
(12)
Other noninterest expense (4)
—
(6)
—
18
—
Impact on adjusted noninterest expense
(170)
(183)
(12)
(770)
(41)
CECL Day 2 provision and reserve for unfunded commitments
—
—
—
(513)
—
Impact on adjusted pre-tax income
31
38
9
288
(26)
Income tax impact (5) (6)
(32)
15
2
135
(6)
Impact on adjusted net income
$
63
23
7
153
(20)
Impact on adjusted diluted EPS
$
4.27
1.52
0.73
9.84
(2.00)
(1) Notable items include income and expense for infrequent transactions and certain recurring items (typically noncash) that Management believes should be excluded from adjusted measures (non-GAAP) to enhance understanding of operations and comparability to historical periods. Management utilizes both GAAP and adjusted measures (non-GAAP) to analyze the Company's performance. Refer to the Non-GAAP reconciliation table(s) at the end of this earnings release for a reconciliation of Non-GAAP measures to the most directly comparable GAAP measures.
(2) Depreciation and maintenance and other operating lease expenses are reclassified from noninterest expense to a reduction of rental income on operating lease equipment. There is no net impact to earnings for this notable item as adjusted noninterest income and expense are reduced by the same amount. Adjusted rental income on operating lease equipment (non-GAAP) is net of depreciation and maintenance expense for operating lease equipment. Management believes this measure enhances comparability to banking peers, primarily due to the extent of our rail and other equipment rental activities. Refer to the Non-GAAP reconciliation table(s) at the end of this earnings release for a reconciliation of Non-GAAP measures to the most directly comparable GAAP measure.
(3) Primarily includes the following: 3Q22- contract settlement with a rail customer; YTD22- contract settlement with rail customer and gain on sale of other assets.
(4) Primarily includes the following: 3Q22- impairment of a call center facility; YTD22- impairment of a call center facility and termination of two post retirement benefit plans.
(5) Includes $55 million of tax expense related to the early surrender of BOLI policies. During 4Q22, management decided to early surrender $1.2 billion of BOLI policies. This triggered a taxable gain of $160 million and resulted in tax expense of $55 million.
(6) The income tax impact includes tax discrete items and changes in the estimated annualized effective tax rate.
Dollars in millions, except share and per share data
Condensed Income Statement (unaudited) - Adjusted for Notable Items (1)
BancShares
BancShares
BancShares
BancShares
BancShares
QTD
QTD
QTD
YTD
YTD
12/31/22
9/30/22
12/31/21
12/31/22
12/31/21
Interest income
$
1,040
906
371
3,413
1,451
Interest expense
238
111
14
467
61
Net interest income
802
795
357
2,946
1,390
Provision (benefit) for credit losses
79
60
(5)
132
(37)
Net interest income after provision for credit losses
723
735
362
2,814
1,427
Noninterest income
290
288
111
1,141
441
Noninterest expense
590
577
311
2,305
1,193
Income before income taxes
423
446
162
1,650
675
Income tax expense
103
108
32
399
148
Net income
$
320
338
130
1,251
527
Preferred stock dividends
14
12
4
50
18
Net income available to common stockholders
$
306
326
126
1,201
509
Basic earnings per common share
$
20.97
20.79
12.82
77.33
51.88
Diluted earnings per common share
$
20.94
20.77
12.82
77.24
51.88
Weighted average common shares outstanding (basic)
14,590,387
15,711,976
9,816,405
15,531,924
9,816,405
Weighted average common shares outstanding (diluted)
14,607,426
15,727,993
9,816,405
15,549,944
9,816,405
(1) The GAAP income statements and notable items are included previously in this communication. The condensed adjusted income statements above (non-GAAP) exclude the impacts of notable items. Refer to the Non-GAAP reconciliation table(s) at the end of this earnings release for a reconciliation of Non-GAAP measures to the most directly comparable GAAP measure.
Dollars in millions
BancShares
BancShares
BancShares
Loans & Leases by Class (end of period)
12/31/22
9/30/22
12/31/21
Loans & Leases by Class
Commercial
Commercial construction
$
2,804
2,752
1,238
Owner-occupied commercial mortgages
14,473
14,053
12,099
Non-owner-occupied commercial mortgages
9,902
9,683
3,041
Commercial and industrial
24,105
24,288
5,937
Leases
2,171
2,184
271
Total commercial
$
53,455
52,960
22,586
Consumer
Residential mortgage
$
13,309
12,910
6,088
Revolving mortgage
1,951
1,923
1,818
Consumer auto
1,414
1,385
1,332
Consumer other
652
612
548
Total consumer
$
17,326
16,830
9,786
Total loans and leases
$
70,781
69,790
32,372
Less: Allowance for credit losses
(922)
(882)
(178)
Total loans and leases, net of allowance for credit losses
$
69,859
68,908
32,194
BancShares
BancShares
BancShares
Deposits by Type (end of period)
12/31/22
9/30/22
12/31/21
Noninterest-bearing demand
$
24,922
26,587
21,405
Checking with interest
16,202
16,118
12,694
Money market
21,040
21,818
10,590
Savings
16,634
14,722
4,236
Time
10,610
8,308
2,481
Total deposits
$
89,408
87,553
51,406
Dollars in millions
BancShares
BancShares
BancShares
BancShares
BancShares
QTD
QTD
QTD
YTD
YTD
Credit Quality & Allowance
12/31/22
9/30/22
12/31/21
12/31/22
12/31/21
Nonaccrual loans
$
627
454
121
627
121
Ratio of nonaccrual loans to total loans
0.89 %
0.65 %
0.37 %
0.89 %
0.37 %
Charge-offs
$
39
33
9
146
36
Recoveries
(15)
(15)
(9)
(67)
(26)
Net charge-offs
$
24
18
—
79
10
Net charge-off ratio
0.14 %
0.10 %
(0.01) %
0.12 %
0.03 %
Allowance for credit losses to loans ratio
1.30 %
1.26 %
0.55 %
1.30 %
0.55 %
Allowance for credit losses - beginning
$
882
850
183
178
225
Initial PCD ACL
—
—
—
272
—
Day 2 provision, excluding provision for unfunded commitments
—
—
—
454
—
Provision (benefit) for credit losses
64
50
(5)
97
(37)
Net charge-offs
(24)
(18)
—
(79)
(10)
Allowance for credit losses - ending
$
922
882
178
922
178
Dollars in millions
Average Balance Sheet
BancShares QTD 12/31/22
BancShares QTD 09/30/22
BancShares QTD 12/31/21
Avg Balance
Income/ Expense
Yield/Rate
Avg Balance
Income/ Expense
Yield/Rate
Avg Balance
Income/ Expense
Yield/Rate
Loans and leases (1) (2)
$ 69,290
$ 892
5.09 %
$ 67,733
$ 785
4.58 %
$ 32,488
$ 328
3.98 %
Total investment securities
18,876
92
1.95
19,119
90
1.88
11,424
39
1.39
Interest-earning deposits at banks
6,193
56
3.60
5,685
31
2.17
10,690
4
0.15
Total interest-earning assets (2)
$ 94,359
$ 1,040
4.36 %
$ 92,537
$ 906
3.87 %
$ 54,602
$ 371
2.69 %
Operating lease equipment, net (including held for sale)
$ 8,049
$ 7,981
$ —
Cash and due from banks
500
489
337
Allowance for credit losses
(886)
(851)
(184)
All other non-interest-earning assets
7,770
7,831
3,361
Total assets
$ 109,792
$ 107,987
$ 58,116
Interest-bearing deposits:
Checking with interest
$ 15,985
$ 13
0.24 %
$ 16,160
$ 7
0.14 %
$ 11,994
$ 2
0.05 %
Money market
21,200
60
1.13
22,993
32
0.55
10,358
3
0.09
Savings
15,831
69
1.73
13,956
28
0.78
4,140
—
0.03
Time deposits
9,516
34
1.42
8,436
11
0.54
2,517
3
0.62
Total interest-bearing deposits
62,532
176
1.12
61,545
78
0.50
29,009
8
0.11
Borrowings:
Securities sold under customer repurchase agreements
514
—
0.27
617
1
0.16
650
1
0.16
Short-term FHLB borrowings
2,080
20
3.72
1,188
8
2.57
—
—
—
Short-term borrowings
2,594
20
3.04
1,805
9
1.74
650
1
0.16
Federal Home Loan Bank borrowings
2,818
28
3.85
1,784
11
2.45
645
1
1.28
Senior unsecured borrowings
906
4
2.03
898
5
2.00
—
—
—
Subordinated debt
1,051
9
3.38
1,054
8
3.21
497
3
3.34
Other borrowings
25
1
6.57
67
—
4.51
75
1
1.25
Long-term borrowings
4,800
42
3.42
3,803
24
2.59
1,217
5
2.12
Total borrowings
7,394
62
3.28
5,608
33
2.32
1,867
6
1.44
Total interest-bearing liabilities
$ 69,926
$ 238
1.35 %
$ 67,153
$ 111
0.65 %
$ 30,876
$ 14
0.19 %
Noninterest-bearing deposits
$ 26,510
$ 26,877
$ 22,229
Credit balances of factoring clients
1,174
1,089
—
Other noninterest-bearing liabilities
2,561
2,369
378
Stockholders' equity
9,621
10,499
4,633
Total liabilities and stockholders' equity
$ 109,792
$ 107,987
$ 58,116
Net interest income
$ 802
$ 795
$ 357
Net interest spread (2)
3.01 %
3.22 %
2.50 %
Net interest margin (2)
3.36 %
3.40 %
2.58 %
(1) Loans and leases include non-PCD and PCD loans, nonaccrual loans and held for sale. Interest income on loans and leases includes accretion income and loan fees.
(2) The balance and rate presented is calculated net of average credit balances of factoring clients.
Note: Certain items above do not precisely recalculate as presented due to rounding.
Dollars in millions
Average Balance Sheet
BancShares YTD 12/31/22
BancShares YTD 12/31/21
Avg Balance
Income/
Expense
Yield/Rate
Avg Balance
Income/
Expense
Yield/Rate
Loans and leases (1) (2)
$ 66,634
$ 2,953
4.41 %
$ 32,860
$ 1,295
3.91 %
Total investment securities
19,166
354
1.85
10,611
145
1.37
Interest-earning deposits at banks
7,726
106
1.38
8,349
11
0.13
Total interest-earning assets(2)
$ 93,526
$ 3,413
3.63 %
$ 51,820
$ 1,451
2.78 %
Operating lease equipment, net (including held for sale)
$ 7,982
$ —
Cash and due from banks
512
350
Allowance for credit losses
(875)
(202)
All other non-interest-earning assets
7,788
3,015
Total assets
$ 108,933
$ 54,983
Interest-bearing deposits:
Checking with interest
$ 16,323
$ 29
0.15 %
$ 11,258
$ 6
0.05 %
Money market
23,949
125
0.52
9,708
10
0.10
Savings
14,193
117
0.82
3,847
1
0.03
Time deposits
9,133
64
0.70
2,647
16
0.63
Total interest-bearing deposits
63,598
335
0.53
27,460
33
0.12
Borrowings:
Securities sold under customer repurchase agreements
590
1
0.19
660
1
0.20
Short-term FHLB borrowings
824
28
3.30
—
—
—
Short-term borrowings
1,414
29
2.00
660
1
0.20
Federal Home Loan Bank borrowings
1,414
43
2.96
648
8
1.28
Senior unsecured borrowings
1,348
25
1.87
—
—
—
Subordinated debt
1,056
33
3.15
498
15
3.35
Other borrowings
64
2
3.22
80
4
1.23
Long-term borrowings
3,882
103
2.64
1,226
27
2.12
Total borrowings
5,296
132
2.47
1,886
28
1.45
Total interest-bearing liabilities
$ 68,894
$ 467
0.68 %
$ 29,346
$ 61
0.21 %
Noninterest-bearing deposits
$ 26,318
$ 20,798
Credit balances of factoring clients
1,153
—
Other noninterest-bearing liabilities
2,292
378
Stockholders' equity
10,276
4,461
Total liabilities and stockholders' equity
$ 108,933
$ 54,983
Net interest income
$ 2,946
$ 1,390
Net interest spread (2)
2.95 %
2.57 %
Net interest margin (2)
3.14 %
2.66 %
(1) Loans and leases include non-PCD and PCD loans, nonaccrual loans and held for sale. Interest income on loans and leases includes accretion income and loan fees.
(2) The balance and rate presented is calculated net of average credit balances of factoring clients.
Note: Certain items above do not precisely recalculate as presented due to rounding.
Dollars in millions, except share and per share data
BancShares
BancShares
BancShares
BancShares
BancShares
QTD
QTD
QTD
YTD
YTD
Non-GAAP Reconciliations
12/31/22
9/30/22
12/31/21
12/31/22
12/31/21
Net income and EPS
Net income (GAAP)
a
$
257
315
123
1,098
547
Preferred stock dividends
14
12
4
50
18
Net income available to common stockholders (GAAP)
b
243
303
119
1,048
529
Total notable items, after income tax
c
63
23
7
153
(20)
Adjusted net income (non-GAAP)
d = (a+c)
320
338
130
1,251
527
Adjusted net income available to common stockholders (non-GAAP)
e = (b+c)
$
306
326
126
1,201
509
Weighted average common shares outstanding
Basic
f
14,590,387
15,711,976
9,816,405
15,531,924
9,816,405
Diluted
g
14,607,426
15,727,993
9,816,405
15,549,944
9,816,405
EPS (GAAP)
Basic
b/f
$
16.69
19.27
12.09
67.47
53.88
Diluted
b/g
16.67
19.25
12.09
67.40
53.88
Adjusted EPS (non-GAAP)
Basic
e/f
$
20.97
20.79
12.82
77.33
51.88
Diluted
e/g
20.94
20.77
12.82
77.24
51.88
Noninterest income and expense
Noninterest income
h
$
429
433
114
2,136
508
Impact of notable items, before income tax
(139)
(145)
(3)
(995)
(67)
Adjusted noninterest income
i
$
290
288
111
1,141
441
Noninterest expense
j
$
760
760
323
3,075
1,234
Impact of notable items, before income tax
(170)
(183)
(12)
(770)
(41)
Adjusted noninterest expense
k
$
590
577
311
2,305
1,193
Provision (benefit) for credit losses
Provision (benefit) for credit losses
$
79
60
(5)
645
(37)
Plus: Day 2 provision for credit losses
—
—
—
(513)
—
Adjusted provision (benefit) for credit losses
$
79
60
(5)
132
(37)
PPNR
Net income (GAAP)
a
$
257
315
123
1,098
547
Plus:
Provision (benefit) for credit losses
79
60
(5)
645
(37)
Income tax expense (benefit)
135
93
30
264
154
PPNR (non-GAAP)
l
$
471
468
148
2,007
664
Plus: total notable items, before income tax
31
38
9
(225)
(26)
Adjusted PPNR (non-GAAP)
m
$
502
506
157
1,782
638
Note: Certain items above do not precisely recalculate as presented due to rounding.
Dollars in millions, except share and per share data
BancShares
BancShares
BancShares
BancShares
BancShares
QTD
QTD
QTD
YTD
YTD
Non-GAAP Reconciliations (continued)
12/31/22
9/30/22
12/31/21
12/31/22
12/31/21
ROA
Net income (GAAP)
a
$
257
315
123
1,098
547
Annualized net income
n = a annualized
1,020
1,250
488
1,098
547
Adjusted net income (non-GAAP)
d
320
338
130
1,251
527
Annualized adjusted net income
p = d annualized
1,270
1,341
516
1,251
527
Average assets
o
109,792
107,987
58,116
108,933
54,983
ROA
n/o
0.93 %
1.16 %
0.84 %
1.01 %
1.00 %
Adjusted ROA
p/o
1.15 %
1.24 %
0.89 %
1.15 %
0.96 %
PPNR ROA
PPNR (non-GAAP)
l
$
471
468
148
2,007
664
Annualized PPNR
q = l annualized
1,868
1,858
589
2,007
664
Adjusted PPNR (non-GAAP)
m
502
506
157
1,782
638
Annualized PPNR
r = m annualized
1,992
2,009
622
1,782
638
PPNR ROA
q/o
1.70 %
1.72 %
1.01 %
1.84 %
1.21 %
Adjusted PPNR ROA
r/o
1.81 %
1.86 %
1.08 %
1.64 %
1.16 %
ROE and ROTCE
Annualized net income available to common stockholders
s = b annualized
$
964
1,202
472
1,048
529
Annualized adjusted net income available to common stockholders
t = e annualized
$
1,214
1,293
500
1,201
509
Average stockholders' equity (GAAP)
$
9,621
10,499
4,633
10,276
4,461
Less: average preferred stock
881
881
340
878
340
Average common stockholders' equity (non-GAAP)
u
$
8,740
9,618
4,293
9,398
4,121
Less: average goodwill
346
346
350
346
350
Less: average other intangible assets
143
148
21
156
25
Average tangible common equity (non-GAAP)
v
$
8,251
9,124
3,922
8,896
3,746
ROE
s/u
11.05 %
12.49 %
10.96 %
11.15 %
12.84 %
Adjusted ROE
t/u
13.89 %
13.47 %
11.63 %
12.78 %
12.36 %
ROTCE
s/v
11.70 %
13.17 %
12.00 %
11.78 %
14.12 %
Adjusted ROTCE
t/v
14.71 %
14.20 %
12.72 %
13.50 %
13.60 %
Tangible common equity to tangible assets
Stockholders' equity (GAAP)
w
$
9,662
9,833
4,738
9,662
4,738
Less: preferred stock
881
881
340
881
340
Common equity (non-GAAP)
x
$
8,781
8,952
4,398
8,781
4,398
Less: goodwill
346
346
346
346
346
Less: other intangible assets
140
145
19
140
19
Tangible common equity (non-GAAP)
y
$
8,295
8,461
4,033
8,295
4,033
Total assets (GAAP)
z
109,298
109,310
58,309
109,298
58,309
Tangible assets (non-GAAP)
aa
108,812
108,819
57,944
108,812
57,944
Total equity to total assets
w/z
8.84 %
9.00 %
8.13 %
8.84 %
8.13 %
Tangible common equity to tangible assets (non-GAAP)
y/aa
7.62 %
7.78 %
6.96 %
7.62 %
6.96 %
Note: Certain items above do not precisely recalculate as presented due to rounding.
Dollars in millions, except share and per share data
BancShares
BancShares
BancShares
BancShares
BancShares
QTD
QTD
QTD
YTD
YTD
Non-GAAP Reconciliations (continued)
12/31/22
9/30/22
12/31/21
12/31/22
12/31/21
Book value and tangible book value per common share
Common shares outstanding at period end
bb
14,506,200
14,976,127
9,816,405
14,506,200
9,816,405
Book value per share
x/bb
$
605.36
597.75
447.95
605.36
447.95
Tangible book value per share
y/bb
$
571.89
564.97
410.74
571.89
410.74
Efficiency ratio
Net interest income
cc
$
802
795
357
2,946
1,390
Efficiency ratio (GAAP)
j / (h + cc)
61.74 %
61.91 %
68.52 %
60.50 %
64.98 %
Adjusted efficiency ratio (non-GAAP)
k / (i + cc)
54.08 %
53.32 %
66.31 %
56.40 %
65.11 %
Rental income on operating lease equipment
Rental income on operating lease equipment
$
224
219
—
864
—
Less:
Depreciation on operating lease equipment
88
87
—
345
—
Maintenance and other operating lease expenses
47
52
—
189
—
Adjusted rental income on operating lease equipment
89
80
—
330
—
Note: Certain items above do not precisely recalculate as presented due to rounding.
Vetted by HousingWire | Our editors independently review the products we recommend. When you buy through our links, we may earn a commission.
Real estate is a vibrant, dynamic and competitive industry. From the thrill of a sale to the pursuit of new leads, it keeps you on your toes. That said, it can also be incredibly isolating, and it can be hard to stay motivated. As a way to deal with this, many agents and brokers seek out professional mentorship as a means to gain insight and level up their performance. Across the country, the best real estate coaches serve as valuable mentors who can help agents and brokers achieve the success they deserve.
“It’s really hard for independent business owners to get unbiased advice from themselves,” says Kyle Scott, President of SERHANT. Ventures. “So they need unbiased experts to work with that will help them grow their business — someone who has been there, who has done it, and who is able to see their business from both the 35,000-foot view and down in the weeds.”
A quick internet search will prove that real estate coaching programs are plentiful. Whether you’re looking to expand your team or client network or figure out how to delegate work so you can focus on the tasks you do best, a real estate coaching program could be a valuable launchpad. But when it comes to choosing the right one for your unique needs, there’s a lot to consider. Here, we highlight some of the best real estate coaches in the industry and their programs.
An unbiased view is worth millions. Often, we turn to our closest friends and family for guidance. Unfortunately, they’re usually not familiar with the ins and outs of the real estate industry and can’t provide you with the relevant feedback you need. As a result, many independent contractors rely on themselves, which generally doesn’t work either.
You can’t advise yourself, you’re too close to it. A coach works best for someone who is actually looking to grow their business, someone who is looking to put in the time and the energy to make a difference in achieving more income this year.
Hire a coach if you want to start taking your business to the next level for any reason — you want to make more money, have more freedom with your time, or stop riding the ins and outs of the commission cycle.President of SERHANT. Ventures
1. Sell It Like Serhant
Key Facts
Grown throughout the pandemic, the Sell It Like Serhant program has been carefully adapted to the current market. It follows a weekly and bi-weekly platform featuring one-on-one virtual coaching from Serhant’s proprietary video platform. After a half-hour or hour-long group meeting every week or every other week, participants follow actionable steps to help them grow their business. Thus far, more than 22,000 enrollees in 128 countries have been through the Sell It Like Serhant program.
What We Love
Serhant offers daily office hours so participants can pop into virtual sessions to ask questions or get expert advice between their regularly scheduled sessions. A community platform also allows participants to pass referrals to each other. Thus far, it seems to have worked: To date, participating agents have closed over $250 million of referral deals.
Pricing
There are different membership tiers, depending on the level of guidance you need. The introductory Real Estate Core Course starts at $497. Prices are higher for a more specific course or one with 1:1 coaching.
Who’s it Best For?
If you’re looking to build a memorable personal brand, SERHANT. is the way to go. “The number one differentiator about our program is we understand that as a real estate agent, you have one job: to generate leads,” says SERHANT. Ventures President Kyle Scott. “Our number one focus is helping you build a clear, compelling, memorable personal brand and put your lead generation on autopilot. So that way, you can do what you do best, which is build relationships and close deals.”
Visit Sell It Like Serhant
2. Tom Ferry International
Key Facts
For good reason, Ferry International refers to itself as the real estate industry’s leading coaching and training company. Focused on Ferry’s “8 Levels of Performance,” the programs are a staple of real estate coaching. Their new group coaching sessions cover various aspects of real estate sales.
Prospecting Bootcamp is a 14-hour program comprised of seven two-hour group coaching sessions, and includes a peer-to-peer collaboration space. It involves independent work pulled from training videos and downloadable resources.
Recruitment Roadmap consists of hour-long sessions each week for ten weeks. Completed over Zoom and through the Tom Ferry video platform, each group coaching program offers a high level of specialization.
Finally, their Fast Track program offers 12 interactive group coaching sessions designed to help new agents build the necessary skills to succeed — like mastering listing presentations and handling objections.
What we love
If you’re looking for the gold standard of real estate coaching, Tom Ferry has the goods to back up the bravado. Because of their many years in the biz, Tom Ferry has a huge base of coaches, which means there are plenty of options to find the program best suited for your specific needs.
Pricing
Tom Ferry’s Prospecting Bootcamp and Fast Track coaching programs cost $999 but can be broken down into three monthly payments. The Recruitment Roadmap group coaching costs $1,499 but can be split into three monthly payments of $500. Consider their free coaching consultation if you want to dip your toes in the water. Check out their customer reviews, where several coaching program alums rave about the program.
Who’s it Best For?
If you thrive in a group setting that allows you to feed off the energy of others, Tom Ferry might be right for you. Their group coaching programs are new and more affordable alternatives to often costly 1:1 coaching fees.
Visit Tom Ferry
3. Tim and Julie Harris
Key Facts
The dynamic duo of real estate coaching, Tim and Julie Harris are a major name in the industry. Under their business, Harris Real Estate Coaching, their programs are divided into three tiers: Premier, Premier Plus, and VIP, all of which rely on a user-friendly online platform.
Pricing
Premier platform costs $197 per month, but a 30-day free trial is available. Premier Plus costs $599 per month, while VIP costs $999 per month. Of course, their wildly successful podcast is a great free resource to tap into, as well as Tim and Julie’s many written contributions to HousingWire.
Who’s it Best For?
If you’re constantly on the go, the ability to access the course from any device is a major asset.
4. Candy Miles-Crocker
Key Facts
Newbies are welcome at Candy Miles Crocker’s program. Known as the “Real Life Realtor,” she’s the brain behind Real Life Real Estate Training. With a variety of courses in her offerings, including a plethora of self-paced online courses, Miles-Crocker gives new agents a leg-up on the rest.
What we love
Miles-Crocker is still an active agent, working with clients to close deals. Her 20+ years of experience practicing in Washington, D.C., Virginia and Maryland have helped her build “systems, strategies and scripts” that she shares with her coaching clients.
Pricing
The CORE Essentials Blueprint program retails for $1,597. Smaller, more specific courses, such as The Buyer Presentation, are priced at $347. While all pricing isn’t listed on her website, Miles-Crocker also offers a free course that includes her 6-point system for growth.
Who’s it Best For?
Miles-Crocker’s courses could be beneficial if you are new to agent life or looking to get your business reorganized. She even has one specifically for your first 30 days as a real estate agent.
5. Ashley Harwood
Key Facts
Boston-based Ashley Harwood inspires introverts with her convincing, heartfelt and high-touch approach to practicing real estate. Her very human, very relatable Move Over Extroverts coaching approach is the perfect antidote for cheerleader-style coaches that urge you to door-knock, chase down divorce leads or become a social media superstar.
What we love
Harwood is a licensed agent coaching agents week-in and week-out at no less than three Keller-Williams offices in the great Boston metro. We love her humanity, inspiring videos, and her latest enterpise — The Quiet Success Club. Inspired by Susan Cain’s New York Times bestseller Quiet, about the power of introverts, Harwood brings together a community of like-minded real estate agents wanting a more client-centric approach to succeeding as an agent.
Pricing
Join The Quiet Success Club for $45 per month (paid monthly) or get two months free when you pay for an annual subscription (for $450). The club is currently offering founding member pricing for $25 per month or $250, but it’s a limited-time offer available only under April 30, 2024. Or get a lifetime membership to Harwood’s suite of courses, called IntrovertU, for a one-time cost of $997.
Who’s it Best For?
Introverts, of course! While you may not count yourself as one, if you read Susan Cain’s book, you may unearth your more introverted traits — like recharging your battery by being alone. Ok, even if you don’t bask in solitude, Harwood promises a calming community where agents can be themselves, be seen, and where they don’t have to be the loudest voice in her mastermind group, purposefully (and quietly) designed to teach successful lead generation and other strategies.
6. Levi Lascsak
If you’re looking to improve your social media game, Levi Lascsak is the YouTube master. The author of Passive Prospecting specializes in helping real estate professionals embrace the video platform, and he does so in jam-packed, 2-day virtual events. Discover how he earned over $4 million in gross commission income as a new agent.
What we love
Lascsak’s social media marketing skills are top-of-the-line. While he may not be part of the traditional world of real estate coaching, Lascak’s ability to relate to younger audiences is an asset that Millennial and Gen Z agents might appreciate.
Pricing
The live, 2-day events are available at a discount for $47. But as you can expect, he’s got endless information available for free on YouTube.
Who’s it best for?
If you’re a digital native looking to pack a bunch of education into a short period, a Lascsak course is particularly beneficial.
7. Jess Lenouvel
Key Facts
Promising to help agents scale from six to seven figures, The Listings Lab founder Jess Lenouvel is the author of More Money, Less Hustle. A strong example of a coach with a significant understanding of social media, Lenouvel hosts vibrant live events that hype up the audience and prepare them to take their career to the next level.
What we Love
Lenouvel emphasizes the significant power of mindset to achieve one’s goals. She understands how quickly the market shifts and emphasizes staying on top of trends to succeed.
Lenouvel’s live events focus on messaging. For those looking to solidify their brand and develop a clear, concise message, her events might be what you need.
8. Buffini & Company
Key Facts
Another giant of the real estate coaching industry, Buffini & Company is one of the largest coaching and training companies in the United States. They have two major coaching programs: The Leadership Coaching program includes three monthly coaching calls, free admission to a 2-day conference, and curriculums and training led by Brian Buffini. There are also bi-monthly coaching sessions and a monthly web series with a live Q&A.
Buffini & Company also performs a REALstrengths profile — an in-depth personality assessment. In the One2One Coaching program, there are two coaching calls per month, a monthly marketing kit, the REALStrengths profile, and as with the SERHANT. program, Buffini features the Buffini Referral Network, allowing participants to send and receive referrals with other agents.
What We Love
Buffini coaches aren’t independent contractors. Instead, they’re full-time employees who go through intense training. Thus far, they’ve conducted 1.7 million coaching calls and more than one million hours of coaching.
Pricing
The Leadership Coaching program costs $1,499 a month. Private coaching, referred to as One2One Coaching, costs $549 per month. Two tiers of Referral Maker courses are available from $45 to $149 each per month.
Who’s it Best For?
Team spirit is the name of the game for Buffini’s Leadership Coaching program. If you’re a team leader looking to improve your coaching skills and assist your team in leveling up, the Leadership Coaching program might be right for you. If you want a more personalized path as a solo agent, the One2One Coaching program may be a better fit.
9. Vanda Martin
Key Facts
A popular name in the real estate coaching industry, Vanda Martin’s VIP Coaching Program follows three components: coaching, content, and community. Martin doesn’t shy away from mistakes – instead, she emphasizes avoiding indecision that puts you behind the pack.
What we love
Positive vibes are plentiful in Martin’s world, and her energy is tangible. Just check out her Instagram videos.
Pricing
Martin’s pricing isn’t listed.
Who’s it best for?
If you’re looking for a female leader who emphasizes loving your job and building habits that will take you to a greater level of success, Martin’s ability to convey those feelings is clear. Just check out the endless testimonials on her website.
9. Tat Londono
Key Facts
Tatiana Londono is the founder and CEO of Londono Realty Group Inc. The author of Real Estate Unfiltered, she offers a variety of programming that ranges from free templates to intensive coaching sessions. The Millionaire Realtor Membership provides weekly input from Londono, while the intensive Millionaire Real Estate Agent Coaching Program focuses on building 12-month objectives using a custom success action plan. It uses live programming and workshops with Londono herself, as well as an exclusive online community and referral network for members.
What we love
Londono’s keen sense of social media and her posts are a masterclass in how to boost your engagement on platforms like TikTok and Instagram. Don’t miss her takes on Taylor Swift’s real estate portfolio.
Londono’s programs specifically target agents who are looking to scale their business. If you’re struggling with lead generation or want to increase the number of views you’re racking up on social media, Londono is a valuable source within the industry.
10. Steve Shull
Key Facts
Steve Shull’s Performance Coaching focuses on using consistent execution to achieve your goals. With options ranging from 1:1 private coaching to small group coaching for 10 to 20 agents, the groups have 30-minute Zoom calls three times a day, but the number of sessions you choose to attend is up to you. Several self-directed courses are also available on the website, focusing on topics ranging from mindset to time blocking.
What we love
If you’re not positive you want to make the investment, Performance Coaching allows a 14-day free trial of daily accountability calls.
Pricing
Small group coaching costs $6,000 a year, and while 1:1 coaching prices aren’t listed online, you should prepare for a hefty price tag.
Who’s it Best For?
If you have a specific area you’re looking to improve upon, Performance Coaching offers coaches with unique areas of expertise, ranging from CRMs to business strategy. Tailoring your program to your greatest areas of weakness can help you become a more well-rounded agent.
11. Aaron Novello
Key Facts
Aaron Novello of Elite Real Estate Coaching has several programs tailor-made for agents looking to hone their craft. A Masterclass in Systems works to teach agents how to scale their real estate business, organize their team, and use programming like Follow Up Boss to manage their business.
The Role Play Mastermind is for agents looking to prepare themselves for tough discussions by working with a role-play partner for 15 to 30 minutes, five days a week. The group coaching option includes a variety of scripts Novello used to close on homes, as well as mindset guides, skill sheets, and expert guidance from experts in the field.
What we love
Novello’s exclusive accountability group allows active members and former coaching clients to share everything from guidance to motivation. If you’re looking to save money, Novello also has a free podcast available on YouTube.
If you struggle with having difficult conversations and are looking for solid templates to guide you, Novello’s Role Play Mastermind is a solid investment. The group coaching option emphasizes taking the educational portion and putting it into practice in the real world rather than just watching videos.
12. Krista Mashore Coaching
Key Facts
Filled with energy and known for popping up in the press, Krista Mashore is the mind behind Unstoppable Agent, her 3-day mastery class. It includes over 15 hours of coaching, group workshops, breakout sessions, and skill-building workshops to provide you with the skills to implement digital marketing successfully into your real estate business.
What we love
A positive attitude counts for a lot, and Mashore’s personality is a key component of the success of her course.
Pricing
Mashore’s accessibility is another one of her program’s best assets. Her 3-day class is currently priced at $47, but pricing occasionally varies.
Who’s it best for?
If you crave energy and enthusiasm, Krista Mashore has the goods. She’s also an expert on working in today’s low-inventory market, which is ideal for someone struggling with the current housing shortage. But she’s also got a good sense of humor, which shines through in her social media presence.
The full picture: The best real estate coaches for 2024
Hiring a top real estate coach goes far beyond just expanding your skills. While growing and educating yourself as you navigate your career is essential, hiring a coach is all about seeking to achieve more. Whether you’re looking to boost lead generation, build a solid personal brand, or make more commission income, having the input of a seasoned expert is a priceless step in the right direction. As you can see through the endless reviews and testimonials on coaches’ websites, agents who want to scale their business and take their profits to a higher level often seek the outside guidance of a coach. While the cost of hiring someone may be significant, the return on investment is equally as monumental.
Real estate coaching programs vary in price significantly. Most cost over $500 per month, with others charging several thousand dollars per month. “Oftentimes, it is the case that you get what you pay for,” said Kyle Scott, President of SERHANT. Ventures.
However, prices can also vary depending on the specific niche of real estate coaching you’re focusing on. The more specificity you’re seeking, the higher the financial investment. Of course, self-led courses are likely to cost much less.
Does your career feel stalled right now? Are you ready to take your career to the next level, but you’re not sure where to start? In a down market, you can channel your time and energy into actively improving your business skills so that you’ll be sufficiently prepared for when the market changes.
“When things pick up again, you’re ready to capture the climbing market,” says Scott. “If that’s the case, then the best time to embrace coaching is now. At the same time, a thriving market presents agents with new challenges, ranging from having to turn away business or being unable to service your existing business in a way you’re proud of,” Scott noted. “In that type of market, a real estate coach can help you determine what kind of junior agent or assistant would serve you best. How do I figure out how to manage my business in a way that I can keep up with the volume?”
Part 1: Current State of the Housing Market; Overview for mid-March 2024
Today, in the Calculated Risk Real Estate Newsletter: Part 1: Current State of the Housing Market; Overview for mid-March 2024
A brief excerpt: This 2-part overview for mid-March provides a snapshot of the current housing market.
This 2-part overview for mid-March provides a snapshot of the current housing market.
I always like to start with inventory, since inventory usually tells the tale!
...
Here is a graph of new listing from Realtor.com’s February 2024 Monthly Housing Market Trends Report showing new listings were up 11.3% year-over-year in February. This is still well below pre-pandemic levels. From Realtor.com:
However, providing a boost to overall inventory, sellers turned out in higher numbers this February as newly listed homes were 11.3% above last year’s levels. This marked the fourth month of increasing listing activity after a 17-month streak of decline.
Note the seasonality for new listings. December and January are seasonally the weakest months of the year for new listings, followed by February and November. New listings will be up year-over-year in 2024, but we will have to wait for the March and April data to see how close new listings are to normal levels.
There are always people that need to sell due to the so-called 3 D’s: Death, Divorce, and Disease. Also, in certain times, some homeowners will need to sell due to unemployment or excessive debt (neither is much of an issue right now).
And there are homeowners who want to sell for a number of reasons: upsizing (more babies), downsizing, moving for a new job, or moving to a nicer home or location (move-up buyers). It is some of the “want to sell” group that has been locked in with the golden handcuffs over the last couple of years, since it is financially difficult to move when your current mortgage rate is around 3%, and your new mortgage rate will be in the 6 1/2% to 7% range.
But time is a factor for this “want to sell” group, and eventually some of them will take the plunge. That is probably why we are seeing more new listings now.
Pharma industry reputation remains steady at a ‘new normal’ after Covid, Harris Poll finds
The pharma industry is hanging on to reputation gains notched during the Covid-19 pandemic. Positive perception of the pharma industry is steady at 45%…
The pharma industry is hanging on to reputation gains notched during the Covid-19 pandemic. Positive perception of the pharma industry is steady at 45% of US respondents in 2023, according to the latest Harris Poll data. That’s exactly the same as the previous year.
Pharma’s highest point was in February 2021 — as Covid vaccines began to roll out — with a 62% positive US perception, and helping the industry land at an average 55% positive sentiment at the end of the year in Harris’ 2021 annual assessment of industries. The pharma industry’s reputation hit its most recent low at 32% in 2019, but it had hovered around 30% for more than a decade prior.
Rob Jekielek
“Pharma has sustained a lot of the gains, now basically one and half times higher than pre-Covid,” said Harris Poll managing director Rob Jekielek. “There is a question mark around how sustained it will be, but right now it feels like a new normal.”
The Harris survey spans 11 global markets and covers 13 industries. Pharma perception is even better abroad, with an average 58% of respondents notching favorable sentiments in 2023, just a slight slip from 60% in each of the two previous years.
Pharma’s solid global reputation puts it in the middle of the pack among international industries, ranking higher than government at 37% positive, insurance at 48%, financial services at 51% and health insurance at 52%. Pharma ranks just behind automotive (62%), manufacturing (63%) and consumer products (63%), although it lags behind leading industries like tech at 75% positive in the first spot, followed by grocery at 67%.
The bright spotlight on the pharma industry during Covid vaccine and drug development boosted its reputation, but Jekielek said there’s maybe an argument to be made that pharma is continuing to develop innovative drugs outside that spotlight.
“When you look at pharma reputation during Covid, you have clear sense of a very dynamic industry working very quickly and getting therapies and products to market. If you’re looking at things happening now, you could argue that pharma still probably doesn’t get enough credit for its advances, for example, in oncology treatments,” he said.
We use cookies on our website to give you the most relevant experience by remembering your preferences and repeat visits. By clicking “Accept”, you consent to the use of ALL the cookies.
This website uses cookies to improve your experience while you navigate through the website. Out of these, the cookies that are categorized as necessary are stored on your browser as they are essential for the working of basic functionalities of the website. We also use third-party cookies that help us analyze and understand how you use this website. These cookies will be stored in your browser only with your consent. You also have the option to opt-out of these cookies. But opting out of some of these cookies may affect your browsing experience.
Necessary cookies are absolutely essential for the website to function properly. These cookies ensure basic functionalities and security features of the website, anonymously.
Cookie
Duration
Description
cookielawinfo-checbox-analytics
11 months
This cookie is set by GDPR Cookie Consent plugin. The cookie is used to store the user consent for the cookies in the category "Analytics".
cookielawinfo-checbox-functional
11 months
The cookie is set by GDPR cookie consent to record the user consent for the cookies in the category "Functional".
cookielawinfo-checbox-others
11 months
This cookie is set by GDPR Cookie Consent plugin. The cookie is used to store the user consent for the cookies in the category "Other.
cookielawinfo-checkbox-necessary
11 months
This cookie is set by GDPR Cookie Consent plugin. The cookies is used to store the user consent for the cookies in the category "Necessary".
cookielawinfo-checkbox-performance
11 months
This cookie is set by GDPR Cookie Consent plugin. The cookie is used to store the user consent for the cookies in the category "Performance".
viewed_cookie_policy
11 months
The cookie is set by the GDPR Cookie Consent plugin and is used to store whether or not user has consented to the use of cookies. It does not store any personal data.
Functional cookies help to perform certain functionalities like sharing the content of the website on social media platforms, collect feedbacks, and other third-party features.
Performance cookies are used to understand and analyze the key performance indexes of the website which helps in delivering a better user experience for the visitors.
Analytical cookies are used to understand how visitors interact with the website. These cookies help provide information on metrics the number of visitors, bounce rate, traffic source, etc.
Advertisement cookies are used to provide visitors with relevant ads and marketing campaigns. These cookies track visitors across websites and collect information to provide customized ads.


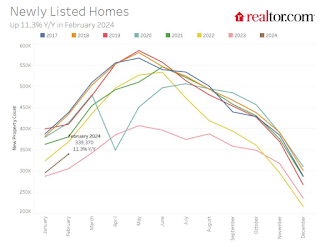


 Uncategorized3 weeks ago
 International6 days ago
 Uncategorized4 weeks ago
 Uncategorized3 weeks ago
 Uncategorized4 weeks ago
 International6 days ago
 Uncategorized4 weeks ago
 Uncategorized3 weeks ago