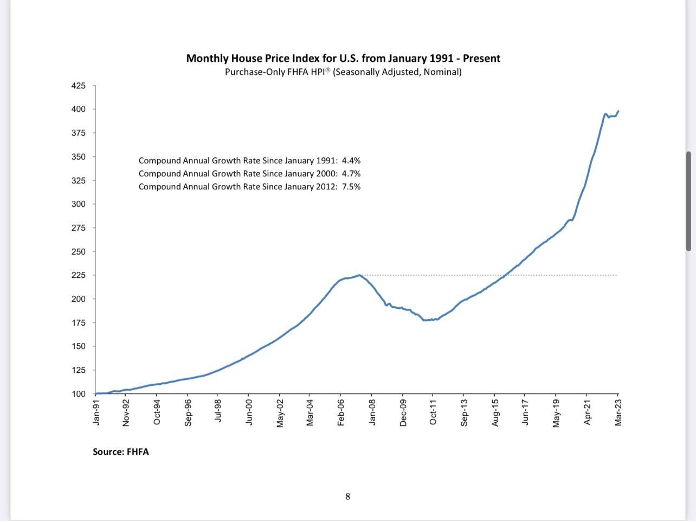
On Tuesday the FHFA House Price Index hit an all-time high. In this article I’ll explain why this is happening and why we still have a savagely unhealthy housing market. The quick takeaway here is that total active listings in the U.S. are still near all-time lows and the demand has stabilized.
If home sales were crashing at the same pace they were last year, we would all be having a different discussion. This is why I have stressed that Nov. 9, 2022, was an inflection point in housing. It’s not because demand has rebounded in a big way, it’s just that home sales stopped collapsing as they did in 2022.
Forward-looking housing data flipped in November, so HousingWire created the weekly Housing Market Tracker to provide real-time forward-looking housing data. I also recently joined Mike Simonsen’s Top of Mind podcast to talk about what’s happened in housing over the past year. Forward-looking housing data might not be sexy, but it works.
From FHFA: U.S. house prices rose 4.3 percent between the first quarters of 2022 and 2023, according to the Federal Housing Finance Agency House Price Index (FHFA HPI). House prices were up 0.5 percent compared to the fourth quarter of 2022. FHFA’s seasonally adjusted monthly index for March was up 0.6 percent from February.
How and why did the index reach this high, and what should we expect in the future?
Inventory is still near record lows
The easiest economic discussion right now is the housing inventory story in the U.S. and that it’s historically low. However, it’s also the most-lied-about topic in recent economic history. People claim inventory isn’t low because “shadow inventory” is on the verge of adding millions of homes into the marketplace any second now. Another myth is that we’ll have a silver tsunami where every Baby Boomer lists their home in one month, flooding the marketplace with inventory.
The NAR total active listings data is between 2 million and 2.5 million in a normal market between 1982-2023. Post COVID-19, we broke to all-time lows and it’s hard to get it back to those levels: we’re currently at 1,040,000 active listings. This is a fact that some people have a hard time believing because they believe the shadow inventory or vacant home thesis.
These are often middle-age male stock traders or anyone from the anti-central bank movement who has been part of a borderline crazy bearish American economic crash squad that only can be matched by the Russian troll movement spreading disinformation about the state of the U.S. economy. Economic cycles come and go, but the 24/7 doom porn people are a one-trick pony that will fall into the grave with all American bears who have failed since 1790.
NAR total inventory since 1982:
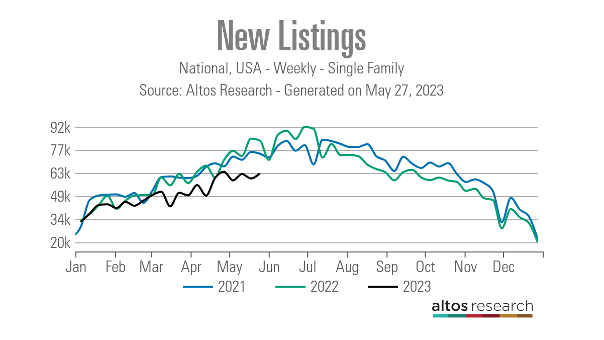
I prefer the Altos Research weekly single-family data to the NAR data because it gives us a fresh look at not only active listing data but new listing data. This way, nobody can be surprised when old stale data comes to the marketplace. This is also why we created the weekly Housing Market Tracker article. We want to connect the dots with supply and demand.
The Altos Research new listing data is essential in tracking the supply aspect of housing, which is why I include it as part of the Tracker. Even in 2022, when we had the most significant home sales collapse ever recorded, the new listing data never exploded higher; in fact, it was trending at all-time lows in 2021 and 2022, and now is at a new all-time low in 2023.
The data in the charts above should clear up any shadow inventory and vacant home nonsense we have heard for over 11 years. Let’s talk about the second significant factor: demand!
Last year was a whirlwind for housing economics. The first three months of 2022 were so bad that I deemed it the unhealthiest housing market post-2010. I coined the term savagely unhealthy because we had too many people chasing too few homes. More than 70% of the marketplace saw multiple bids on properties.
In February of 2021, I talked about how we needed higher rates to cool down the housing market because this wasn’t the housing bubble of 2005. However, by February 2022, it was too late; so much home-price growth in such a short time meant that demand would collapse when mortgage rates did rise.
Mortgage rates going from 3% to 5% had been the norm for the markets; mortgage rates going from 3% to 7.37% was another story altogether. As a result, home sales collapsed in 2022 in the most prominent fashion ever recorded in U.S. history.
So what has changed? Well, starting Nov. 9, 2022, mortgage rates fell and mortgage demand got better. We didn’t see a recovery in demand, it just stabilized.
Since Nov. 9, purchase application data has had 17 positive prints versus nine negative prints after making some holiday adjustments. Year to date, we have had 10 positive prints and nine negatives, and tomorrow purchase applications should be negative, which shows the stabilization in demand so far in 2023.
It is simple supply and demand economics. Last year, home sales crashed because mortgage rates exploded higher after the most significant short-term home-price gains ever in history. However, after Nov. 9, that reality changed from crashing home sales to stabilizing.
So the moral of the story is that the market dynamics were very historical last year; active inventory and monthly supply were low, but home sales were crashing, and the inventory that was on the market, especially in the seconnd half of 2022, required price cuts to sell.
In my 2023 forecast for prices, I stated that mortgage rates needed to stay higher, above 5.875%, for prices to have a mild decline, in contrast to the massive price gains we have seen in 2020 through 2022. I chose 5.875% because my affordability index model was shot, but I also saw that the housing market changed when rates moved from 7.37% to 5.99%.
Imagine what the housing data would look like if rates were in the low 5% for 2023. This is why tracking weekly housing data is critical. We don’t have a housing demand recovery as we saw with the COVID-19 recovery, we just have a stabilization in demand, and total active listings are still near all-time lows.
As you can see in the FHFA home price index below, the growth rate of prices cooled down a lot with higher mortgage rates, but those didn’t crash prices like in 2007 and 2008, a period in time with much higher active supply.
Also, to go along with the FHFA home price index, not only was housing inventory over 4 million in the NAR data in 2007, but we also had massive growth in forced sellers. As we can see in the chart below, we had massive credit stress in the system.
So, as we get ready for the second half of 2023, we will track the weekly housing data. We will focus on the actual data that matter, positive or negative. The most significant change this year is that home sales are not collapsing in the same fashion they were last year.
BUFFALO, NY- March 11, 2024 – Impact Journals publishes scholarly journals in the biomedical sciences with a focus on all areas of cancer and aging research. Aging is one of the most prominent journals published by Impact Journals.
Credit: Impact Journals
BUFFALO, NY- March 11, 2024 – Impact Journals publishes scholarly journals in the biomedical sciences with a focus on all areas of cancer and aging research. Aging is one of the most prominent journals published by Impact Journals.
Impact Journals will be participating as an exhibitor at the American Association for Cancer Research (AACR) Annual Meeting 2024 from April 5-10 at the San Diego Convention Center in San Diego, California. This year, the AACR meeting theme is “Inspiring Science • Fueling Progress • Revolutionizing Care.”
Visit booth #4159 at the AACR Annual Meeting 2024 to connect with members of the Agingteam.
About Aging-US:
Agingpublishes research papers in all fields of aging research including but not limited, aging from yeast to mammals, cellular senescence, age-related diseases such as cancer and Alzheimer’s diseases and their prevention and treatment, anti-aging strategies and drug development and especially the role of signal transduction pathways such as mTOR in aging and potential approaches to modulate these signaling pathways to extend lifespan. The journal aims to promote treatment of age-related diseases by slowing down aging, validation of anti-aging drugs by treating age-related diseases, prevention of cancer by inhibiting aging. Cancer and COVID-19 are age-related diseases.
Agingis indexed and archived byPubMed/Medline (abbreviated as “Aging (Albany NY)”), PubMed Central, Web of Science: Science Citation Index Expanded (abbreviated as “Aging‐US” and listed in the Cell Biology and Geriatrics & Gerontology categories), Scopus (abbreviated as “Aging” and listed in the Cell Biology and Aging categories), Biological Abstracts, BIOSIS Previews, EMBASE, META (Chan Zuckerberg Initiative) (2018-2022), and Dimensions (Digital Science).
Please visit our website at www.Aging-US.com and connect with us:
NY Fed Finds Medium, Long-Term Inflation Expectations Jump Amid Surge In Stock Market Optimism
One month after the inflation outlook tracked by the NY Fed Consumer Survey extended their late 2023 slide, with 3Y inflation expectations in January sliding to a record low 2.4% (from 2.6% in December), even as 1 and 5Y inflation forecasts remained flat, moments ago the NY Fed reported that in February there was a sharp rebound in longer-term inflation expectations, rising to 2.7% from 2.4% at the three-year ahead horizon, and jumping to 2.9% from 2.5% at the five-year ahead horizon, while the 1Y inflation outlook was flat for the 3rd month in a row, stuck at 3.0%.
The increases in both the three-year ahead and five-year ahead measures were most pronounced for respondents with at most high school degrees (in other words, the "really smart folks" are expecting deflation soon). The survey’s measure of disagreement across respondents (the difference between the 75th and 25th percentile of inflation expectations) decreased at all horizons, while the median inflation uncertainty—or the uncertainty expressed regarding future inflation outcomes—declined at the one- and three-year ahead horizons and remained unchanged at the five-year ahead horizon.
Going down the survey, we find that the median year-ahead expected price changes increased by 0.1 percentage point to 4.3% for gas; decreased by 1.8 percentage points to 6.8% for the cost of medical care (its lowest reading since September 2020); decreased by 0.1 percentage point to 5.8% for the cost of a college education; and surprisingly decreased by 0.3 percentage point for rent to 6.1% (its lowest reading since December 2020), and remained flat for food at 4.9%.
We find the rent expectations surprising because it is happening just asking rents are rising across the country.
At the same time as consumers erroneously saw sharply lower rents, median home price growth expectations remained unchanged for the fifth consecutive month at 3.0%.
Turning to the labor market, the survey found that the average perceived likelihood of voluntary and involuntary job separations increased, while the perceived likelihood of finding a job (in the event of a job loss) declined. "The mean probability of leaving one’s job voluntarily in the next 12 months also increased, by 1.8 percentage points to 19.5%."
Mean unemployment expectations - or the mean probability that the U.S. unemployment rate will be higher one year from now - decreased by 1.1 percentage points to 36.1%, the lowest reading since February 2022. Additionally, the median one-year-ahead expected earnings growth was unchanged at 2.8%, remaining slightly below its 12-month trailing average of 2.9%.
Turning to household finance, we find the following:
The median expected growth in household income remained unchanged at 3.1%. The series has been moving within a narrow range of 2.9% to 3.3% since January 2023, and remains above the February 2020 pre-pandemic level of 2.7%.
Median household spending growth expectations increased by 0.2 percentage point to 5.2%. The increase was driven by respondents with a high school degree or less.
Median year-ahead expected growth in government debt increased to 9.3% from 8.9%.
The mean perceived probability that the average interest rate on saving accounts will be higher in 12 months increased by 0.6 percentage point to 26.1%, remaining below its 12-month trailing average of 30%.
Perceptions about households’ current financial situations deteriorated somewhat with fewer respondents reporting being better off than a year ago. Year-ahead expectations also deteriorated marginally with a smaller share of respondents expecting to be better off and a slightly larger share of respondents expecting to be worse off a year from now.
The mean perceived probability that U.S. stock prices will be higher 12 months from now increased by 1.4 percentage point to 38.9%.
At the same time, perceptions and expectations about credit access turned less optimistic: "Perceptions of credit access compared to a year ago deteriorated with a larger share of respondents reporting tighter conditions and a smaller share reporting looser conditions compared to a year ago."
Also, a smaller percentage of consumers, 11.45% vs 12.14% in prior month, expect to not be able to make minimum debt payment over the next three months
Last, and perhaps most humorous, is the now traditional cognitive dissonance one observes with these polls, because at a time when long-term inflation expectations jumped, which clearly suggests that financial conditions will need to be tightened, the number of respondents expecting higher stock prices one year from today jumped to the highest since November 2021... which incidentally is just when the market topped out during the last cycle before suffering a painful bear market.
Homes listed for sale in early June sell for $7,700 more
New Zillow research suggests the spring home shopping season may see a second wave this summer if mortgage rates fall
The post Homes listed for sale in…
A Zillow analysis of 2023 home sales finds homes listed in the first two weeks of June sold for 2.3% more.
The best time to list a home for sale is a month later than it was in 2019, likely driven by mortgage rates.
The best time to list can be as early as the second half of February in San Francisco, and as late as the first half of July in New York and Philadelphia.
Spring home sellers looking to maximize their sale price may want to wait it out and list their home for sale in the first half of June. A new Zillow® analysis of 2023 sales found that homes listed in the first two weeks of June sold for 2.3% more, a $7,700 boost on a typical U.S. home.
The best time to list consistently had been early May in the years leading up to the pandemic. The shift to June suggests mortgage rates are strongly influencing demand on top of the usual seasonality that brings buyers to the market in the spring. This home-shopping season is poised to follow a similar pattern as that in 2023, with the potential for a second wave if the Federal Reserve lowers interest rates midyear or later.
The 2.3% sale price premium registered last June followed the first spring in more than 15 years with mortgage rates over 6% on a 30-year fixed-rate loan. The high rates put home buyers on the back foot, and as rates continued upward through May, they were still reassessing and less likely to bid boldly. In June, however, rates pulled back a little from 6.79% to 6.67%, which likely presented an opportunity for determined buyers heading into summer. More buyers understood their market position and could afford to transact, boosting competition and sale prices.
The old logic was that sellers could earn a premium by listing in late spring, when search activity hit its peak. Now, with persistently low inventory, mortgage rate fluctuations make their own seasonality. First-time home buyers who are on the edge of qualifying for a home loan may dip in and out of the market, depending on what’s happening with rates. It is almost certain the Federal Reserve will push back any interest-rate cuts to mid-2024 at the earliest. If mortgage rates follow, that could bring another surge of buyers later this year.
Mortgage rates have been impacting affordability and sale prices since they began rising rapidly two years ago. In 2022, sellers nationwide saw the highest sale premium when they listed their home in late March, right before rates barreled past 5% and continued climbing.
Zillow’s research finds the best time to list can vary widely by metropolitan area. In 2023, it was as early as the second half of February in San Francisco, and as late as the first half of July in New York. Thirty of the top 35 largest metro areas saw for-sale listings command the highest sale prices between May and early July last year.
Zillow also found a wide range in the sale price premiums associated with homes listed during those peak periods. At the hottest time of the year in San Jose, homes sold for 5.5% more, a $88,000 boost on a typical home. Meanwhile, homes in San Antonio sold for 1.9% more during that same time period.
We use cookies on our website to give you the most relevant experience by remembering your preferences and repeat visits. By clicking “Accept”, you consent to the use of ALL the cookies.
This website uses cookies to improve your experience while you navigate through the website. Out of these, the cookies that are categorized as necessary are stored on your browser as they are essential for the working of basic functionalities of the website. We also use third-party cookies that help us analyze and understand how you use this website. These cookies will be stored in your browser only with your consent. You also have the option to opt-out of these cookies. But opting out of some of these cookies may affect your browsing experience.
Necessary cookies are absolutely essential for the website to function properly. These cookies ensure basic functionalities and security features of the website, anonymously.
Cookie
Duration
Description
cookielawinfo-checbox-analytics
11 months
This cookie is set by GDPR Cookie Consent plugin. The cookie is used to store the user consent for the cookies in the category "Analytics".
cookielawinfo-checbox-functional
11 months
The cookie is set by GDPR cookie consent to record the user consent for the cookies in the category "Functional".
cookielawinfo-checbox-others
11 months
This cookie is set by GDPR Cookie Consent plugin. The cookie is used to store the user consent for the cookies in the category "Other.
cookielawinfo-checkbox-necessary
11 months
This cookie is set by GDPR Cookie Consent plugin. The cookies is used to store the user consent for the cookies in the category "Necessary".
cookielawinfo-checkbox-performance
11 months
This cookie is set by GDPR Cookie Consent plugin. The cookie is used to store the user consent for the cookies in the category "Performance".
viewed_cookie_policy
11 months
The cookie is set by the GDPR Cookie Consent plugin and is used to store whether or not user has consented to the use of cookies. It does not store any personal data.
Functional cookies help to perform certain functionalities like sharing the content of the website on social media platforms, collect feedbacks, and other third-party features.
Performance cookies are used to understand and analyze the key performance indexes of the website which helps in delivering a better user experience for the visitors.
Analytical cookies are used to understand how visitors interact with the website. These cookies help provide information on metrics the number of visitors, bounce rate, traffic source, etc.
Advertisement cookies are used to provide visitors with relevant ads and marketing campaigns. These cookies track visitors across websites and collect information to provide customized ads.


