Uncategorized
Event management as a service market to grow by 5.87% Y-O-Y in 2023; Rising number of events and meetings will Drive Growth – Technavio
Event management as a service market to grow by 5.87% Y-O-Y in 2023; Rising number of events and meetings will Drive Growth – Technavio
PR Newswire
NEW YORK, Jan. 25, 2023
NEW YORK, Jan. 25, 2023 /PRNewswire/ — Event management as a service market…
Share this:


Event management as a service market to grow by 5.87% Y-O-Y in 2023; Rising number of events and meetings will Drive Growth - Technavio
PR Newswire
NEW YORK, Jan. 25, 2023
NEW YORK, Jan. 25, 2023 /PRNewswire/ -- Event management as a service market insights -
- Vendors: 15+, Including Accelevents Inc, Active Network LLC, Arlo Software Ltd., Aventri Inc., Bitrix Inc., Bizzabo, Certain Inc., Cvent Inc., Event Temple Labs Inc, Eventbrite Inc., Fortive Corp., Glue Up, Hopin, New Work SE, RainFocus LLC, Ungerboeck, WebMobi, Whova Inc., XING Events GmbH, and Zoho Corp. Pvt. Ltd. among others
- Coverage: Parent market analysis; key drivers, major trends, and challenges; customer and vendor landscape; vendor product insights and recent developments; key vendors; and market positioning of vendors
- Segments: End-user (Corporate, PO and NGO, and Individuals), Type (Pre-event services, Onsite services, and Post-event services), and Geography (North America, Europe, APAC, Middle East and Africa, and South America)
To understand more about the event management as a service market, request a sample report
In 2017, the event management as a service market was valued at USD 744.85 million. From a regional perspective, North America held the largest market share, valued at USD 463 million. The event management as a service market size is estimated to grow by USD 391.33 million from 2022 to 2027 at a CAGR of 7.92% according to Technavio.
Why Buy?
- Add credibility to strategy
- Analyzes competitor's offerings
- Get a holistic view of the market
Grow your profit margin with Technavio - Buy the Report
Event management as a service market - Customer Landscape
To help companies evaluate and develop growth strategies, the report outlines –
- Key purchase criteria
- Adoption rates
- Adoption lifecycle
- Drivers of price sensitivity
- For highlights on customer landscape analysis, download a sample!
The growing competition in the market is compelling vendors to adopt various growth strategies such as promotional activities and spending on advertisements to improve the visibility of their services. Technavio report analyzes the market's competitive landscape and offers information on several market vendors including –
- Active Network LLC - The company offers event management services that specialize in operations, development and workload management, and offering tailored engagements to customers.
- Arlo Software Ltd. - The company offers event management services that include a task checklist that is automatically created for every future course scheduled a template, and custom registration forms for events with session registrations and optional extras.
- Aventri Inc. - The company offers event management services that help drive virtual and in-person event attendance by promoting events with multi-channel marketing campaigns and enhancing brand visibility.
- Bitrix Inc. - The company offers event event planning software that is loaded with a database linked contact center, website builder, task, and project management tools.
Major Drivers –
- Increasing demand for online registration and payment
- Need for reduced total cost of ownership
- Rising number of events and meetings
KEY challenges –
- Threat from open-source event management software
- Data security issues
- Ambiguity over return on investment
The event management as a service market report provides critical information and factual data, with a qualitative and quantitative study of the market based on market drivers and limitations as well as future prospects.
What are the key data covered in this event management as a service market report?
- CAGR of the market during the forecast period
- Detailed information on factors that will drive the growth of the event management as a service market between 2023 and 2027
- Precise estimation of the size of the event management as a service market size and its contribution to the market in focus on the parent market
- Accurate predictions about upcoming trends and changes in consumer behavior
- Growth of the event management as a service market industry across North America, Europe, APAC, Middle East and Africa, and South America
- A thorough analysis of the market's competitive landscape and detailed information about vendors
- Comprehensive analysis of factors that will challenge the growth of event management as a service market vendors
Gain instant access to 17,000+ market research reports.
Technavio's SUBSCRIPTION platform
Related Reports:
- The human capital management (HCM) solutions market is estimated to grow at a CAGR of 8.45% between 2022 and 2027. The size of the market is forecast to increase by USD 11,195.8 million. The increasing demand for unified solutions for all HR functions is notably driving market growth, although factors such as increasing workforce diversity may impede market growth.
- The privileged access management solutions market is estimated to decline at a CAGR of 22.24% between 2022 and 2027. The size of the market is forecast to increase by USD 4521.66 million. The need for multi-factor authentication (MFA) for privileged accounts is notably driving the market growth, although factors such as low adoption in developing regions may impede the market growth.
Event Management As A Service Market Scope | |
Report Coverage | Details |
Page number | 158 |
Base year | 2022 |
Historic period | 2017-2021 |
Forecast period | 2023-2027 |
Growth momentum & CAGR | Accelerate at a CAGR of 7.92% |
Market growth 2023-2027 | USD 391.33 million |
Market structure | Fragmented |
YoY growth 2022-2023 (%) | 5.87 |
Regional analysis | North America, Europe, APAC, Middle East and Africa, and South America |
Performing market contribution | North America at 53% |
Key countries | US, Canada, China, UK, and Germany |
Competitive landscape | Leading Vendors, Market Positioning of Vendors, Competitive Strategies, and Industry Risks |
Key companies profiled | Accelevents Inc, Active Network LLC, Arlo Software Ltd., Aventri Inc., Bitrix Inc., Bizzabo, Certain Inc., Cvent Inc., Event Temple Labs Inc, Eventbrite Inc., Fortive Corp., Glue Up, Hopin, New Work SE, RainFocus LLC, Ungerboeck, WebMobi, Whova Inc., XING Events GmbH, and Zoho Corp. Pvt. Ltd. |
Market dynamics | Parent market analysis, market growth inducers and obstacles, fast-growing and slow-growing segment analysis, COVID-19 impact and recovery analysis and future consumer dynamics, and market condition analysis for the forecast period. |
Customization purview | If our report has not included the data that you are looking for, you can reach out to our analysts and get segments customized. |
1 Executive Summary
- 1.1 Market overview
- Exhibit 01: Executive Summary – Chart on Market Overview
- Exhibit 02: Executive Summary – Data Table on Market Overview
- Exhibit 03: Executive Summary – Chart on Global Market Characteristics
- Exhibit 04: Executive Summary – Chart on Market by Geography
- Exhibit 05: Executive Summary – Chart on Market Segmentation by End-user
- Exhibit 06: Executive Summary – Chart on Market Segmentation by Type
- Exhibit 07: Executive Summary – Chart on Incremental Growth
- Exhibit 08: Executive Summary – Data Table on Incremental Growth
- Exhibit 09: Executive Summary – Chart on Vendor Market Positioning
2 Market Landscape
- 2.1 Market ecosystem
- Exhibit 10: Parent market
- Exhibit 11: Market Characteristics
3 Market Sizing
- 3.1 Market definition
- Exhibit 12: Offerings of vendors included in the market definition
- 3.2 Market segment analysis
- Exhibit 13: Market segments
- 3.3 Market size 2022
- 3.4 Market outlook: Forecast for 2022-2027
- Exhibit 14: Chart on Global - Market size and forecast 2022-2027 ($ million)
- Exhibit 15: Data Table on Global - Market size and forecast 2022-2027 ($ million)
- Exhibit 16: Chart on Global Market: Year-over-year growth 2022-2027 (%)
- Exhibit 17: Data Table on Global Market: Year-over-year growth 2022-2027 (%)
4 Historic Market Size
- 4.1 Global event management as a service market 2017 - 2021
- Exhibit 18: Historic Market Size – Data Table on Global event management as a service market 2017 - 2021 ($ million)
- 4.2 End-User Segment Analysis 2017 - 2021
- Exhibit 19: Historic Market Size – End-User Segment 2017 - 2021 ($ million)
- 4.3 Type Segment Analysis 2017 - 2021
- Exhibit 20: Historic Market Size – Type Segment 2017 - 2021 ($ million)
- 4.4 Geography Segment Analysis 2017 - 2021
- Exhibit 21: Historic Market Size – Geography Segment 2017 - 2021 ($ million)
- 4.5 Country Segment Analysis 2017 - 2021
- Exhibit 22: Historic Market Size – Country Segment 2017 - 2021 ($ million)
5 Five Forces Analysis
- 5.1 Five forces summary
- Exhibit 23: Five forces analysis - Comparison between 2022 and 2027
- 5.2 Bargaining power of buyers
- Exhibit 24: Chart on Bargaining power of buyers – Impact of key factors 2022 and 2027
- 5.3 Bargaining power of suppliers
- Exhibit 25: Bargaining power of suppliers – Impact of key factors in 2022 and 2027
- 5.4 Threat of new entrants
- Exhibit 26: Threat of new entrants – Impact of key factors in 2022 and 2027
- 5.5 Threat of substitutes
- Exhibit 27: Threat of substitutes – Impact of key factors in 2022 and 2027
- 5.6 Threat of rivalry
- Exhibit 28: Threat of rivalry – Impact of key factors in 2022 and 2027
- 5.7 Market condition
- Exhibit 29: Chart on Market condition - Five forces 2022 and 2027
6 Market Segmentation by End-user
- 6.1 Market segments
- Exhibit 30: Chart on End-user - Market share 2022-2027 (%)
- Exhibit 31: Data Table on End-user - Market share 2022-2027 (%)
- 6.2 Comparison by End-user
- Exhibit 32: Chart on Comparison by End-user
- Exhibit 33: Data Table on Comparison by End-user
- 6.3 Corporate - Market size and forecast 2022-2027
- Exhibit 34: Chart on Corporate - Market size and forecast 2022-2027 ($ million)
- Exhibit 35: Data Table on Corporate - Market size and forecast 2022-2027 ($ million)
- Exhibit 36: Chart on Corporate - Year-over-year growth 2022-2027 (%)
- Exhibit 37: Data Table on Corporate - Year-over-year growth 2022-2027 (%)
- 6.4 PO and NGO - Market size and forecast 2022-2027
- Exhibit 38: Chart on PO and NGO - Market size and forecast 2022-2027 ($ million)
- Exhibit 39: Data Table on PO and NGO - Market size and forecast 2022-2027 ($ million)
- Exhibit 40: Chart on PO and NGO - Year-over-year growth 2022-2027 (%)
- Exhibit 41: Data Table on PO and NGO - Year-over-year growth 2022-2027 (%)
- 6.5 Individuals - Market size and forecast 2022-2027
- Exhibit 42: Chart on Individuals - Market size and forecast 2022-2027 ($ million)
- Exhibit 43: Data Table on Individuals - Market size and forecast 2022-2027 ($ million)
- Exhibit 44: Chart on Individuals - Year-over-year growth 2022-2027 (%)
- Exhibit 45: Data Table on Individuals - Year-over-year growth 2022-2027 (%)
- 6.6 Market opportunity by End-user
- Exhibit 46: Market opportunity by End-user ($ million)
7 Market Segmentation by Type
- 7.1 Market segments
- Exhibit 47: Chart on Type - Market share 2022-2027 (%)
- Exhibit 48: Data Table on Type - Market share 2022-2027 (%)
- 7.2 Comparison by Type
- Exhibit 49: Chart on Comparison by Type
- Exhibit 50: Data Table on Comparison by Type
- 7.3 Pre-event services - Market size and forecast 2022-2027
- Exhibit 51: Chart on Pre-event services - Market size and forecast 2022-2027 ($ million)
- Exhibit 52: Data Table on Pre-event services - Market size and forecast 2022-2027 ($ million)
- Exhibit 53: Chart on Pre-event services - Year-over-year growth 2022-2027 (%)
- Exhibit 54: Data Table on Pre-event services - Year-over-year growth 2022-2027 (%)
- 7.4 Onsite services - Market size and forecast 2022-2027
- Exhibit 55: Chart on Onsite services - Market size and forecast 2022-2027 ($ million)
- Exhibit 56: Data Table on Onsite services - Market size and forecast 2022-2027 ($ million)
- Exhibit 57: Chart on Onsite services - Year-over-year growth 2022-2027 (%)
- Exhibit 58: Data Table on Onsite services - Year-over-year growth 2022-2027 (%)
- 7.5 Post-event services - Market size and forecast 2022-2027
- Exhibit 59: Chart on Post-event services - Market size and forecast 2022-2027 ($ million)
- Exhibit 60: Data Table on Post-event services - Market size and forecast 2022-2027 ($ million)
- Exhibit 61: Chart on Post-event services - Year-over-year growth 2022-2027 (%)
- Exhibit 62: Data Table on Post-event services - Year-over-year growth 2022-2027 (%)
- 7.6 Market opportunity by Type
- Exhibit 63: Market opportunity by Type ($ million)
8 Customer Landscape
- 8.1 Customer landscape overview
- Exhibit 64: Analysis of price sensitivity, lifecycle, customer purchase basket, adoption rates, and purchase criteria
9 Geographic Landscape
- 9.1 Geographic segmentation
- Exhibit 65: Chart on Market share by geography 2022-2027 (%)
- Exhibit 66: Data Table on Market share by geography 2022-2027 (%)
- 9.2 Geographic comparison
- Exhibit 67: Chart on Geographic comparison
- Exhibit 68: Data Table on Geographic comparison
- 9.3 North America - Market size and forecast 2022-2027
- Exhibit 69: Chart on North America - Market size and forecast 2022-2027 ($ million)
- Exhibit 70: Data Table on North America - Market size and forecast 2022-2027 ($ million)
- Exhibit 71: Chart on North America - Year-over-year growth 2022-2027 (%)
- Exhibit 72: Data Table on North America - Year-over-year growth 2022-2027 (%)
- 9.4 Europe - Market size and forecast 2022-2027
- Exhibit 73: Chart on Europe - Market size and forecast 2022-2027 ($ million)
- Exhibit 74: Data Table on Europe - Market size and forecast 2022-2027 ($ million)
- Exhibit 75: Chart on Europe - Year-over-year growth 2022-2027 (%)
- Exhibit 76: Data Table on Europe - Year-over-year growth 2022-2027 (%)
- 9.5 APAC - Market size and forecast 2022-2027
- Exhibit 77: Chart on APAC - Market size and forecast 2022-2027 ($ million)
- Exhibit 78: Data Table on APAC - Market size and forecast 2022-2027 ($ million)
- Exhibit 79: Chart on APAC - Year-over-year growth 2022-2027 (%)
- Exhibit 80: Data Table on APAC - Year-over-year growth 2022-2027 (%)
- 9.6 Middle East and Africa - Market size and forecast 2022-2027
- Exhibit 81: Chart on Middle East and Africa - Market size and forecast 2022-2027 ($ million)
- Exhibit 82: Data Table on Middle East and Africa - Market size and forecast 2022-2027 ($ million)
- Exhibit 83: Chart on Middle East and Africa - Year-over-year growth 2022-2027 (%)
- Exhibit 84: Data Table on Middle East and Africa - Year-over-year growth 2022-2027 (%)
- 9.7 South America - Market size and forecast 2022-2027
- Exhibit 85: Chart on South America - Market size and forecast 2022-2027 ($ million)
- Exhibit 86: Data Table on South America - Market size and forecast 2022-2027 ($ million)
- Exhibit 87: Chart on South America - Year-over-year growth 2022-2027 (%)
- Exhibit 88: Data Table on South America - Year-over-year growth 2022-2027 (%)
- 9.8 US - Market size and forecast 2022-2027
- Exhibit 89: Chart on US - Market size and forecast 2022-2027 ($ million)
- Exhibit 90: Data Table on US - Market size and forecast 2022-2027 ($ million)
- Exhibit 91: Chart on US - Year-over-year growth 2022-2027 (%)
- Exhibit 92: Data Table on US - Year-over-year growth 2022-2027 (%)
- 9.9 China - Market size and forecast 2022-2027
- Exhibit 93: Chart on China - Market size and forecast 2022-2027 ($ million)
- Exhibit 94: Data Table on China - Market size and forecast 2022-2027 ($ million)
- Exhibit 95: Chart on China - Year-over-year growth 2022-2027 (%)
- Exhibit 96: Data Table on China - Year-over-year growth 2022-2027 (%)
- 9.10 UK - Market size and forecast 2022-2027
- Exhibit 97: Chart on UK - Market size and forecast 2022-2027 ($ million)
- Exhibit 98: Data Table on UK - Market size and forecast 2022-2027 ($ million)
- Exhibit 99: Chart on UK - Year-over-year growth 2022-2027 (%)
- Exhibit 100: Data Table on UK - Year-over-year growth 2022-2027 (%)
- 9.11 Germany - Market size and forecast 2022-2027
- Exhibit 101: Chart on Germany - Market size and forecast 2022-2027 ($ million)
- Exhibit 102: Data Table on Germany - Market size and forecast 2022-2027 ($ million)
- Exhibit 103: Chart on Germany - Year-over-year growth 2022-2027 (%)
- Exhibit 104: Data Table on Germany - Year-over-year growth 2022-2027 (%)
- 9.12 Canada - Market size and forecast 2022-2027
- Exhibit 105: Chart on Canada - Market size and forecast 2022-2027 ($ million)
- Exhibit 106: Data Table on Canada - Market size and forecast 2022-2027 ($ million)
- Exhibit 107: Chart on Canada - Year-over-year growth 2022-2027 (%)
- Exhibit 108: Data Table on Canada - Year-over-year growth 2022-2027 (%)
- 9.13 Market opportunity by geography
- Exhibit 109: Market opportunity by geography ($ million)
10 Drivers, Challenges, and Trends
- 10.1 Market drivers
- 10.2 Market challenges
- 10.3 Impact of drivers and challenges
- Exhibit 110: Impact of drivers and challenges in 2022 and 2027
- 10.4 Market trends
11 Vendor Landscape
- 11.1 Overview
- 11.2 Vendor landscape
- Exhibit 111: Overview on Criticality of inputs and Factors of differentiation
- 11.3 Landscape disruption
- Exhibit 112: Overview on factors of disruption
- 11.4 Industry risks
- Exhibit 113: Impact of key risks on business
12 Vendor Analysis
- 12.1 Vendors covered
- Exhibit 114: Vendors covered
- 12.2 Market positioning of vendors
- Exhibit 115: Matrix on vendor position and classification
- 12.3 Accelevents Inc
- Exhibit 116: Accelevents Inc - Overview
- Exhibit 117: Accelevents Inc - Product / Service
- Exhibit 118: Accelevents Inc - Key offerings
- 12.4 Active Network LLC
- Exhibit 119: Active Network LLC - Overview
- Exhibit 120: Active Network LLC - Product / Service
- Exhibit 121: Active Network LLC - Key offerings
- 12.5 Arlo Software Ltd.
- Exhibit 122: Arlo Software Ltd. - Overview
- Exhibit 123: Arlo Software Ltd. - Product / Service
- Exhibit 124: Arlo Software Ltd. - Key offerings
- 12.6 Aventri Inc.
- Exhibit 125: Aventri Inc. - Overview
- Exhibit 126: Aventri Inc. - Product / Service
- Exhibit 127: Aventri Inc. - Key offerings
- 12.7 Bitrix Inc.
- Exhibit 128: Bitrix Inc. - Overview
- Exhibit 129: Bitrix Inc. - Product / Service
- Exhibit 130: Bitrix Inc. - Key offerings
- 12.8 Bizzabo
- Exhibit 131: Bizzabo - Overview
- Exhibit 132: Bizzabo - Product / Service
- Exhibit 133: Bizzabo - Key offerings
- 12.9 Certain Inc.
- Exhibit 134: Certain Inc. - Overview
- Exhibit 135: Certain Inc. - Product / Service
- Exhibit 136: Certain Inc. - Key offerings
- 12.10 Cvent Inc.
- Exhibit 137: Cvent Inc. - Overview
- Exhibit 138: Cvent Inc. - Product / Service
- Exhibit 139: Cvent Inc. - Key offerings
- 12.11 Event Temple Labs Inc
- Exhibit 140: Event Temple Labs Inc - Overview
- Exhibit 141: Event Temple Labs Inc - Product / Service
- Exhibit 142: Event Temple Labs Inc - Key offerings
- 12.12 Eventbrite Inc.
- Exhibit 143: Eventbrite Inc. - Overview
- Exhibit 144: Eventbrite Inc. - Product / Service
- Exhibit 145: Eventbrite Inc. - Key offerings
- 12.13 Glue Up
- Exhibit 146: Glue Up - Overview
- Exhibit 147: Glue Up - Product / Service
- Exhibit 148: Glue Up - Key offerings
- 12.14 Hopin
- Exhibit 149: Hopin - Overview
- Exhibit 150: Hopin - Product / Service
- Exhibit 151: Hopin - Key offerings
- 12.15 RainFocus LLC
- Exhibit 152: RainFocus LLC - Overview
- Exhibit 153: RainFocus LLC - Product / Service
- Exhibit 154: RainFocus LLC - Key offerings
- 12.16 Whova Inc.
- Exhibit 155: Whova Inc. - Overview
- Exhibit 156: Whova Inc. - Product / Service
- Exhibit 157: Whova Inc. - Key offerings
- 12.17 Zoho Corp. Pvt. Ltd.
- Exhibit 158: Zoho Corp. Pvt. Ltd. - Overview
- Exhibit 159: Zoho Corp. Pvt. Ltd. - Product / Service
- Exhibit 160: Zoho Corp. Pvt. Ltd. - Key offerings
13 Appendix
- 13.1 Scope of the report
- 13.2 Inclusions and exclusions checklist
- Exhibit 161: Inclusions checklist
- Exhibit 162: Exclusions checklist
- 13.3 Currency conversion rates for US$
- Exhibit 163: Currency conversion rates for US$
- 13.4 Research methodology
- Exhibit 164: Research methodology
- Exhibit 165: Validation techniques employed for market sizing
- Exhibit 166: Information sources
- 13.5 List of abbreviations
- Exhibit 167: List of abbreviations
About Us
Technavio is a leading global technology research and advisory company. Their research and analysis focuses on emerging market trends and provides actionable insights to help businesses identify market opportunities and develop effective strategies to optimize their market positions. With over 500 specialized analysts, Technavio's report library consists of more than 17,000 reports and counting, covering 800 technologies, spanning across 50 countries. Their client base consists of enterprises of all sizes, including more than 100 Fortune 500 companies. This growing client base relies on Technavio's comprehensive coverage, extensive research, and actionable market insights to identify opportunities in existing and potential markets and assess their competitive positions within changing market scenarios.
Contact
Technavio Research
Jesse Maida
Media & Marketing Executive
US: +1 844 364 1100
UK: +44 203 893 3200
Email: media@technavio.com
Website: www.technavio.com/
")
View original content to download multimedia:https://www.prnewswire.com/news-releases/event-management-as-a-service-market-to-grow-by-5-87-y-o-y-in-2023-rising-number-of-events-and-meetings-will-drive-growth---technavio-301729084.html
SOURCE Technavio
Uncategorized
Apartment permits are back to recession lows. Will mortgage rates follow?
If housing leads us into a recession in the near future, that means mortgage rates have stayed too high for too long.
Share this:

In Tuesday’s report, the 5-unit housing permits data hit the same levels we saw in the COVID-19 recession. Once the backlog of apartments is finished, those jobs will be at risk, which traditionally means mortgage rates would fall soon after, as they have in previous economic cycles.
However, this is happening while single-family permits are still rising as the rate of builder buy-downs and the backlog of single-family homes push single-family permits and starts higher. It is a tale of two markets — something I brought up on CNBC earlier this year to explain why this trend matters with housing starts data because the two marketplaces are heading in opposite directions.
The question is: Will the uptick in single-family permits keep mortgage rates higher than usual? As long as jobless claims stay low, the falling 5-unit apartment permit data might not lead to lower mortgage rates as it has in previous cycles.
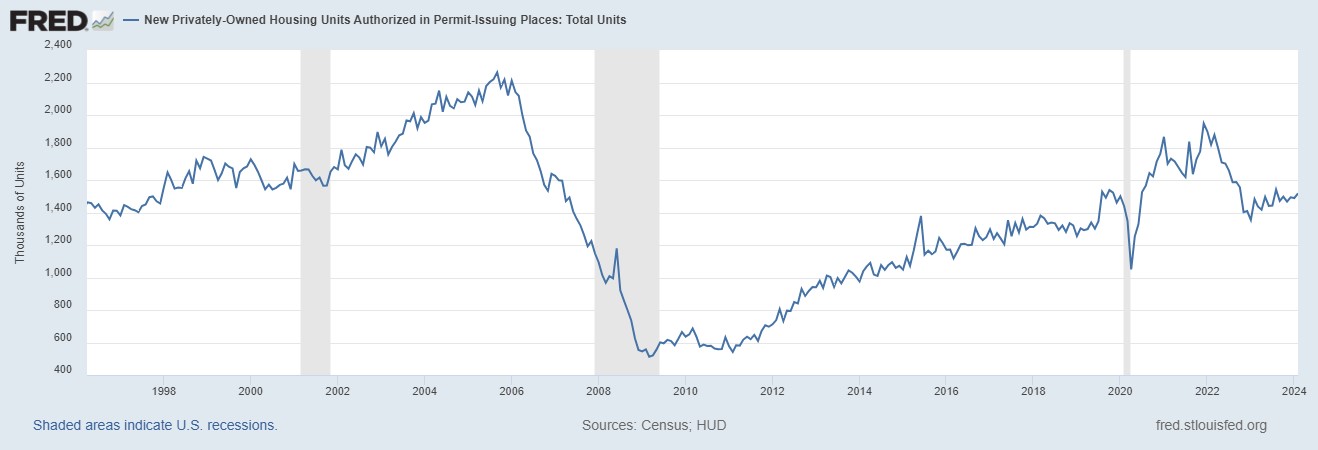
From Census: Building Permits: Privately‐owned housing units authorized by building permits in February were at a seasonally adjusted annual rate of 1,518,000. This is 1.9 percent above the revised January rate of 1,489,000 and 2.4 percent above the February 2023 rate of 1,482,000.
When people say housing leads us in and out of a recession, it is a valid premise and that is why people carefully track housing permits. However, this housing cycle has been unique. Unfortunately, many people who have tracked this housing cycle are still stuck on 2008, believing that what happened during COVID-19 was rampant demand speculation that would lead to a massive supply of homes once home sales crashed. This would mean the builders couldn’t sell more new homes or have housing permits rise.
Housing permits, starts and new home sales were falling for a while, and in 2022, the data looked recessionary. However, new home sales were never near the 2005 peak, and the builders found a workable bottom in sales by paying down mortgage rates to boost demand. The first level of job loss recessionary data has been averted for now. Below is the chart of the building permits.
On the other hand, the apartment boom and bust has already happened. Permits are already back to the levels of the COVID-19 recession and have legs to move lower. Traditionally, when this data line gets this negative, a recession isn’t far off. But, as you can see in the chart below, there’s a big gap between the housing permit data for single-family and five units. Looking at this chart, the recession would only happen after single-family and 5-unit permits fall together, not when we have a gap like we see today.
From Census: Housing completions: Privately‐owned housing completions in February were at a seasonally adjusted annual rate of 1,729,000.
As we can see in the chart below, we had a solid month of housing completions. This was driven by 5-unit completions, which have been in the works for a while now. Also, this month’s report show a weather impact as progress in building was held up due to bad weather. However, the good news is that more supply of rental units will mean the fight against rent inflation will be positive as more supply is the best way to deal with inflation. In time, that is also good news for mortgage rates.
Housing Starts: Privately‐owned housing starts in February were at a seasonally adjusted annual rate of 1,521,000. This is 10.7 percent (±14.2 percent)* above the revised January estimate of 1,374,000 and is 5.9 percent (±10.0 percent)* above the February 2023 rate of 1,436,000.
Housing starts data beat to the upside, but the real story is that the marketplace has diverged into two different directions. The apartment boom is over and permits are heading below the COVID-19 recession, but as long as the builders can keep rates low enough to sell more new homes, single-family permits and starts can slowly move forward.
If we lose the single-family marketplace, expect the chart below to look like it always does before a recession — meaning residential construction workers lose their jobs. For now, the apartment construction workers are at the most risk once they finish the backlog of apartments under construction.

Overall, the housing starts beat to the upside. Still, the report’s internals show a marketplace with early recessionary data lines, which traditionally mean mortgage rates should go lower soon. If housing leads us into a recession in the near future, that means mortgage rates have stayed too high for too long and restrictive policy by the Fed created a recession as we have seen in previous economic cycles.
The builders have been paying down rates to keep construction workers employed, but if rates go higher, it will get more and more challenging to do this because not all builders have the capacity to buy down rates. Last year, we saw what 8% mortgage rates did to new home sales; they dropped before rates fell. So, this is something to keep track of, especially with a critical Federal Reserve meeting this week.
recession covid-19 fed federal reserve home sales mortgage rates recessionUncategorized
One more airline cracks down on lounge crowding in a way you won’t like
Qantas Airways is increasing the price of accessing its network of lounges by as much as 17%.
Share this:


Over the last two years, multiple airlines have dealt with crowding in their lounges. While they are designed as a luxury experience for a small subset of travelers, high numbers of people taking a trip post-pandemic as well as the different ways they are able to gain access through status or certain credit cards made it difficult for some airlines to keep up with keeping foods stocked, common areas clean and having enough staff to serve bar drinks at the rate that customers expect them.
In the fall of 2023, Delta Air Lines (DAL) caught serious traveler outcry after announcing that it was cracking down on crowding by raising how much one needs to spend for lounge access and limiting the number of times one can enter those lounges.
Related: Competitors pushed Delta to backtrack on its lounge and loyalty program changes
Some airlines saw the outcry with Delta as their chance to reassure customers that they would not raise their fees while others waited for the storm to pass to quietly implement their own increases.
Shutterstock
This is how much more you'll have to pay for Qantas lounge access
Australia's flagship carrier Qantas Airways (QUBSF) is the latest airline to announce that it would raise the cost accessing the 24 lounges across the country as well as the 600 international lounges available at airports across the world through partner airlines.
More Travel:
- A new travel term is taking over the internet (and reaching airlines and hotels)
- The 10 best airline stocks to buy now
- Airlines see a new kind of traveler at the front of the plane
Unlike other airlines which grant access primarily after reaching frequent flyer status, Qantas also sells it through a membership — starting from April 18, 2024, prices will rise from $600 Australian dollars ($392 USD) to $699 AUD ($456 USD) for one year, $1,100 ($718 USD) to $1,299 ($848 USD) for two years and $2,000 AUD ($1,304) to lock in the rate for four years.
Those signing up for lounge access for the first time also currently pay a joining fee of $99 AUD ($65 USD) that will rise to $129 AUD ($85 USD).
The airline also allows customers to purchase their membership with Qantas Points they collect through frequent travel; the membership fees are also being raised by the equivalent amount in points in what adds up to as much as 17% — from 308,000 to 399,900 to lock in access for four years.
Airline says hikes will 'cover cost increases passed on from suppliers'
"This is the first time the Qantas Club membership fees have increased in seven years and will help cover cost increases passed on from a range of suppliers over that time," a Qantas spokesperson confirmed to Simple Flying. "This follows a reduction in the membership fees for several years during the pandemic."
The spokesperson said the gains from the increases will go both towards making up for inflation-related costs and keeping existing lounges looking modern by updating features like furniture and décor.
While the price increases also do not apply for those who earned lounge access through frequent flyer status or change what it takes to earn that status, Qantas is also introducing even steeper increases for those renewing a membership or adding additional features such as spouse and partner memberships.
In some cases, the cost of these features will nearly double from what members are paying now.
stocks pandemicUncategorized
Star Wars icon gives his support to Disney, Bob Iger
Disney shareholders have a huge decision to make on April 3.
Share this:

Disney's (DIS) been facing some headwinds up top, but its leadership just got backing from one of the company's more prominent investors.
Star Wars creator George Lucas put out of statement in support of the company's current leadership team, led by CEO Bob Iger, ahead of the April 3 shareholders meeting which will see investors vote on the company's 12-member board.
"Creating magic is not for amateurs," Lucas said in a statement. "When I sold Lucasfilm just over a decade ago, I was delighted to become a Disney shareholder because of my long-time admiration for its iconic brand and Bob Iger’s leadership. When Bob recently returned to the company during a difficult time, I was relieved. No one knows Disney better. I remain a significant shareholder because I have full faith and confidence in the power of Disney and Bob’s track record of driving long-term value. I have voted all of my shares for Disney’s 12 directors and urge other shareholders to do the same."
Related: Disney stands against Nelson Peltz as leadership succession plan heats up
Lucasfilm was acquired by Disney for $4 billion in 2012 — notably under the first term of Iger. He received over 37 million in shares of Disney during the acquisition.
Lucas' statement seems to be an attempt to push investors away from the criticism coming from The Trian Partners investment group, led by Nelson Peltz. The group, owns about $3 million in shares of the media giant, is pushing two candidates for positions on the board, which are Peltz and former Disney CFO Jay Rasulo.
Peltz and Co. have called out a pair of Disney directors — Michael Froman and Maria Elena Lagomasino — for their lack of experience in the media space.
Related: Women's basketball is gaining ground, but is March Madness ready to rival the men's game?
Blackwells Capital is also pushing three of its candidates to take seats during the early April shareholder meeting, though Reuters has reported that the firm has been supportive of the company's current direction.
Disney has struggled in recent years amid the changes in media and the effects of the pandemic — which triggered the return of Iger at the helm in late 2022. After going through mass layoffs in the spring of 2023 and focusing on key growth brands, the company has seen a steady recovery with its stock up over 25% year-to-date and around 40% for the last six months.
Related: Veteran fund manager picks favorite stocks for 2024
stocks pandemic recovery

Manufacturing and construction vs. the still-inverted yield curve


When words make you sick


Apartment permits are back to recession lows. Will mortgage rates follow?


How much stress is too much? A psychiatrist explains the links between toxic stress and poor health − and how to get help


Caitlin Clark, Coach Prime, and Linsanity: The Anatomy of a Viewership ‘Craze’


PR55α-controlled PP2A Inhibits p16 Expression and Blocks Cellular Senescence Induction


US Economic Conditions Scream “Buy Gold”


Wall Street Bonuses Fall For Second Year To 2019 Lows Amid Capital Markets Freeze


Half Of Downtown Pittsburgh Office Space Could Be Empty In 4 Years


Airline, travel companies face Chapter 11 bankruptcy, default risk
-

 Spread & Containment7 days ago
IFM’s Hat Trick and Reflections On Option-To-Buy M&A
-

 Uncategorized4 weeks ago
All Of The Elements Are In Place For An Economic Crisis Of Staggering Proportions
-

 International2 weeks ago
EyePoint poaches medical chief from Apellis; Sandoz CFO, longtime BioNTech exec to retire
-

 Uncategorized1 month ago
California Counties Could Be Forced To Pay $300 Million To Cover COVID-Era Program
-

 Uncategorized4 weeks ago
Apparel Retailer Express Moving Toward Bankruptcy
-

 Uncategorized1 month ago
Industrial Production Decreased 0.1% in January
-

 International2 weeks ago
Walmart launches clever answer to Target’s new membership program
-

 Uncategorized1 month ago
RFK Jr: The Wuhan Cover-Up & The Rise Of The Biowarfare-Industrial Complex