Government
Could US lockdowns slam the breaks on this market rally?
Could US lockdowns slam the breaks on this market rally?
Share this:

The COVID-19 data coming out of the US is grim and getting grimmer. My concern is that many investors have been pricing in an increasingly positive economic recovery, which may not eventuate if governments in the US need to re-introduce lockdowns. And that spells danger for share prices in the US – and other markets as well.
Major equity markets have recovered between half to two thirds of their losses since the height of the global COVID-19 pandemic fears and the lows in late March. This is on the back of the aggressive fiscal and monetary response from governments, as well as an increasing expectation that the impact and lockdowns will be shorter in duration. In the last week, an acceleration in the number of new confirmed COVID-19 cases in the US has seen markets become more nervous that there could be a second wave coming, with a consequent impact on economic activity.
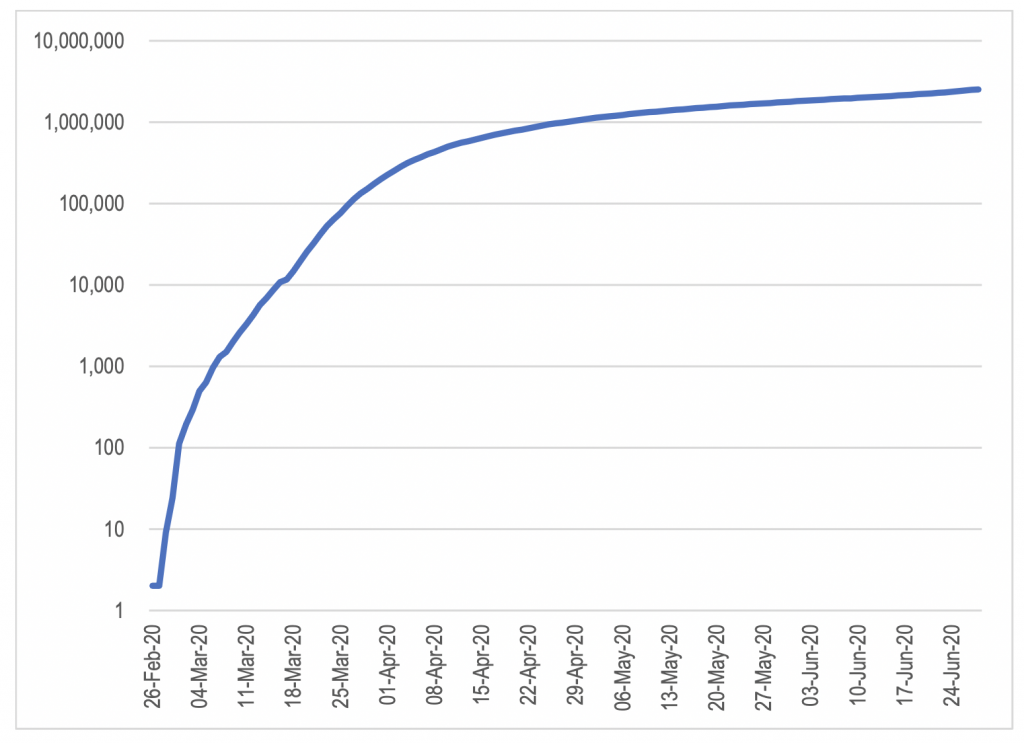
If we look at the number of confirmed cases in the US, plotted on a logarithmic scale to visually show the percentage rate of change in confirmed case numbers, we can see a slight acceleration in the rate of new cases in the last week, with the line steepening marginally.
Figure 1: Total COVID-19 Cases in the US

Source: CDC and state-based agencies
The chart above does not appear to show a major change in the rate of new cases, but this data needs to be disaggregated to understand where the threat exists. The epicentre of the initial outbreak in the US was the tri-state area around New York City.
At the end of April, New York state, New Jersey and Connecticut accounted for 42 per cent of total US confirmed cases despite representing around 10 per cent of the total US population. Since then, sustained lockdown requirements combined with an aggressive testing regime have resulted in a slowing of the rate in new cases.
The recent acceleration in new cases is coming from outside these three states.
Figure 2: Total COVID-19 Cases in the US – Combined NY/NJ/CT Vs the rest of the US

Source: CDC and state-based agencies
If we break this down even further, the acceleration in confirmed cases is primarily occurring in a handful of states such as Florida, Arizona and Texas. To help with comparability given the population differences of the various states, the chart compares the figures on the basis of the number of confirmed cases per 1,000 people resident in the state.
Figure 3: Total COVID-19 Cases per 1,000 Residents

Source: CDC and state-based agencies
This chart shows the material acceleration in case numbers in Florida and Arizona in particular.
However, as we noted back in February, confirmed case volumes are only one measure of the current situation. What we are trying to identify is the extent of the spread of the infection in the broader community. This is where understanding the data in the context of testing volumes becomes important.
If there is not a broader level of spread through the population, the data should show a falling percentage of tests coming back positive as testing volumes are increased and testing is undertaken more broadly throughout the population.
While the US was generally seen as being slow to ramp up testing in order to identify and quarantine cases in the broader community, there was also a very big difference between the timing and scale of the ramp-up in testing between New York, New Jersey and Connecticut and the rest of the US as shown in the chart below. This chart shows that NY/NJ/CT were testing at around two to three times the rate per capita relative to the rest of the country during late May and most of June. If you don’t test, you don’t see the extent of the problem and have no ability to contain it.
Figure 4: Total COVID-19 Tests per Million Residents – 3 Day Average

Source: CDC and state-based agencies
If we look at the problem states in isolation, we see that testing is starting to be ramped up, but remains below the levels of NY/NJ/CT.
Figure 5: Total COVID-19 Tests per Million Residents – 3 Day Average

Source: CDC and state-based agencies
As noted earlier, if there is no broader issue of unidentified community spread of the disease, you would expect the percentage of tests that come back positive to fall as the number and breadth of testing increases. This has been the case for NY/NJ/CT as testing volumes increased through May. The concern in states like Florida and Arizona is that the data shows a considerable increase in the percentage of tests coming back positive in the last couple of weeks despite the almost doubling of test volumes. This could be indicating that there is a much larger spread of the disease throughout the population than previously thought.
Figure 6: Percentage of Daily COVID-19 that are Positive – 3 Day Average

Source: CDC and state-based agencies
More broadly across the US excluding New York, New Jersey and Connecticut, the data is showing an increase in the percentage of tests that are coming back positive at the same time the volume of tests per capita is increasing.
Figure 7: Percentage of Daily Positive COVID-19 Tests Vs Volume of Tests – US Excluding NY/NJ/CT

Source: CDC and state-based agencies
The concern is that there is the potential for the rest of the US to catch up to the per capita case rate of the NY/NJ/CT area. This could see COVID-19 case numbers triple in the US.
Figure 8: Total Cases Per 1,000 Residents – NY/NJ/CT vs the Rest of the US

Source: CDC and state-based agencies
If the rest of the US were to reach the number of COVID-19 cases per capita as NY/NJ/CT, the total number of cases in the US would increase from yesterday’s figure of 2.5 million to around 6.3 million cases.
Of course, the number of cases per capita in NY/NJ/CT does not represent a ceiling. It is possible that that the spread of the disease could easily exceed these levels. A number of the states that are now of concern, were slow to lock down the population and quick to open up again. Additionally, their populations are arguably more resistant to measures that would constrain the strain of the disease than NY/NJ/CT, and it is likely to be harder to get residents to return to lockdown conditions due to lockdown fatigue and discontent with the impact on their lifestyles.
The flipside positives against the eventual spread being worse than the current level of infection per capita in the NY/NJ/CT are that not all states are experiencing the same accelerating in new cases and testing volumes are higher than in the early stages of the outbreak in March.
The implications of a second wave for equity markets are clearly not positive given the market has been pricing an increasingly positive outcome and recovery in that last two months.
If governments need to re-introduce lockdowns, the ability to support the economy through fiscal policy measures will be more limited this time. The existing support measures are not sustainable in the long term given the rapid growth in borrowing to required fund them. Additionally, a material proportion of that support is due to expire in the coming months. This might be extended, but this can only go on for so long. Therefore, a second wave spike in cases carries significant risk to economic activity and equity markets.
However, there are some factors that would reduce the impact on economic activity. The main risk to the economy comes if the healthcare is swamped by the reacceleration in new cases, forcing another lockdown.
A second wave through the rest of the US is likely to have a proportionally smaller impact on hospitalisation rates for a couple of reasons. First, the outbreaks to date in states like Arizona and Florida are more skewed to younger people due to their return to hospitality venues. Hospitalisation rates are lower for younger people with the disease. But this could see some re-imposition of restrictions applied to hospitality venues, with negative implications for stocks exposed to the industry such as gaming stocks.
Additionally, treatments are also likely to have improved, reducing the rate at which cases deteriorate to critical levels.
Government
Low Iron Levels In Blood Could Trigger Long COVID: Study
Low Iron Levels In Blood Could Trigger Long COVID: Study
Authored by Amie Dahnke via The Epoch Times (emphasis ours),
People with inadequate…
Share this:


Authored by Amie Dahnke via The Epoch Times (emphasis ours),
People with inadequate iron levels in their blood due to a COVID-19 infection could be at greater risk of long COVID.
A new study indicates that problems with iron levels in the bloodstream likely trigger chronic inflammation and other conditions associated with the post-COVID phenomenon. The findings, published on March 1 in Nature Immunology, could offer new ways to treat or prevent the condition.
Long COVID Patients Have Low Iron Levels
Researchers at the University of Cambridge pinpointed low iron as a potential link to long-COVID symptoms thanks to a study they initiated shortly after the start of the pandemic. They recruited people who tested positive for the virus to provide blood samples for analysis over a year, which allowed the researchers to look for post-infection changes in the blood. The researchers looked at 214 samples and found that 45 percent of patients reported symptoms of long COVID that lasted between three and 10 months.
In analyzing the blood samples, the research team noticed that people experiencing long COVID had low iron levels, contributing to anemia and low red blood cell production, just two weeks after they were diagnosed with COVID-19. This was true for patients regardless of age, sex, or the initial severity of their infection.
According to one of the study co-authors, the removal of iron from the bloodstream is a natural process and defense mechanism of the body.
But it can jeopardize a person’s recovery.
“When the body has an infection, it responds by removing iron from the bloodstream. This protects us from potentially lethal bacteria that capture the iron in the bloodstream and grow rapidly. It’s an evolutionary response that redistributes iron in the body, and the blood plasma becomes an iron desert,” University of Oxford professor Hal Drakesmith said in a press release. “However, if this goes on for a long time, there is less iron for red blood cells, so oxygen is transported less efficiently affecting metabolism and energy production, and for white blood cells, which need iron to work properly. The protective mechanism ends up becoming a problem.”
The research team believes that consistently low iron levels could explain why individuals with long COVID continue to experience fatigue and difficulty exercising. As such, the researchers suggested iron supplementation to help regulate and prevent the often debilitating symptoms associated with long COVID.
“It isn’t necessarily the case that individuals don’t have enough iron in their body, it’s just that it’s trapped in the wrong place,” Aimee Hanson, a postdoctoral researcher at the University of Cambridge who worked on the study, said in the press release. “What we need is a way to remobilize the iron and pull it back into the bloodstream, where it becomes more useful to the red blood cells.”
The research team pointed out that iron supplementation isn’t always straightforward. Achieving the right level of iron varies from person to person. Too much iron can cause stomach issues, ranging from constipation, nausea, and abdominal pain to gastritis and gastric lesions.
1 in 5 Still Affected by Long COVID
COVID-19 has affected nearly 40 percent of Americans, with one in five of those still suffering from symptoms of long COVID, according to the U.S. Centers for Disease Control and Prevention (CDC). Long COVID is marked by health issues that continue at least four weeks after an individual was initially diagnosed with COVID-19. Symptoms can last for days, weeks, months, or years and may include fatigue, cough or chest pain, headache, brain fog, depression or anxiety, digestive issues, and joint or muscle pain.
Government
Walmart joins Costco in sharing key pricing news
The massive retailers have both shared information that some retailers keep very close to the vest.
Share this:

As we head toward a presidential election, the presumed candidates for both parties will look for issues that rally undecided voters.
The economy will be a key issue, with Democrats pointing to job creation and lowering prices while Republicans will cite the layoffs at Big Tech companies, high housing prices, and of course, sticky inflation.
The covid pandemic created a perfect storm for inflation and higher prices. It became harder to get many items because people getting sick slowed down, or even stopped, production at some factories.
Related: Popular mall retailer shuts down abruptly after bankruptcy filing
It was also a period where demand increased while shipping, trucking and delivery systems were all strained or thrown out of whack. The combination led to product shortages and higher prices.
You might have gone to the grocery store and not been able to buy your favorite paper towel brand or find toilet paper at all. That happened partly because of the supply chain and partly due to increased demand, but at the end of the day, it led to higher prices, which some consumers blamed on President Joe Biden's administration.
Biden, of course, was blamed for the price increases, but as inflation has dropped and grocery prices have fallen, few companies have been up front about it. That's probably not a political choice in most cases. Instead, some companies have chosen to lower prices more slowly than they raised them.
However, two major retailers, Walmart (WMT) and Costco, have been very honest about inflation. Walmart Chief Executive Doug McMillon's most recent comments validate what Biden's administration has been saying about the state of the economy. And they contrast with the economic picture being painted by Republicans who support their presumptive nominee, Donald Trump.
Image source: Joe Raedle/Getty Images
Walmart sees lower prices
McMillon does not talk about lower prices to make a political statement. He's communicating with customers and potential customers through the analysts who cover the company's quarterly-earnings calls.
During Walmart's fiscal-fourth-quarter-earnings call, McMillon was clear that prices are going down.
"I'm excited about the omnichannel net promoter score trends the team is driving. Across countries, we continue to see a customer that's resilient but looking for value. As always, we're working hard to deliver that for them, including through our rollbacks on food pricing in Walmart U.S. Those were up significantly in Q4 versus last year, following a big increase in Q3," he said.
He was specific about where the chain has seen prices go down.
"Our general merchandise prices are lower than a year ago and even two years ago in some categories, which means our customers are finding value in areas like apparel and hard lines," he said. "In food, prices are lower than a year ago in places like eggs, apples, and deli snacks, but higher in other places like asparagus and blackberries."
McMillon said that in other areas prices were still up but have been falling.
"Dry grocery and consumables categories like paper goods and cleaning supplies are up mid-single digits versus last year and high teens versus two years ago. Private-brand penetration is up in many of the countries where we operate, including the United States," he said.
Costco sees almost no inflation impact
McMillon avoided the word inflation in his comments. Costco (COST) Chief Financial Officer Richard Galanti, who steps down on March 15, has been very transparent on the topic.
The CFO commented on inflation during his company's fiscal-first-quarter-earnings call.
"Most recently, in the last fourth-quarter discussion, we had estimated that year-over-year inflation was in the 1% to 2% range. Our estimate for the quarter just ended, that inflation was in the 0% to 1% range," he said.
Galanti made clear that inflation (and even deflation) varied by category.
"A bigger deflation in some big and bulky items like furniture sets due to lower freight costs year over year, as well as on things like domestics, bulky lower-priced items, again, where the freight cost is significant. Some deflationary items were as much as 20% to 30% and, again, mostly freight-related," he added.
bankruptcy pandemic trumpGovernment
Walmart has really good news for shoppers (and Joe Biden)
The giant retailer joins Costco in making a statement that has political overtones, even if that’s not the intent.
Share this:

As we head toward a presidential election, the presumed candidates for both parties will look for issues that rally undecided voters.
The economy will be a key issue, with Democrats pointing to job creation and lowering prices while Republicans will cite the layoffs at Big Tech companies, high housing prices, and of course, sticky inflation.
The covid pandemic created a perfect storm for inflation and higher prices. It became harder to get many items because people getting sick slowed down, or even stopped, production at some factories.
Related: Popular mall retailer shuts down abruptly after bankruptcy filing
It was also a period where demand increased while shipping, trucking and delivery systems were all strained or thrown out of whack. The combination led to product shortages and higher prices.
You might have gone to the grocery store and not been able to buy your favorite paper towel brand or find toilet paper at all. That happened partly because of the supply chain and partly due to increased demand, but at the end of the day, it led to higher prices, which some consumers blamed on President Joe Biden's administration.
Biden, of course, was blamed for the price increases, but as inflation has dropped and grocery prices have fallen, few companies have been up front about it. That's probably not a political choice in most cases. Instead, some companies have chosen to lower prices more slowly than they raised them.
However, two major retailers, Walmart (WMT) and Costco, have been very honest about inflation. Walmart Chief Executive Doug McMillon's most recent comments validate what Biden's administration has been saying about the state of the economy. And they contrast with the economic picture being painted by Republicans who support their presumptive nominee, Donald Trump.
Image source: Joe Raedle/Getty Images
Walmart sees lower prices
McMillon does not talk about lower prices to make a political statement. He's communicating with customers and potential customers through the analysts who cover the company's quarterly-earnings calls.
During Walmart's fiscal-fourth-quarter-earnings call, McMillon was clear that prices are going down.
"I'm excited about the omnichannel net promoter score trends the team is driving. Across countries, we continue to see a customer that's resilient but looking for value. As always, we're working hard to deliver that for them, including through our rollbacks on food pricing in Walmart U.S. Those were up significantly in Q4 versus last year, following a big increase in Q3," he said.
He was specific about where the chain has seen prices go down.
"Our general merchandise prices are lower than a year ago and even two years ago in some categories, which means our customers are finding value in areas like apparel and hard lines," he said. "In food, prices are lower than a year ago in places like eggs, apples, and deli snacks, but higher in other places like asparagus and blackberries."
McMillon said that in other areas prices were still up but have been falling.
"Dry grocery and consumables categories like paper goods and cleaning supplies are up mid-single digits versus last year and high teens versus two years ago. Private-brand penetration is up in many of the countries where we operate, including the United States," he said.
Costco sees almost no inflation impact
McMillon avoided the word inflation in his comments. Costco (COST) Chief Financial Officer Richard Galanti, who steps down on March 15, has been very transparent on the topic.
The CFO commented on inflation during his company's fiscal-first-quarter-earnings call.
"Most recently, in the last fourth-quarter discussion, we had estimated that year-over-year inflation was in the 1% to 2% range. Our estimate for the quarter just ended, that inflation was in the 0% to 1% range," he said.
Galanti made clear that inflation (and even deflation) varied by category.
"A bigger deflation in some big and bulky items like furniture sets due to lower freight costs year over year, as well as on things like domestics, bulky lower-priced items, again, where the freight cost is significant. Some deflationary items were as much as 20% to 30% and, again, mostly freight-related," he added.
bankruptcy pandemic trump

The Coming Of The Police State In America


When Military Rule Supplants Democracy


Catastrophic Risk: Investing and Business Implications


The Digest #187


Dropping Like a Stone: ON RRP Take‑up in the Second Half of 2023


Where Is R‑Star and the End of the Refi Boom: The Top 5 Posts of 2023


Redefining Poverty: Towards a Transpartisan Approach


Students lose out as cities and states give billions in property tax breaks to businesses − draining school budgets and especially hurting the poorest students


Is the United States overestimating China’s power?


Low Iron Levels In Blood Could Trigger Long COVID: Study
-

 Uncategorized2 weeks ago
All Of The Elements Are In Place For An Economic Crisis Of Staggering Proportions
-

 Uncategorized1 month ago
Cathie Wood sells a major tech stock (again)
-

 Uncategorized3 weeks ago
California Counties Could Be Forced To Pay $300 Million To Cover COVID-Era Program
-

 Uncategorized2 weeks ago
Apparel Retailer Express Moving Toward Bankruptcy
-

 Uncategorized3 weeks ago
Industrial Production Decreased 0.1% in January
-

 International2 days ago
Walmart launches clever answer to Target’s new membership program
-

 Uncategorized3 weeks ago
RFK Jr: The Wuhan Cover-Up & The Rise Of The Biowarfare-Industrial Complex
-

 International2 days ago
EyePoint poaches medical chief from Apellis; Sandoz CFO, longtime BioNTech exec to retire