Uncategorized
Banking as a service market 2023-2027; A descriptive analysis of the five forces model, market dynamics, and segmentation – Technavio
Banking as a service market 2023-2027; A descriptive analysis of the five forces model, market dynamics, and segmentation – Technavio
PR Newswire
NEW YORK, Jan. 17, 2023
NEW YORK, Jan. 17, 2023 /PRNewswire/ — According to Technavio, the global ban…
Share this:

Banking as a service market 2023-2027; A descriptive analysis of the five forces model, market dynamics, and segmentation - Technavio
PR Newswire
NEW YORK, Jan. 17, 2023
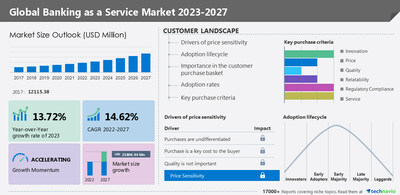
NEW YORK, Jan. 17, 2023 /PRNewswire/ -- According to Technavio, the global banking as a service market size is estimated to grow by USD 21,806.94 million from 2022 to 2027. The market is estimated to grow at a CAGR of 14.62% during the forecast period. North America held the largest share of the global market in 2022, and the market in the region is estimated to witness an incremental growth of 38%. For more Insights on market size, Request a sample report
The global cloud data warehouse market is fragmented, and the five forces analysis covers–
- Bargaining Power of Buyers
- The threat of New Entrants
- Threat of Rivalry
- Bargaining Power of Suppliers
- Threat of Substitutes
- Interpretation of porter's five models helps to strategize the business, for entire details – buy the report!
The report includes the market's adoption lifecycle, from the innovator's stage to the laggard's stage. It focuses on adoption rates in different regions based on penetration. Furthermore, the report also includes key purchase criteria and drivers of price sensitivity to help companies evaluate and develop their growth strategies.
Segment Overview
Technavio has segmented the market based on end-user (banks, NBFC, and government), component (platform and services), and geography (North America, Europe, APAC, South America, and Middle East and Africa).
- The market share growth by the banks segment will be significant during the forecast period. The segment is driven by the increasing adoption of advanced financial technologies by banks. In addition, benefits offered by bank-as-a-service solutions such as cost savings, technology integration, increased customer insights, and enhanced collaboration among others are contributing to the growth of the segment.
Geography Overview
By geography, the global banking as a service market is segmented into North America, Europe, APAC, South America, and Middle East and Africa. The report provides actionable insights and estimates the contribution of all regions to the growth of the global banking as a service market.
- North America is estimated to contribute 38% to the growth of the global market during the forecast period. Major BFSI firms in the region such as Goldman Sachs, JPMorgan Chase Co., and Bank of America Corporation, are investing in technology by offering new apps and interfaces to provide better service to their customers. The region is also witnessing a significant increase in the number of fintech startups. These factors are driving the growth of the banking as a service market in North America.
Key factor driving market growth
- The market is driven by the increasing adoption by end-users.
- Banking as a service solutions offer numerous benefits to end-users.
- They provide convenience, speed, and a wide range of payment options for customers.
- The use of banking as a service solutions is increasing significantly in NBFCs as these solutions allow non-banks to offer core banking services.
- Many such wide benefits of incorporation of banking as a service are driving the growth of the market in focus.
Leading trends influencing the market
- Growing partnerships, collaborations, and agreements is a key trend in the market.
- The market is witnessing an increase in the number of partnerships, collaborations, and agreements among vendors.
- For instance, in February 2020, Bankable announced a strategic collaboration with Visa in the US. With this collaboration, Bankable aims to provide Visa US clients, including corporate and financial institutions, access to its real-time and modular banking solutions, enabling them to deploy digital banking and faster payment services.
- Similarly, in November 2021, Unit, the New York-based banking as a service, partnered with Currencycloud to offer their customers an easy, seamless way to fulfill both domestic and international banking needs.
- This trend among vendors is expected to drive the growth of the market during the forecast period.
Major challenges hindering the market growth
- Implementation and data security issues are key challenges hindering the growth of the market.
- Several fintech companies that are new to banking are typically unaware of the variety of products available in the market.
- There are also legal and security concerns that act as barriers to the implementation of banking as a service.
- As players in the market handle critical user information, they are always concerned about their data being misused.
- Hence, many organizations are skeptical about the deployment of banking as a service for their operations, which is reducing the growth potential in the market.
What are the key data covered in this banking as a service market report?
- CAGR of the market during the forecast period
- Detailed information on factors that will drive the growth of the banking as a service market between 2023 and 2027
- Precise estimation of the size of the banking as a service market size and its contribution to the market in focus on the parent market
- Accurate predictions about upcoming trends and changes in consumer behavior
- Growth of the banking as a service market industry across North America, Europe, APAC, South America, and Middle East and Africa
- A thorough analysis of the market's competitive landscape and detailed information about vendors
- Comprehensive analysis of factors that will challenge the growth of banking as a service market vendors
Gain instant access to 17,000+ market research reports.
Technavio's SUBSCRIPTION platform
- The banking as a service market in Latin America is estimated to grow at a CAGR of 20.2% between 2022 and 2027. The size of the market is forecast to increase by USD 4,309.74 million. The increasing adoption of BaaS solutions by end-users is notably driving the market growth, although factors such as implementation and data security challenges may impede the market growth.
- The home equity lending market is estimated to grow at a CAGR of 3.81% between 2022 and 2027. The size of the market is forecast to increase by USD 35,535.04 million. The massive increase in home prices is notably driving the market growth, although factors such as the fear of losing property may impede the market growth.
Banking As A Service Market Scope
Report Coverage | Details |
Page number | 146 |
Base year | 2022 |
Historic period | 2017-2021 |
Forecast period | 2023-2027 |
Growth momentum & CAGR | Accelerate at a CAGR of 14.62% |
Market growth 2023-2027 | USD 21806.94 million |
Market structure | Fragmented |
YoY growth 2022-2023 (%) | 13.72 |
Regional analysis | North America, Europe, APAC, South America, and Middle East and Africa |
Performing market contribution | North America at 38% |
Key countries | US, Canada, China, France, and Germany |
Competitive landscape | Leading Vendors, Market Positioning of Vendors, Competitive Strategies, and Industry Risks |
Key companies profiled | 11:FS, Alkami Technology Inc., Banco Bilbao Vizcaya Argentaria SA, Block Inc., Bnkbl Ltd., ClearBank Ltd., CREALOGIX AG, Currency Cloud Group Ltd., Finastra, Fiserv Inc., Green Dot Corp., MatchMove Pay Pte Ltd., Movencorp Inc., PayPal Holdings Inc., Q2 Holdings Inc., Societe Generale SA, Solarisbank AG, StoneCastle Digital Solutions LLC, Temenos Headquarters SA, and Urban FT Group Inc. |
Market dynamics | Parent market analysis, market growth inducers and obstacles, fast-growing and slow-growing segment analysis, COVID-19 impact and recovery analysis and future consumer dynamics, and market condition analysis for the forecast period. |
Customization purview | If our report has not included the data that you are looking for, you can reach out to our analysts and get segments customized. |
Customization purview | If our report has not included the data that you are looking for, you can reach out to our analysts and get segments customized. |
1 Executive Summary
- 1.1 Market overview
- Exhibit 01: Executive Summary – Chart on Market Overview
- Exhibit 02: Executive Summary – Data Table on Market Overview
- Exhibit 03: Executive Summary – Chart on Global Market Characteristics
- Exhibit 04: Executive Summary – Chart on Market by Geography
- Exhibit 05: Executive Summary – Chart on Market Segmentation by End-user
- Exhibit 06: Executive Summary – Chart on Market Segmentation by Component
- Exhibit 07: Executive Summary – Chart on Incremental Growth
- Exhibit 08: Executive Summary – Data Table on Incremental Growth
- Exhibit 09: Executive Summary – Chart on Vendor Market Positioning
2 Market Landscape
- 2.1 Market ecosystem
- Exhibit 10: Parent market
- Exhibit 11: Market Characteristics
3 Market Sizing
- 3.1 Market definition
- Exhibit 12: Offerings of vendors included in the market definition
- 3.2 Market segment analysis
- Exhibit 13: Market segments
- 3.3 Market size 2022
- 3.4 Market outlook: Forecast for 2022-2027
- Exhibit 14: Chart on Global - Market size and forecast 2022-2027 ($ million)
- Exhibit 15: Data Table on Global - Market size and forecast 2022-2027 ($ million)
- Exhibit 16: Chart on Global Market: Year-over-year growth 2022-2027 (%)
- Exhibit 17: Data Table on Global Market: Year-over-year growth 2022-2027 (%)
4 Historic Market Size
- 4.1 Global banking as a service market 2017 - 2021
- Exhibit 18: Historic Market Size – Data Table on Global banking as a service market 2017 - 2021 ($ million)
- 4.2 End user Segment Analysis 2017 - 2021
- Exhibit 19: Historic Market Size – End user Segment 2017 - 2021 ($ million)
- 4.3 Component Segment Analysis 2017 - 2021
- Exhibit 20: Historic Market Size – Component Segment 2017 - 2021 ($ million)
- 4.4 Geography Segment Analysis 2017 - 2021
- Exhibit 21: Historic Market Size – Geography Segment 2017 - 2021 ($ million)
- 4.5 Country Segment Analysis 2017 - 2021
- Exhibit 22: Historic Market Size – Country Segment 2017 - 2021 ($ million)
5 Five Forces Analysis
- 5.1 Five forces summary
- Exhibit 23: Five forces analysis - Comparison between 2022 and 2027
- 5.2 Bargaining power of buyers
- Exhibit 24: Chart on Bargaining power of buyers – Impact of key factors 2022 and 2027
- 5.3 Bargaining power of suppliers
- Exhibit 25: Bargaining power of suppliers – Impact of key factors in 2022 and 2027
- 5.4 Threat of new entrants
- Exhibit 26: Threat of new entrants – Impact of key factors in 2022 and 2027
- 5.5 Threat of substitutes
- Exhibit 27: Threat of substitutes – Impact of key factors in 2022 and 2027
- 5.6 Threat of rivalry
- Exhibit 28: Threat of rivalry – Impact of key factors in 2022 and 2027
- 5.7 Market condition
- Exhibit 29: Chart on Market condition - Five forces 2022 and 2027
6 Market Segmentation by End-user
- 6.1 Market segments
- Exhibit 30: Chart on End-user - Market share 2022-2027 (%)
- Exhibit 31: Data Table on End-user - Market share 2022-2027 (%)
- 6.2 Comparison by End-user
- Exhibit 32: Chart on Comparison by End-user
- Exhibit 33: Data Table on Comparison by End-user
- 6.3 Banks - Market size and forecast 2022-2027
- Exhibit 34: Chart on Banks - Market size and forecast 2022-2027 ($ million)
- Exhibit 35: Data Table on Banks - Market size and forecast 2022-2027 ($ million)
- Exhibit 36: Chart on Banks - Year-over-year growth 2022-2027 (%)
- Exhibit 37: Data Table on Banks - Year-over-year growth 2022-2027 (%)
- 6.4 NBFC - Market size and forecast 2022-2027
- Exhibit 38: Chart on NBFC - Market size and forecast 2022-2027 ($ million)
- Exhibit 39: Data Table on NBFC - Market size and forecast 2022-2027 ($ million)
- Exhibit 40: Chart on NBFC - Year-over-year growth 2022-2027 (%)
- Exhibit 41: Data Table on NBFC - Year-over-year growth 2022-2027 (%)
- 6.5 Government - Market size and forecast 2022-2027
- Exhibit 42: Chart on Government - Market size and forecast 2022-2027 ($ million)
- Exhibit 43: Data Table on Government - Market size and forecast 2022-2027 ($ million)
- Exhibit 44: Chart on Government - Year-over-year growth 2022-2027 (%)
- Exhibit 45: Data Table on Government - Year-over-year growth 2022-2027 (%)
- 6.6 Market opportunity by End-user
- Exhibit 46: Market opportunity by End-user ($ million)
7 Market Segmentation by Component
- 7.1 Market segments
- Exhibit 47: Chart on Component - Market share 2022-2027 (%)
- Exhibit 48: Data Table on Component - Market share 2022-2027 (%)
- 7.2 Comparison by Component
- Exhibit 49: Chart on Comparison by Component
- Exhibit 50: Data Table on Comparison by Component
- 7.3 Platform - Market size and forecast 2022-2027
- Exhibit 51: Chart on Platform - Market size and forecast 2022-2027 ($ million)
- Exhibit 52: Data Table on Platform - Market size and forecast 2022-2027 ($ million)
- Exhibit 53: Chart on Platform - Year-over-year growth 2022-2027 (%)
- Exhibit 54: Data Table on Platform - Year-over-year growth 2022-2027 (%)
- 7.4 Services - Market size and forecast 2022-2027
- Exhibit 55: Chart on Services - Market size and forecast 2022-2027 ($ million)
- Exhibit 56: Data Table on Services - Market size and forecast 2022-2027 ($ million)
- Exhibit 57: Chart on Services - Year-over-year growth 2022-2027 (%)
- Exhibit 58: Data Table on Services - Year-over-year growth 2022-2027 (%)
- 7.5 Market opportunity by Component
- Exhibit 59: Market opportunity by Component ($ million)
8 Customer Landscape
- 8.1 Customer landscape overview
- Exhibit 60: Analysis of price sensitivity, lifecycle, customer purchase basket, adoption rates, and purchase criteria
9 Geographic Landscape
- 9.1 Geographic segmentation
- Exhibit 61: Chart on Market share by geography 2022-2027 (%)
- Exhibit 62: Data Table on Market share by geography 2022-2027 (%)
- 9.2 Geographic comparison
- Exhibit 63: Chart on Geographic comparison
- Exhibit 64: Data Table on Geographic comparison
- 9.3 North America - Market size and forecast 2022-2027
- Exhibit 65: Chart on North America - Market size and forecast 2022-2027 ($ million)
- Exhibit 66: Data Table on North America - Market size and forecast 2022-2027 ($ million)
- Exhibit 67: Chart on North America - Year-over-year growth 2022-2027 (%)
- Exhibit 68: Data Table on North America - Year-over-year growth 2022-2027 (%)
- 9.4 Europe - Market size and forecast 2022-2027
- Exhibit 69: Chart on Europe - Market size and forecast 2022-2027 ($ million)
- Exhibit 70: Data Table on Europe - Market size and forecast 2022-2027 ($ million)
- Exhibit 71: Chart on Europe - Year-over-year growth 2022-2027 (%)
- Exhibit 72: Data Table on Europe - Year-over-year growth 2022-2027 (%)
- 9.5 APAC - Market size and forecast 2022-2027
- Exhibit 73: Chart on APAC - Market size and forecast 2022-2027 ($ million)
- Exhibit 74: Data Table on APAC - Market size and forecast 2022-2027 ($ million)
- Exhibit 75: Chart on APAC - Year-over-year growth 2022-2027 (%)
- Exhibit 76: Data Table on APAC - Year-over-year growth 2022-2027 (%)
- 9.6 South America - Market size and forecast 2022-2027
- Exhibit 77: Chart on South America - Market size and forecast 2022-2027 ($ million)
- Exhibit 78: Data Table on South America - Market size and forecast 2022-2027 ($ million)
- Exhibit 79: Chart on South America - Year-over-year growth 2022-2027 (%)
- Exhibit 80: Data Table on South America - Year-over-year growth 2022-2027 (%)
- 9.7 Middle East and Africa - Market size and forecast 2022-2027
- Exhibit 81: Chart on Middle East and Africa - Market size and forecast 2022-2027 ($ million)
- Exhibit 82: Data Table on Middle East and Africa - Market size and forecast 2022-2027 ($ million)
- Exhibit 83: Chart on Middle East and Africa - Year-over-year growth 2022-2027 (%)
- Exhibit 84: Data Table on Middle East and Africa - Year-over-year growth 2022-2027 (%)
- 9.8 US - Market size and forecast 2022-2027
- Exhibit 85: Chart on US - Market size and forecast 2022-2027 ($ million)
- Exhibit 86: Data Table on US - Market size and forecast 2022-2027 ($ million)
- Exhibit 87: Chart on US - Year-over-year growth 2022-2027 (%)
- Exhibit 88: Data Table on US - Year-over-year growth 2022-2027 (%)
- 9.9 China - Market size and forecast 2022-2027
- Exhibit 89: Chart on China - Market size and forecast 2022-2027 ($ million)
- Exhibit 90: Data Table on China - Market size and forecast 2022-2027 ($ million)
- Exhibit 91: Chart on China - Year-over-year growth 2022-2027 (%)
- Exhibit 92: Data Table on China - Year-over-year growth 2022-2027 (%)
- 9.10 Canada - Market size and forecast 2022-2027
- Exhibit 93: Chart on Canada - Market size and forecast 2022-2027 ($ million)
- Exhibit 94: Data Table on Canada - Market size and forecast 2022-2027 ($ million)
- Exhibit 95: Chart on Canada - Year-over-year growth 2022-2027 (%)
- Exhibit 96: Data Table on Canada - Year-over-year growth 2022-2027 (%)
- 9.11 France - Market size and forecast 2022-2027
- Exhibit 97: Chart on France - Market size and forecast 2022-2027 ($ million)
- Exhibit 98: Data Table on France - Market size and forecast 2022-2027 ($ million)
- Exhibit 99: Chart on France - Year-over-year growth 2022-2027 (%)
- Exhibit 100: Data Table on France - Year-over-year growth 2022-2027 (%)
- 9.12 Germany - Market size and forecast 2022-2027
- Exhibit 101: Chart on Germany - Market size and forecast 2022-2027 ($ million)
- Exhibit 102: Data Table on Germany - Market size and forecast 2022-2027 ($ million)
- Exhibit 103: Chart on Germany - Year-over-year growth 2022-2027 (%)
- Exhibit 104: Data Table on Germany - Year-over-year growth 2022-2027 (%)
- 9.13 Market opportunity by geography
- Exhibit 105: Market opportunity by geography ($ million)
10 Drivers, Challenges, and Trends
- 10.1 Market drivers
- 10.2 Market challenges
- 10.3 Impact of drivers and challenges
- Exhibit 106: Impact of drivers and challenges in 2022 and 2027
- 10.4 Market trends
11 Vendor Landscape
- 11.1 Overview
- 11.2 Vendor landscape
- Exhibit 107: Overview on Criticality of inputs and Factors of differentiation
- 11.3 Landscape disruption
- Exhibit 108: Overview on factors of disruption
- 11.4 Industry risks
- Exhibit 109: Impact of key risks on business
12 Vendor Analysis
- 12.1 Vendors covered
- Exhibit 110: Vendors covered
- 12.2 Market positioning of vendors
- Exhibit 111: Matrix on vendor position and classification
- 12.3 11:FS
- Exhibit 112: 11:FS - Overview
- Exhibit 113: 11:FS - Product / Service
- Exhibit 114: 11:FS - Key offerings
- 12.4 Banco Bilbao Vizcaya Argentaria SA
- Exhibit 115: Banco Bilbao Vizcaya Argentaria SA - Overview
- Exhibit 116: Banco Bilbao Vizcaya Argentaria SA - Business segments
- Exhibit 117: Banco Bilbao Vizcaya Argentaria SA - Key offerings
- Exhibit 118: Banco Bilbao Vizcaya Argentaria SA - Segment focus
- 12.5 Block Inc.
- Exhibit 119: Block Inc. - Overview
- Exhibit 120: Block Inc. - Business segments
- Exhibit 121: Block Inc. - Key offerings
- Exhibit 122: Block Inc. - Segment focus
- 12.6 Bnkbl Ltd.
- Exhibit 123: Bnkbl Ltd. - Overview
- Exhibit 124: Bnkbl Ltd. - Product / Service
- Exhibit 125: Bnkbl Ltd. - Key offerings
- 12.7 ClearBank Ltd.
- Exhibit 126: ClearBank Ltd. - Overview
- Exhibit 127: ClearBank Ltd. - Product / Service
- Exhibit 128: ClearBank Ltd. - Key offerings
- 12.8 Currency Cloud Group Ltd.
- Exhibit 129: Currency Cloud Group Ltd. - Overview
- Exhibit 130: Currency Cloud Group Ltd. - Product / Service
- Exhibit 131: Currency Cloud Group Ltd. - Key offerings
- 12.9 Finastra
- Exhibit 132: Finastra - Overview
- Exhibit 133: Finastra - Product / Service
- Exhibit 134: Finastra - Key offerings
- 12.10 Green Dot Corp.
- Exhibit 135: Green Dot Corp. - Overview
- Exhibit 136: Green Dot Corp. - Business segments
- Exhibit 137: Green Dot Corp. - Key offerings
- Exhibit 138: Green Dot Corp. - Segment focus
- 12.11 MatchMove Pay Pte Ltd.
- Exhibit 139: MatchMove Pay Pte Ltd. - Overview
- Exhibit 140: MatchMove Pay Pte Ltd. - Product / Service
- Exhibit 141: MatchMove Pay Pte Ltd. - Key offerings
- 12.12 Movencorp Inc.
- Exhibit 142: Movencorp Inc. - Overview
- Exhibit 143: Movencorp Inc. - Product / Service
- Exhibit 144: Movencorp Inc. - Key offerings
- 12.13 PayPal Holdings Inc.
- Exhibit 145: PayPal Holdings Inc. - Overview
- Exhibit 146: PayPal Holdings Inc. - Product / Service
- Exhibit 147: PayPal Holdings Inc. - Key offerings
- 12.14 Societe Generale SA
- Exhibit 148: Societe Generale SA - Overview
- Exhibit 149: Societe Generale SA - Business segments
- Exhibit 150: Societe Generale SA - Key offerings
- Exhibit 151: Societe Generale SA - Segment focus
- 12.15 Solarisbank AG
- Exhibit 152: Solarisbank AG - Overview
- Exhibit 153: Solarisbank AG - Product / Service
- Exhibit 154: Solarisbank AG - Key offerings
- 12.16 StoneCastle Digital Solutions LLC
- Exhibit 155: StoneCastle Digital Solutions LLC - Overview
- Exhibit 156: StoneCastle Digital Solutions LLC - Product / Service
- Exhibit 157: StoneCastle Digital Solutions LLC - Key offerings
- 12.17 Urban FT Group Inc.
- Exhibit 158: Urban FT Group Inc. - Overview
- Exhibit 159: Urban FT Group Inc. - Product / Service
- Exhibit 160: Urban FT Group Inc. - Key offerings
13 Appendix
- 13.1 Scope of the report
- 13.2 Inclusions and exclusions checklist
- Exhibit 161: Inclusions checklist
- Exhibit 162: Exclusions checklist
- 13.3 Currency conversion rates for US$
- Exhibit 163: Currency conversion rates for US$
- 13.4 Research methodology
- Exhibit 164: Research methodology
- Exhibit 165: Validation techniques employed for market sizing
- Exhibit 166: Information sources
- 13.5 List of abbreviations
- Exhibit 167: List of abbreviations
About Us
Technavio is a leading global technology research and advisory company. Their research and analysis focuses on emerging market trends and provides actionable insights to help businesses identify market opportunities and develop effective strategies to optimize their market positions. With over 500 specialized analysts, Technavio's report library consists of more than 17,000 reports and counting, covering 800 technologies, spanning across 50 countries. Their client base consists of enterprises of all sizes, including more than 100 Fortune 500 companies. This growing client base relies on Technavio's comprehensive coverage, extensive research, and actionable market insights to identify opportunities in existing and potential markets and assess their competitive positions within changing market scenarios.
Contact
Technavio Research
Jesse Maida
Media & Marketing Executive
US: +1 844 364 1100
UK: +44 203 893 3200
Email: media@technavio.com
Website: www.technavio.com/

View original content to download multimedia:https://www.prnewswire.com/news-releases/banking-as-a-service-market-2023-2027-a-descriptive-analysis-of-the-five-forces-model-market-dynamics-and-segmentation---technavio-301721116.html
SOURCE Technavio
Uncategorized
Comments on February Employment Report
The headline jobs number in the February employment report was above expectations; however, December and January payrolls were revised down by 167,000 combined. The participation rate was unchanged, the employment population ratio decreased, and the …
Share this:


Prime (25 to 54 Years Old) Participation
Since the overall participation rate is impacted by both cyclical (recession) and demographic (aging population, younger people staying in school) reasons, here is the employment-population ratio for the key working age group: 25 to 54 years old.
The 25 to 54 years old participation rate increased in February to 83.5% from 83.3% in January, and the 25 to 54 employment population ratio increased to 80.7% from 80.6% the previous month.
Average Hourly Wages
 The graph shows the nominal year-over-year change in "Average Hourly Earnings" for all private employees from the Current Employment Statistics (CES).
 Wage growth has trended down after peaking at 5.9% YoY in March 2022 and was at 4.3% YoY in February.
Part Time for Economic Reasons
 From the BLS report:
"The number of people employed part time for economic reasons, at 4.4 million, changed little in February. These individuals, who would have preferred full-time employment, were working part time because their hours had been reduced or they were unable to find full-time jobs."The number of persons working part time for economic reasons decreased in February to 4.36 million from 4.42 million in February. This is slightly above pre-pandemic levels.
These workers are included in the alternate measure of labor underutilization (U-6) that increased to 7.3% from 7.2% in the previous month. This is down from the record high in April 2020 of 23.0% and up from the lowest level on record (seasonally adjusted) in December 2022 (6.5%). (This series started in 1994). This measure is above the 7.0% level in February 2020 (pre-pandemic).
Unemployed over 26 Weeks
 This graph shows the number of workers unemployed for 27 weeks or more.
 According to the BLS, there are 1.203 million workers who have been unemployed for more than 26 weeks and still want a job, down from 1.277 million the previous month.
This is close to pre-pandemic levels.
Job Streak
| Headline Jobs, Top 10 Streaks | ||
|---|---|---|
| Year Ended | Streak, Months | |
| 1 | 2019 | 100 |
| 2 | 1990 | 48 |
| 3 | 2007 | 46 |
| 4 | 1979 | 45 |
| 5 | 20241 | 38 |
| 6 tie | 1943 | 33 |
| 6 tie | 1986 | 33 |
| 6 tie | 2000 | 33 |
| 9 | 1967 | 29 |
| 10 | 1995 | 25 |
| 1Currrent Streak | ||
Summary:
The headline monthly jobs number was above consensus expectations; however, December and January payrolls were revised down by 167,000 combined. The participation rate was unchanged, the employment population ratio decreased, and the unemployment rate was increased to 3.9%. Another solid report.
Uncategorized
Immune cells can adapt to invading pathogens, deciding whether to fight now or prepare for the next battle
When faced with a threat, T cells have the decision-making flexibility to both clear out the pathogen now and ready themselves for a future encounter.
Share this:


How does your immune system decide between fighting invading pathogens now or preparing to fight them in the future? Turns out, it can change its mind.
Every person has 10 million to 100 million unique T cells that have a critical job in the immune system: patrolling the body for invading pathogens or cancerous cells to eliminate. Each of these T cells has a unique receptor that allows it to recognize foreign proteins on the surface of infected or cancerous cells. When the right T cell encounters the right protein, it rapidly forms many copies of itself to destroy the offending pathogen.

Importantly, this process of proliferation gives rise to both short-lived effector T cells that shut down the immediate pathogen attack and long-lived memory T cells that provide protection against future attacks. But how do T cells decide whether to form cells that kill pathogens now or protect against future infections?
We are a team of bioengineers studying how immune cells mature. In our recently published research, we found that having multiple pathways to decide whether to kill pathogens now or prepare for future invaders boosts the immune system’s ability to effectively respond to different types of challenges.
Fight or remember?
To understand when and how T cells decide to become effector cells that kill pathogens or memory cells that prepare for future infections, we took movies of T cells dividing in response to a stimulus mimicking an encounter with a pathogen.
Specifically, we tracked the activity of a gene called T cell factor 1, or TCF1. This gene is essential for the longevity of memory cells. We found that stochastic, or probabilistic, silencing of the TCF1 gene when cells confront invading pathogens and inflammation drives an early decision between whether T cells become effector or memory cells. Exposure to higher levels of pathogens or inflammation increases the probability of forming effector cells.
Surprisingly, though, we found that some effector cells that had turned off TCF1 early on were able to turn it back on after clearing the pathogen, later becoming memory cells.
Through mathematical modeling, we determined that this flexibility in decision making among memory T cells is critical to generating the right number of cells that respond immediately and cells that prepare for the future, appropriate to the severity of the infection.
Understanding immune memory
The proper formation of persistent, long-lived T cell memory is critical to a person’s ability to fend off diseases ranging from the common cold to COVID-19 to cancer.
From a social and cognitive science perspective, flexibility allows people to adapt and respond optimally to uncertain and dynamic environments. Similarly, for immune cells responding to a pathogen, flexibility in decision making around whether to become memory cells may enable greater responsiveness to an evolving immune challenge.
Memory cells can be subclassified into different types with distinct features and roles in protective immunity. It’s possible that the pathway where memory cells diverge from effector cells early on and the pathway where memory cells form from effector cells later on give rise to particular subtypes of memory cells.
Our study focuses on T cell memory in the context of acute infections the immune system can successfully clear in days, such as cold, the flu or food poisoning. In contrast, chronic conditions such as HIV and cancer require persistent immune responses; long-lived, memory-like cells are critical for this persistence. Our team is investigating whether flexible memory decision making also applies to chronic conditions and whether we can leverage that flexibility to improve cancer immunotherapy.
Resolving uncertainty surrounding how and when memory cells form could help improve vaccine design and therapies that boost the immune system’s ability to provide long-term protection against diverse infectious diseases.
Kathleen Abadie was funded by a NSF (National Science Foundation) Graduate Research Fellowships. She performed this research in affiliation with the University of Washington Department of Bioengineering.
Elisa Clark performed her research in affiliation with the University of Washington (UW) Department of Bioengineering and was funded by a National Science Foundation Graduate Research Fellowship (NSF-GRFP) and by a predoctoral fellowship through the UW Institute for Stem Cell and Regenerative Medicine (ISCRM).
Hao Yuan Kueh receives funding from the National Institutes of Health.
stimulus covid-19 yuan vaccine stimulusUncategorized
Stock indexes are breaking records and crossing milestones – making many investors feel wealthier
The S&P 500 topped 5,000 on Feb. 9, 2024, for the first time. The Dow Jones Industrial Average will probably hit a new big round number soon t…
Share this:


The S&P 500 stock index topped 5,000 for the first time on Feb. 9, 2024, exciting some investors and garnering a flurry of media coverage. The Conversation asked Alexander Kurov, a financial markets scholar, to explain what stock indexes are and to say whether this kind of milestone is a big deal or not.
What are stock indexes?
Stock indexes measure the performance of a group of stocks. When prices rise or fall overall for the shares of those companies, so do stock indexes. The number of stocks in those baskets varies, as does the system for how this mix of shares gets updated.
The Dow Jones Industrial Average, also known as the Dow, includes shares in the 30 U.S. companies with the largest market capitalization – meaning the total value of all the stock belonging to shareholders. That list currently spans companies from Apple to Walt Disney Co.
The S&P 500 tracks shares in 500 of the largest U.S. publicly traded companies.
The Nasdaq composite tracks performance of more than 2,500 stocks listed on the Nasdaq stock exchange.
The DJIA, launched on May 26, 1896, is the oldest of these three popular indexes, and it was one of the first established.
Two enterprising journalists, Charles H. Dow and Edward Jones, had created a different index tied to the railroad industry a dozen years earlier. Most of the 12 stocks the DJIA originally included wouldn’t ring many bells today, such as Chicago Gas and National Lead. But one company that only got booted in 2018 had stayed on the list for 120 years: General Electric.
The S&P 500 index was introduced in 1957 because many investors wanted an option that was more representative of the overall U.S. stock market. The Nasdaq composite was launched in 1971.
You can buy shares in an index fund that mirrors a particular index. This approach can diversify your investments and make them less prone to big losses.
Index funds, which have only existed since Vanguard Group founder John Bogle launched the first one in 1976, now hold trillions of dollars .
Why are there so many?
There are hundreds of stock indexes in the world, but only about 50 major ones.
Most of them, including the Nasdaq composite and the S&P 500, are value-weighted. That means stocks with larger market values account for a larger share of the index’s performance.
In addition to these broad-based indexes, there are many less prominent ones. Many of those emphasize a niche by tracking stocks of companies in specific industries like energy or finance.
Do these milestones matter?
Stock prices move constantly in response to corporate, economic and political news, as well as changes in investor psychology. Because company profits will typically grow gradually over time, the market usually fluctuates in the short term, while increasing in value over the long term.
The DJIA first reached 1,000 in November 1972, and it crossed the 10,000 mark on March 29, 1999. On Jan. 22, 2024, it surpassed 38,000 for the first time. Investors and the media will treat the new record set when it gets to another round number – 40,000 – as a milestone.
The S&P 500 index had never hit 5,000 before. But it had already been breaking records for several weeks.
Because there’s a lot of randomness in financial markets, the significance of round-number milestones is mostly psychological. There is no evidence they portend any further gains.
For example, the Nasdaq composite first hit 5,000 on March 10, 2000, at the end of the dot-com bubble.
The index then plunged by almost 80% by October 2002. It took 15 years – until March 3, 2015 – for it return to 5,000.
By mid-February 2024, the Nasdaq composite was nearing its prior record high of 16,057 set on Nov. 19, 2021.
Index milestones matter to the extent they pique investors’ attention and boost market sentiment.
Investors afflicted with a fear of missing out may then invest more in stocks, pushing stock prices to new highs. Chasing after stock trends may destabilize markets by moving prices away from their underlying values.
When a stock index passes a new milestone, investors become more aware of their growing portfolios. Feeling richer can lead them to spend more.
This is called the wealth effect. Many economists believe that the consumption boost that arises in response to a buoyant stock market can make the economy stronger.
Is there a best stock index to follow?
Not really. They all measure somewhat different things and have their own quirks.
For example, the S&P 500 tracks many different industries. However, because it is value-weighted, it’s heavily influenced by only seven stocks with very large market values.
Known as the “Magnificent Seven,” shares in Amazon, Apple, Alphabet, Meta, Microsoft, Nvidia and Tesla now account for over one-fourth of the S&P 500’s value. Nearly all are in the tech sector, and they played a big role in pushing the S&P across the 5,000 mark.
This makes the index more concentrated on a single sector than it appears.
But if you check out several stock indexes rather than just one, you’ll get a good sense of how the market is doing. If they’re all rising quickly or breaking records, that’s a clear sign that the market as a whole is gaining.
Sometimes the smartest thing is to not pay too much attention to any of them.
For example, after hitting record highs on Feb. 19, 2020, the S&P 500 plunged by 34% in just 23 trading days due to concerns about what COVID-19 would do to the economy. But the market rebounded, with stock indexes hitting new milestones and notching new highs by the end of that year.
Panicking in response to short-term market swings would have made investors more likely to sell off their investments in too big a hurry – a move they might have later regretted. This is why I believe advice from the immensely successful investor and fan of stock index funds Warren Buffett is worth heeding.
Buffett, whose stock-selecting prowess has made him one of the world’s 10 richest people, likes to say “Don’t watch the market closely.”
If you’re reading this because stock prices are falling and you’re wondering if you should be worried about that, consider something else Buffett has said: “The light can at any time go from green to red without pausing at yellow.”
And the opposite is true as well.
Alexander Kurov does not work for, consult, own shares in or receive funding from any company or organization that would benefit from this article, and has disclosed no relevant affiliations beyond their academic appointment.
dow jones sp 500 nasdaq stocks covid-19

Watch Live: President Biden Reminds Americans Just How Good They’ve Got It Thanks To Him


Watch: President Biden Delivers The “Darkest, Most Un-American Speech Given By A President”


Interest rates, the best it gets. It’s time to deploy cash


Is the biotech market rally real? Data suggest comeback in private, public markets


Europe Is Alarmed Enough To Begin Wargaming A Food Crisis


Normalise the underlying conditions when “rating” a company’s share price


COVID-19 Lockdowns Had High Health, Economic Costs: Swedish Study


People Who Received Ivermectin Were Better Off, Study Finds


Stock Market’s Top Will Outlast Your Disbelief
Democrats “Nervous” Ahead Of Biden’s State Of The Union Address
-

 Uncategorized2 weeks ago
All Of The Elements Are In Place For An Economic Crisis Of Staggering Proportions
-

 Uncategorized1 month ago
Cathie Wood sells a major tech stock (again)
-

 Uncategorized3 weeks ago
California Counties Could Be Forced To Pay $300 Million To Cover COVID-Era Program
-

 Uncategorized2 weeks ago
Apparel Retailer Express Moving Toward Bankruptcy
-

 Uncategorized3 weeks ago
Industrial Production Decreased 0.1% in January
-

 International1 month ago
War Delirium
-

 Uncategorized3 weeks ago
RFK Jr: The Wuhan Cover-Up & The Rise Of The Biowarfare-Industrial Complex
-

 Uncategorized3 weeks ago
GOP Efforts To Shore Up Election Security In Swing States Face Challenges