Cardinal Health Reports Fourth Quarter and Full Year Results for Fiscal Year 2022
Cardinal Health Reports Fourth Quarter and Full Year Results for Fiscal Year 2022
PR Newswire
DUBLIN, Ohio, Aug. 11, 2022
Revenue increased 11% to $47.1 billion in the fourth quarterGAAP1 operating earnings were $36 million in the fourth quarter; G…
Share this:


Cardinal Health Reports Fourth Quarter and Full Year Results for Fiscal Year 2022
PR Newswire
DUBLIN, Ohio, Aug. 11, 2022
- Revenue increased 11% to $47.1 billion in the fourth quarter
- GAAP1 operating earnings were $36 million in the fourth quarter; GAAP diluted EPS were $0.50 in the fourth quarter
- Non-GAAP operating earnings increased 41% to $450 million in the fourth quarter; non-GAAP diluted EPS increased 36% to $1.05 in the fourth quarter
- Generated operating cash flow of $3.1 billion in fiscal year 2022
- Company provides fiscal year 2023 guidance and reiterates long-term targets
- Company introduces Medical Improvement Plan, targeting Medical segment profit of at least $650 million by fiscal year 2025
DUBLIN, Ohio, Aug. 11, 2022 /PRNewswire/ -- Cardinal Health (NYSE: CAH) today reported fourth quarter fiscal year 2022 revenues of $47.1 billion, an increase of 11% from the fourth quarter of last year. GAAP operating earnings were $36 million, primarily due to a non-cash, pre-tax goodwill impairment charge of $303 million in the Medical segment. GAAP diluted earnings per share (EPS) were $0.50, primarily due to this impairment, net of tax effects. Non-GAAP operating earnings increased 41% to $450 million, primarily due to the increase in Pharmaceutical segment profit, and non-GAAP diluted EPS increased 36% to $1.05 in the quarter.
Fiscal year 2022 revenues were $181.4 billion, a 12% increase from fiscal year 2021. GAAP operating loss was $596 million due to non-cash, pre-tax goodwill impairment charges of $2.1 billion in the Medical segment. GAAP diluted loss per share was $3.35, primarily due to these impairments, net of tax effects. Non-GAAP operating earnings decreased 12% to $2.0 billion, primarily due to net inflationary impacts and global supply chain constraints in the Medical segment. Non-GAAP diluted EPS decreased 9% to $5.06 due to the decline in Medical segment profit, partially offset by an increase in Pharmaceutical segment profit, net of tax effects.
"In fiscal year 2022, Medical segment performance was significantly impacted by inflation and supply chain constraints," said Mike Kaufmann, CEO of Cardinal Health. "In addition, the Pharmaceutical segment grew 5% and we generated strong cash flow, returning $1.6 billion to our shareholders through share repurchases and dividends."
Jason Hollar, CFO of Cardinal Health, said, "Looking forward, we have confidence in our Medical Improvement Plan and our long-term targets for growth. We remain committed to the essential role our company plays in healthcare and to delivering value for our customers, employees, and investors."
Q4 and full year FY22 summary
Q4 FY22 | Q4 FY21 | Y/Y | FY22 | FY21 | Y/Y | ||||||
Revenue | $47.1 billion | $42.6 billion | 11 % | $181.4 billion | $162.5 billion | 12 % | |||||
Operating earnings/(loss) | $36 million | $162 million | (78) % | $(596) million | $472 million | N.M. | |||||
Non-GAAP operating earnings | $450 million | $320 million | 41 % | $2.0 billion | $2.3 billion | (12) % | |||||
Net earnings/(loss) attributable to Cardinal Health, Inc. | $138 million | $116 million | 19 % | $(933) million | $611 million | N.M. | |||||
Non-GAAP net earnings attributable to Cardinal Health, Inc. | $289 million | $227 million | 27 % | $1.4 billion | $1.6 billion | (13) % | |||||
Effective Tax Rate1 | 575.3 % | 2.6 % | (21.2) % | (89.7) % | |||||||
Non-GAAP Effective Tax Rate | 25.4 % | 22.6 % | 22.1 % | 22.8 % | |||||||
Diluted EPS attributable to Cardinal Health, Inc. | $0.50 | $0.40 | 25 % | $(3.35) | $2.08 | N.M. | |||||
Non-GAAP diluted EPS attributable to Cardinal Health, Inc. | $1.05 | $0.77 | 36 % | $5.06 | $5.57 | (9) % |
Segment results
Pharmaceutical segment
Q4 FY22 | Q4 FY21 | Y/Y | FY22 | FY21 | Y/Y | ||||||
Revenue | $43.3 billion | $38.3 billion | 13 % | $165.5 billion | $145.8 billion | 14 % | |||||
Segment profit | $451 million | $358 million | 26 % | $1.8 billion | $1.7 billion | 5 % |
Fourth-quarter revenue for the Pharmaceutical segment increased 13% to $43.3 billion driven by branded pharmaceutical sales growth from existing and net new Pharmaceutical Distribution and Specialty customers.
Pharmaceutical segment profit increased 26% to $451 million in the fourth quarter, driven by generics program performance and a higher contribution from brand sales mix, partially offset by inflationary supply chain costs. Additionally, this reflects a favorable comparison due to prior year inventory adjustments.
Medical segment
Q4 FY22 | Q4 FY21 | Y/Y | FY22 | FY21 | Y/Y | ||||||
Revenue | $3.8 billion | $4.2 billion | (11) % | $15.9 billion | $16.7 billion | (5) % | |||||
Segment profit | $(16) million | $(63) million | 75 % | $216 million | $577 million | (63) % |
Fourth-quarter revenue for the Medical segment decreased 11% to $3.8 billion, due to the divestiture of the Cordis business and lower products and distribution volumes.
Medical segment loss of $16 million in the fourth quarter was primarily due to net inflationary impacts and global supply chain constraints in products and distribution. Additionally, the favorable comparison to the prior year PPE inventory reserve was offset by a lower contribution from PPE and the divestiture of the Cordis business.
Fiscal year 2023 outlook2,3
Non-GAAP earnings per share | $5.05 - $5.40 |
Interest and other | $140M - $170M |
Non-GAAP effective tax rate | 23.0% - 25.0% |
Diluted weighted average shares outstanding | 262M - 266M |
Share repurchases | $1.5B - $2.0B |
Capital Expenditures | ~$500M |
Adjusted free cash flow | $1.5B - $2.0B |
Long-term financial targets
The company reiterated its long-term targets of low to mid-single digit segment profit growth in the Pharmaceutical segment, mid to high-single digit segment profit growth in the Medical segment, and to average a double-digit combined Non-GAAP EPS growth and dividend yield. Additionally, the company is targeting Medical segment profit of at least $650 million by fiscal year 2025, based on its Medical Improvement Plan.
Leadership changes
The company separately announced that its Board of Directors has elected Jason Hollar, the company's current Chief Financial Officer, to serve as its next Chief Executive Officer, effective September 1, 2022. Mr. Hollar will succeed Mike Kaufmann, the company's CEO since January 2018. Mr. Hollar will also join the company's Board of Directors. Additionally, Patricia English, the company's current Chief Accounting Officer, will serve as interim CFO, while the company conducts an external search for a permanent CFO.
Recent highlights
- Cardinal Health announced that it has acquired the Bendcare group purchasing organization entity, strengthening Specialty Solutions' Cornerstone RheumatologyTM GPO as a leading rheumatology-focused GPO. The company also made a minority investment in the Bendcare management services organization.
- Cardinal Health announced the addition of a new 208,144 square foot distribution center in the Columbus, Ohio, area as part of a multi-year warehouse modernization and growth plan. The new distribution center will support the company's at-Home Solutions business, a market-leading medical supplies provider and specialized business focused on providing comfortable care in the home for people with chronic and serious health conditions.
- Cardinal Health announced the acquisition of ScalaMed, a smart platform that transfers prescriptions directly to patients via a secure mobile app. The acquisition transfers ScalaMed's technology and assets to Outcomes™, a Cardinal Health company.
- Cardinal Health hosted its 30th annual Retail Business Conference with more than 4,000 customers in attendance, representing 3,000 unique independent community pharmacies, highlighting the company's innovations and demonstrating its commitment to customers.
- Cardinal Health, along with pharmaceutical distribution peers, reached an agreement with the State of Oklahoma to resolve opioid-related claims. If that and the previously announced agreement with the State of Washington are finalized, 48 of 49 eligible states will be subject to the previously disclosed broad settlement agreement. Additionally, the distributors reached an agreement to settle the opioid-related claims of the majority of West Virginia subdivisions.
- Cardinal Health Board of Directors approved a quarterly dividend of $0.4957 per share out of the company's capital surplus. The dividend will be payable on October 15, 2022 to shareholders of record at the close of business on October 3, 2022.
Upcoming webcasted investor events
- Morgan Stanley 20th Annual Global Healthcare Conference at 10:00am EST, September 13, 2022
Webcast
Cardinal Health will host a webcast today at 8:30 a.m. Eastern to discuss fourth quarter and full year results. To access the webcast and corresponding slide presentation, go to the Investor Relations page at ir.cardinalhealth.com. No access code is required.
Presentation slides and a webcast replay will be available until August 10, 2023.
About Cardinal Health
Cardinal Health is a distributor of pharmaceuticals, a global manufacturer and distributor of medical and laboratory products, and a provider of performance and data solutions for health care facilities. With 50 years in business, operations in more than 30 countries and approximately 44,000 employees globally, Cardinal Health is essential to care. Information about Cardinal Health is available at cardinalhealth.com.
Contacts
Media: Erich Timmerman, erich.timmerman@cardinalhealth.com and 614.757.8231
Investors: Kevin Moran, kevin.moran@cardinalhealth.com and 614.757.7942
1The GAAP effective tax rate for the fourth quarter of fiscal year 2022 and fiscal year 2022 were impacted by the goodwill impairment charges of $303 million and $2.1 billion, respectively, in the Medical segment. The net tax benefit related to these charges included in the GAAP effective tax rate is $240 million in the fourth quarter and $150 million for the full year.
The GAAP effective tax rates for the fourth quarter of fiscal year 2021 and fiscal year 2021 included net tax benefits related to the treatment of the tax impacts of the opioid litigation charges. Included in the GAAP effective tax rate for fiscal 2021 was a benefit from the net operating loss carryback primarily related to a self-insurance pre-tax loss.
2GAAP refers to U.S. generally accepted accounting principles. This news release includes GAAP financial measures as well as non-GAAP financial measures, which are financial measures not calculated in accordance with GAAP. See "Use of Non-GAAP Measures" following the attached schedules for definitions of the non-GAAP financial measures presented in this news release and see the attached schedules for reconciliations of the differences between the non-GAAP financial measures and their most directly comparable GAAP financial measures.
3The company does not provide forward-looking guidance on a GAAP basis as certain financial information, the probable significance of which cannot be determined, is not available and cannot be reasonably estimated. See "Use of Non-GAAP Measures" following the attached schedules for additional explanation.
Cardinal Health uses its website as a channel of distribution for material company information. Important information, including news releases, financial information, earnings and analyst presentations, and information about upcoming presentations and events is routinely posted and accessible on the Investor Relations page at ir.cardinalhealth.com. In addition, the website allows investors and other interested persons to sign up automatically to receive email alerts when the company posts news releases, SEC filings and certain other information on its website.
Cautions concerning forward-looking statements
This release contains forward-looking statements addressing expectations, prospects, estimates and other matters that are dependent upon future events or developments. These statements may be identified by words such as "expect," "anticipate," "intend," "plan," "believe," "will," "should," "could," "would," "project," "continue," "likely," and similar expressions, and include statements reflecting future results or guidance, statements of outlook and various accruals and estimates. These matters are subject to risks and uncertainties that could cause actual results to differ materially from those projected, anticipated or implied. These risks and uncertainties include risks arising from ongoing inflationary pressures and supply chain constraints, including the risk that our plans to mitigate such effects may not be as successful as we anticipate and the possibility that costs to source certain personal protective or other equipment, increased costs for transportation, shipping, freight and commodities, reduced price or demand for certain products may result in additional inventory reserves or disruptions and may negatively impact our ability to meet our long-term guidance; the possibility that our Medical unit goodwill could be further impaired, the increase in global interest rates or possible unfavorable changes in the U.S. statutory tax rate; competitive pressures in Cardinal Health's various lines of business; the performance of our generics program, including the amount or rate of generic deflation and our ability to offset generic deflation and maintain other financial and strategic benefits through our generic sourcing venture with CVS Health; ongoing risks associated with the distribution of opioids, including the financial impact associated with the settlements with governmental authorities, the risk that challenges to our plans to take tax deductions for opioid-related losses could adversely impact our financial results, risks arising from the Department of Justice investigation which we believe concerns our anti-diversion program and risks associated with the injunctive relief requirements under the national settlement, including the risk that we may incur higher costs or operational challenges in the implementation and maintenance of the required changes; risks associated with the manufacture and sourcing of certain products, including risks related to our ability and the ability of third-party manufacturers to import or export certain products or component parts and to comply with applicable regulations; risks associated with the competitive labor market and our ability to attract and retain employees in key roles; our ability to manage uncertainties associated with the pricing of branded pharmaceuticals; and risks associated with our cost savings initiatives or other business initiatives, such as the Medical Improvement Plan, including the possibility that they could fail to achieve the intended results. Cardinal Health is subject to additional risks and uncertainties described in Cardinal Health's Form 10-K, Form 10-Q and Form 8-K reports and exhibits to those reports. This release reflects management's views as of August 11, 2022. Except to the extent required by applicable law, Cardinal Health undertakes no obligation to update or revise any forward-looking statement. Forward-looking statements are aspirational and not guarantees or promises that goals, targets or projections will be met, and no assurance can be given that any commitment, expectation, initiative or plan in this report can or will be achieved or completed. Cardinal Health provides definitions and reconciliations of non-GAAP financial measures and their most directly comparable GAAP financial measures at ir.cardinalhealth.com.
Schedule 1 | |||||||||||
Cardinal Health, Inc. and Subsidiaries | |||||||||||
Fourth Quarter | Fiscal Year | ||||||||||
(in millions, except per common share amounts) | 2022 | 2021 | % Change | 2022 | 2021 | % Change | |||||
Revenue | $ 47,103 | $ 42,586 | 11 % | $ 181,364 | $ 162,467 | 12 % | |||||
Cost of products sold | 45,498 | 41,111 | 11 % | 174,819 | 155,689 | 12 % | |||||
Gross margin | 1,605 | 1,475 | 9 % | 6,545 | 6,778 | (3) % | |||||
Operating expenses: | |||||||||||
Distribution, selling, general and administrative expenses | 1,155 | 1,129 | 2 % | 4,557 | 4,533 | 1 % | |||||
Restructuring and employee severance | 45 | 33 | 101 | 114 | |||||||
Amortization and other acquisition-related costs | 87 | 106 | 324 | 451 | |||||||
Impairments and (gain)/loss on disposal of assets, net 1 | 286 | 1 | 2,050 | 79 | |||||||
Litigation (recoveries)/charges, net 2,3 | (4) | 44 | 109 | 1,129 | |||||||
Operating earnings/(loss) | 36 | 162 | (78) % | (596) | 472 | N.M. | |||||
Other (income)/expense, net | 30 | (16) | 16 | (47) | |||||||
Interest expense, net | 34 | 44 | (23) % | 149 | 180 | (17) % | |||||
Loss on early extinguishment of debt | — | 13 | 10 | 14 | |||||||
(Gain)/Loss on sale of equity interest in naviHealth | — | 2 | (2) | 2 | |||||||
Earnings/(loss) before income taxes | (28) | 119 | N.M. | (769) | 323 | N.M. | |||||
Provision for/(benefit from) income taxes 4,5 | (165) | 4 | N.M. | 163 | (289) | N.M. | |||||
Net earnings/(loss) | 137 | 115 | 19 % | (932) | 612 | N.M. | |||||
Less: Net earnings attributable to noncontrolling interests | 1 | 1 | (1) | (1) | |||||||
Net earnings/(loss) attributable to Cardinal Health, Inc. | $ 138 | $ 116 | 19 % | $ (933) | $ 611 | N.M. | |||||
Earnings/(Loss) per common share attributable to Cardinal Health, Inc.: | |||||||||||
Basic | $ 0.51 | $ 0.40 | 28 % | $ (3.35) | 6 | $ 2.09 | N.M. | ||||
Diluted | 0.50 | 0.40 | 25 % | (3.35) | 6 | 2.08 | N.M. | ||||
Weighted-average number of common shares outstanding: | |||||||||||
Basic | 273 | 290 | 279 | 292 | |||||||
Diluted | 275 | 293 | 279 | 294 | |||||||
1 Impairments and (gain)/loss on disposals of assets, net includes pre-tax goodwill impairment charges of $303 million and $2.1 billion related to the Medical segment recorded in the fourth quarter and year-to-date periods of fiscal 2022, respectively. |
2 Litigation (recoveries)/charges, net includes a one-time contingent attorneys' fee of $18 million recorded during fiscal 2022 related to the finalization of the settlement agreement (the "Settlement Agreement") resulting in the settlement of the vast majority of opioid lawsuits filed by state and local governmental entities. Due to the unique nature and significance of the Settlement Agreement, and the one-time, contingent nature of the fee, this fee was included in litigation (recoveries)/charges, net. |
3 Litigation (recoveries)/charges, net includes a pre-tax charge of $1.17 billion recorded in fiscal 2021 related to the opioid litigation. |
4 Provision for/(benefit from) income taxes during the fourth quarter and year-to-date periods of fiscal 2022 includes the tax effects relating to the impairment charges. For the fourth quarter and year-to-date periods of fiscal 2022, the net tax benefit related to these impairments is $240 million and $150 million, respectively, and is included in the annual effective tax rate. |
5 Provision for/(benefit from) from income taxes includes a tax benefit recorded during fiscal 2021 related to a net operating loss carryback. Our wholly-owned insurance subsidiary recorded a self-insurance pre-tax loss in its fiscal 2020 statutory financial statements primarily related to opioid litigation. This self-insurance pre-tax loss, which did not impact our pre-tax consolidated results, was deducted on our fiscal 2020 consolidated federal income tax return and contributed to a significant net operating loss for tax purposes. The net operating loss was carried back and adjusted our taxable income for fiscal 2015, 2016, 2017 and 2018 as permitted under the Coronavirus Aid, Relief and Economic Security ("CARES") Act. The total benefit from the net operating loss carryback was $424 million. |
In addition, the amount of tax benefit increased by approximately $50 million during the fourth quarter of fiscal 2022 compared to the tax impacts that would have been recognized without the opioid litigation charge. The net tax benefit associated with the opioid litigation charges was $228 million for fiscal 2021. |
6 Due to the net loss during fiscal 2022, potentially dilutive common shares have not been included in the denominator due to their anti-dilutive effect. |
Schedule 2 | |||
Cardinal Health, Inc. and Subsidiaries | |||
(in millions) | June 30, 2022 | June 30, 2021 | |
Assets | |||
Current assets: | |||
Cash and equivalents | $ 4,717 | $ 3,407 | |
Trade receivables, net | 10,561 | 9,103 | |
Inventories, net | 15,636 | 14,594 | |
Prepaid expenses and other | 2,021 | 2,843 | |
Assets held for sale | — | 1,101 | |
Total current assets | 32,935 | 31,048 | |
Property and equipment, net | 2,361 | 2,360 | |
Goodwill and other intangibles, net | 7,629 | 10,094 | |
Other assets | 953 | 951 | |
Total assets | $ 43,878 | $ 44,453 | |
Liabilities and Shareholders' Equity/(Deficit) | |||
Current liabilities: | |||
Accounts payable | $ 27,128 | $ 23,700 | |
Current portion of long-term obligations and other short-term borrowings | 580 | 871 | |
Other accrued liabilities | 2,842 | 2,957 | |
Liabilities related to assets held for sale | — | 96 | |
Total current liabilities | 30,550 | 27,624 | |
Long-term obligations, less current portion | 4,735 | 5,365 | |
Deferred income taxes and other liabilities | 9,299 | 9,670 | |
Total shareholders' equity/(deficit) | (706) | 1,794 | |
Total liabilities and shareholders' equity/(deficit) | $ 43,878 | $ 44,453 | |
Schedule 3 | |||||||
Cardinal Health, Inc. and Subsidiaries | |||||||
Fourth Quarter | Fiscal Year | ||||||
(in millions) | 2022 | 2021 | 2022 | 2021 | |||
Cash flows from operating activities: | |||||||
Net earnings/(loss) | $ 137 | $ 115 | $ (932) | $ 612 | |||
Adjustments to reconcile net earnings/(loss) to net cash provided by operating activities: | |||||||
Depreciation and amortization | 179 | 180 | 692 | 783 | |||
Impairments and loss on sale of other investments | 21 | — | 24 | — | |||
(Gain)/Loss on sale of equity interest in naviHealth | — | 2 | (2) | 2 | |||
Impairments and (gain)/loss on disposal of assets, net | 286 | 1 | 2,050 | 79 | |||
Loss on early extinguishment of debt | — | 13 | 10 | 14 | |||
Share-based compensation | 16 | 5 | 81 | 89 | |||
Provision for deferred income taxes | 7 | 496 | 7 | 496 | |||
Provision for bad debts | 22 | 16 | 68 | 65 | |||
Change in operating assets and liabilities, net of effects from acquisitions and divestitures: | |||||||
Increase in trade receivables | (333) | (393) | (1,526) | (904) | |||
Increase in inventories | (149) | (261) | (1,071) | (1,584) | |||
Increase in accounts payable | 2,307 | 1,058 | 3,428 | 2,325 | |||
Other accrued liabilities and operating items, net | 499 | (567) | 293 | 452 | |||
Net cash provided by operating activities | 2,992 | 665 | 3,122 | 2,429 | |||
Cash flows from investing activities: | |||||||
Proceeds from divestitures, net of cash sold | — | — | 923 | — | |||
Acquisition of subsidiaries, net of cash acquired | (22) | — | (22) | (3) | |||
Additions to property and equipment | (164) | (126) | (387) | (400) | |||
Proceeds from disposal of property and equipment | 20 | — | 31 | — | |||
Purchases of investments | (40) | (4) | (78) | (22) | |||
Proceeds from sale of investments | 2 | 42 | 29 | 47 | |||
Proceeds from net investment hedge terminations | — | — | 71 | — | |||
Net cash provided by/(used in) investing activities | (204) | (88) | 567 | (378) | |||
Cash flows from financing activities: | |||||||
Proceeds from interest rate swap terminations | — | — | — | 18 | |||
Reduction of long-term obligations | (288) | (517) | (885) | (570) | |||
Net tax proceeds/(withholdings) from share-based compensation | 7 | 9 | (19) | 8 | |||
Dividends on common shares | (134) | (141) | (559) | (573) | |||
Purchase of treasury shares | — | — | (1,000) | (200) | |||
Net cash used in financing activities | (415) | (649) | (2,463) | (1,317) | |||
Effect of exchange rates changes on cash and equivalents | (12) | 3 | (25) | 11 | |||
Cash reclassified from/(to) assets held for sale | — | (23) | 109 | (109) | |||
Net increase/(decrease) in cash and equivalents | 2,361 | (92) | 1,310 | 636 | |||
Cash and equivalents at beginning of period | 2,356 | 3,499 | 3,407 | 2,771 | |||
Cash and equivalents at end of period | $ 4,717 | $ 3,407 | $ 4,717 | $ 3,407 | |||
Schedule 4 | ||||||||
Cardinal Health, Inc. and Subsidiaries | ||||||||
Fourth Quarter | ||||||||
(in millions) | 2022 | 2021 | (in millions) | 2022 | 2021 | |||
Pharmaceutical | Medical | |||||||
Revenue | Revenue | |||||||
Amount | $ 43,337 | $ 38,344 | Amount | $ 3,769 | $ 4,246 | |||
Growth rate | 13 % | 15 % | Growth rate | (11) % | 23 % | |||
Segment profit | Segment profit 3 | |||||||
Amount | $ 451 | $ 358 | Amount | $ (16) | $ (63) | |||
Growth rate | 26 % | — % | Growth rate | 75 % | (153) % | |||
Segment profit margin | 1.04 % | 0.93 % | Segment profit margin | (0.42) % | (1.50) % | |||
Fiscal Year | ||||||||
(in millions) | 2022 | 2021 | (in millions) | 2022 | 2021 | |||
Pharmaceutical | Medical | |||||||
Revenue | Revenue | |||||||
Amount | $ 165,491 | $ 145,796 | Amount | $ 15,887 | $ 16,687 | |||
Growth rate | 14 % | 6 % | Growth rate | (5) % | 8 % | |||
Segment profit 1,2 | Segment profit 3 | |||||||
Amount | $ 1,770 | $ 1,684 | Amount | $ 216 | $ 577 | |||
Growth rate | 5 % | (4) % | Growth rate | (63) % | (13) % | |||
Segment profit margin | 1.07 % | 1.15 % | Segment profit margin | 1.36 % | 3.46 % | |||
The sum of the components and certain computations may reflect rounding adjustments. |
1 Pharmaceutical segment profit includes opioid-related litigation defense and compliance costs, but does not include a one-time contingent attorneys' fee of $18 million incurred during fiscal 2022 related to the finalization of the Settlement Agreement. |
2 Pharmaceutical segment profit during fiscal 2022 was positively impacted by a $16 million judgment for lost profits related to an ordinary course intellectual property rights claim. |
3 Medical segment profit/(loss) for the fourth quarter and year-to-date periods of fiscal 2021 includes a reserve of $197 million to reduce the carrying value of certain personal protective equipment to its net realizable value. |
Schedule 5 | |||||||||||||
Cardinal Health, Inc. and Subsidiaries | |||||||||||||
Earnings/ | |||||||||||||
Gross | Operating | (Loss) | Provision for/ | Net | Diluted | ||||||||
Margin | SG&A2 | Earnings | Before | (Benefit from) | Earnings3 | Effective | EPS 3 | ||||||
(in millions, except per common share amounts) | Gross | Growth | Growth | Operating | Growth | Income | Income | Net | Growth | Tax | Diluted | Growth | |
Margin | Rate | SG&A 2 | Rate | Earnings | Rate | Taxes | Taxes | Earnings 3 | Rate | Rate | EPS 3 | Rate | |
Fourth Quarter 2022 | |||||||||||||
GAAP | $ 1,605 | 9 % | $ 1,155 | 2 % | $ 36 | (78) % | $ (28) | $ (165) | $ 138 | 19 % | 575.3 % | $ 0.50 | 25 % |
Restructuring and employee severance | — | — | 45 | 45 | 13 | 32 | 0.12 | ||||||
Amortization and other acquisition-related costs | — | — | 87 | 87 | 22 | 65 | 0.23 | ||||||
Impairments and (gain)/loss on disposal of assets, net 4 | — | — | 286 | 286 | 226 | 60 | 0.22 | ||||||
Litigation (recoveries)/charges, net | — | — | (4) | (4) | 2 | (6) | (0.02) | ||||||
Non-GAAP | $ 1,605 | 11 % | $ 1,155 | 2 % | $ 450 | 41 % | $ 386 | $ 98 | $ 289 | 27 % | 25.4 % | $ 1.05 | 36 % |
Fourth Quarter 2021 | |||||||||||||
GAAP | $ 1,475 | (7) % | $ 1,129 | (1) % | $ 162 | (40) % | $ 119 | $ 4 | $ 116 | N.M. | 2.6 % | $ 0.40 | N.M. |
Surgical gown recall costs/(income) | (24) | 2 | (26) | (26) | (7) | (19) | (0.06) | ||||||
Restructuring and employee severance | — | — | 33 | 33 | 8 | 25 | 0.08 | ||||||
Amortization and other acquisition-related costs | — | — | 106 | 106 | 32 | 74 | 0.25 | ||||||
Impairments and (gain)/loss on disposal of assets, net | — | — | 1 | 1 | 3 | (2) | (0.02) | ||||||
Litigation (recoveries)/charges, net 5 | — | — | 44 | 44 | 22 | 22 | 0.07 | ||||||
Loss on early extinguishment of debt | — | — | — | 14 | 3 | 11 | 0.04 | ||||||
(Gain)/Loss on sale of equity interest in naviHealth | — | — | — | 2 | 1 | 1 | 0.01 | ||||||
Non-GAAP | $ 1,451 | (8) % | $ 1,132 | (1) % | $ 320 | (28) % | $ 292 | $ 66 | $ 227 | (26) % | 22.6 % | $ 0.77 | (26) % |
1For more information on these measures, refer to the Use of Non-GAAP Measures and Definitions schedules. |
2Distribution, selling, general and administrative expenses. |
3Attributable to Cardinal Health, Inc. |
4Impairments and (gain)/loss on disposals of assets, net includes a pre-tax goodwill impairment charge of $303 million related to our Medical segment recorded in the fourth quarter of fiscal 2022. For the fourth quarter of fiscal 2022, the net tax benefit related to year-to-date impairments is $240 million and is included in the annual effective tax rate. |
5Litigation (recoveries)/charges, net includes a pre-tax charge of $1.17 billion recorded in fiscal 2021 related to the opioid litigation. The amount of tax benefit increased by approximately $50 million during the fourth quarter ended June 30, 2021 compared to the tax impacts that would have been recognized without the opioid litigation charge. The net tax benefit associated with the opioid litigation charges was $228 million for fiscal 2021. |
The sum of the components and certain computations may reflect rounding adjustments. |
We generally apply varying tax rates depending on the item's nature and tax jurisdiction where it is incurred. |
Schedule 5 | |||||||||||||
Cardinal Health, Inc. and Subsidiaries | |||||||||||||
Earnings/ | |||||||||||||
Gross | Operating | (Loss) | Provision for/ | Net | Diluted | ||||||||
Margin | SG&A2 | Operating | Earnings | Before | (Benefit from) | Net | Earnings3 | Effective | EPS 3 | ||||
Gross | Growth | Growth | Earnings/ | Growth | Income | Income | Earnings/ | Growth | Tax | Diluted | Growth | ||
(in millions, except per common share amounts) | Margin | Rate | SG&A 2 | Rate | (Loss) | Rate | Taxes | Taxes | (Loss) 3 | Rate | Rate | EPS 3,4 | Rate |
Fiscal Year 2022 | |||||||||||||
GAAP | $ 6,545 | (3) % | $ 4,557 | 1 % | $ (596) | N.M. | $ (769) | $ 163 | $ (933) | N.M. | (21.2) % | $ (3.35) | N.M. |
Surgical gown recall costs/(income) | 1 | — | 1 | 1 | — | 1 | — | ||||||
Restructuring and employee severance | — | — | 101 | 101 | 26 | 75 | 0.27 | ||||||
Amortization and other acquisition-related costs | — | — | 324 | 324 | 84 | 240 | 0.87 | ||||||
Impairments and (gain)/loss on disposal of assets, net 5 | — | — | 2,050 | 2,050 | 107 | 1,943 | 6.93 | ||||||
Litigation (recoveries)/charges, net 6,7 | — | — | 109 | 109 | 21 | 88 | 0.31 | ||||||
Loss on early extinguishment of debt | — | — | — | 10 | 3 | 7 | 0.03 | ||||||
(Gain)/Loss on sale of equity interest in naviHealth | — | — | — | (2) | — | (2) | — | ||||||
Non-GAAP | $ 6,547 | (3) % | $ 4,557 | 1 % | $ 1,990 | (12) % | $ 1,824 | $ 404 | $ 1,419 | (13) % | 22.1 % | $ 5.06 | (9) % |
Fiscal Year 2021 | |||||||||||||
GAAP | $ 6,778 | (1) % | $ 4,533 | (1) % | $ 472 | N.M. | $ 323 | $ (289) | $ 611 | N.M. | (89.7) % | $ 2.08 | N.M. |
Surgical gown recall costs/(income) | (24) | 4 | (28) | (28) | (7) | (21) | (0.07) | ||||||
State opioid assessment related to prior fiscal years | — | (38) | 38 | 38 | 9 | 29 | 0.10 | ||||||
Restructuring and employee severance | — | — | 114 | 114 | 27 | 87 | 0.29 | ||||||
Amortization and other acquisition-related costs | — | — | 451 | 451 | 118 | 333 | 1.13 | ||||||
Impairments and (gain)/loss on disposal of assets, net | — | — | 79 | 79 | 15 | 64 | 0.21 | ||||||
Litigation (recoveries)/charges, net 8 | — | — | 1,129 | 1,129 | 606 | 523 | 1.78 | ||||||
Loss on early extinguishment of debt | — | — | — | 14 | 3 | 11 | 0.04 | ||||||
(Gain)/Loss on sale of equity interest in naviHealth | — | 2 | 1 | 1 | 0.01 | ||||||||
Non-GAAP | $ 6,754 | (2) % | $ 4,499 | (1) % | $ 2,255 | (5) % | $ 2,122 | $ 483 | $ 1,637 | 2 % | 22.8 % | $ 5.57 | 2 % |
1For more information on these measures, refer to the Use of Non-GAAP Measures and Definitions schedules. |
2Distribution, selling, general and administrative expenses. |
3Attributable to Cardinal Health, Inc. |
4For fiscal 2022, GAAP diluted loss per share attributable to Cardinal Health, Inc. ("GAAP diluted EPS") and the EPS impact from the GAAP to non-GAAP per share reconciling items is calculated using a weighted average of 279 million common shares, which excludes potentially dilutive securities from the denominator due to their anti-dilutive effects resulting from our GAAP net loss for the period. For fiscal 2022, non-GAAP diluted EPS is calculated using a weighted average of 280 million common shares, which includes potentially dilutive shares. |
5 Impairments and (gain)/loss on disposals of assets, net includes pre-tax goodwill impairment charges of $2.1 billion related to our Medical segment recorded in fiscal 2022. For fiscal 2022, the net tax benefit related to these impairments is $150 million and is included in the annual effective tax rate. |
6 Litigation (recoveries)/charges, net for fiscal 2022 does not include a $16 million judgement for lost profits related to an ordinary course intellectual property claim, which positively impacted Pharmaceutical segment profit. |
7 Litigation (recoveries)/charges, net includes a one-time contingent attorneys' fee of $18 million recorded during fiscal 2022 related to the finalization of the Settlement Agreement resulting in the settlement of the vast majority of opioid lawsuits filed by state and local governmental entities. Due to the unique nature and significance of the Settlement Agreement, and the one-time, contingent nature of the fee, this fee was included in litigation (recoveries)/charges, net. |
8 Litigation (recoveries)/charges, net includes a pre-tax charge of $1.17 billion recorded in fiscal 2021 related to the opioid litigation. The net tax benefit associated with the opioid litigation charges was $228 million for fiscal 2021. |
Litigation(recoveries)/charges, net also includes a tax benefit recorded during fiscal 2021 related to a net operating loss carryback. Our wholly-owned insurance subsidiary recorded a self-insurance pre-tax loss in its fiscal 2020 statutory financial statements primarily related to opioid litigation. This self-insurance pre-tax loss, which did not impact our pre-tax consolidated results, was deducted on our fiscal 2020 consolidated federal income tax return and contributed to a significant net operating loss for tax purposes. The net operating loss was carried back and adjusted our taxable income for fiscal 2015, 2016, 2017 and 2018 as permitted under the Coronavirus Aid, Relief and Economic Security ("CARES") Act. The total net benefit was $424 million; however, for purposes of reconciling Non-GAAP financial measures, we allocated $389 million of the benefit to litigation (recoveries)/charges, net, which is excluded from non-GAAP measures, based on the relative amount of the self-insurance pre-tax loss related to opioid litigation claims versus separate tax adjustments. The tax benefit allocated to the separate tax adjustments of $35 million is included in non-GAAP measures. |
The sum of the components and certain computations may reflect rounding adjustments. |
We generally apply varying tax rates depending on the item's nature and tax jurisdiction where it is incurred. |
Schedule 6 | |
Cardinal Health, Inc. and Subsidiaries | |
Fiscal Year | |
(in millions) | 2022 |
GAAP - Cash Flow Categories | |
Net cash provided by operating activities | $ 3,122 |
Net cash provided by investing activities | 567 |
Net cash used in financing activities | (2,463) |
Effect of exchange rates changes on cash and equivalents | (25) |
Cash reclassified from assets held for sale | 109 |
Net increase in cash and equivalents | $ 1,310 |
Non-GAAP Adjusted Free Cash Flow | |
Net cash provided by operating activities | $ 3,122 |
Additions to property and equipment | (387) |
Payments related to matters included in litigation (recoveries)/charges, net | 511 |
Other significant and unusual or non-recurring items | |
U.S. federal tax refund from net operating loss carryback | (966) |
Non-GAAP Adjusted Free Cash Flow | $ 2,280 |
For more information on these measures, refer to the Use of Non-GAAP Measures and Definitions schedules. | |
Cardinal Health, Inc. and Subsidiaries
Use of Non-GAAP Measures
This earnings release contains financial measures that are not calculated in accordance with U.S. generally accepted accounting principles ("GAAP").
In addition to analyzing our business based on financial information prepared in accordance with GAAP, we use these non-GAAP financial measures internally to evaluate our performance, engage in financial and operational planning, and determine incentive compensation because we believe that these measures provide additional perspective on and, in some circumstances are more closely correlated to, the performance of our underlying, ongoing business. We provide these non-GAAP financial measures to investors as supplemental metrics to assist readers in assessing the effects of items and events on our financial and operating results on a year-over-year basis and in comparing our performance to that of our competitors. However, the non-GAAP financial measures that we use may be calculated differently from, and therefore may not be comparable to, similarly titled measures used by other companies. The non-GAAP financial measures disclosed by us should not be considered a substitute for, or superior to, financial measures calculated in accordance with GAAP, and the financial results calculated in accordance with GAAP and reconciliations to those financial statements set forth below should be carefully evaluated.
Exclusions from Non-GAAP Financial Measures
Management believes it is useful to exclude the following items from the non-GAAP measures presented in this report for its own and for investors' assessment of the business for the reasons identified below:
- LIFO charges and credits are excluded because the factors that drive last-in first-out ("LIFO") inventory charges or credits, such as pharmaceutical manufacturer price appreciation or deflation and year-end inventory levels (which can be meaningfully influenced by customer buying behavior immediately preceding our fiscal year-end), are largely out of our control and cannot be accurately predicted. The exclusion of LIFO charges and credits from non-GAAP metrics facilitates comparison of our current financial results to our historical financial results and to our peer group companies' financial results. We did not recognize any LIFO charges or credits during the periods presented.
- Surgical gown recall costs or income includes inventory write-offs and certain remediation and supply disruption costs, net of related insurance recoveries, arising from the January 2020 recall of select Association for the Advancement of Medical Instrumentation ("AAMI") Level 3 surgical gowns and voluntary field actions (a recall of some packs and a corrective action allowing overlabeling of other packs) for Presource Procedure Packs containing affected gowns. Income from surgical gown recall costs represents insurance recoveries of these certain costs. We have excluded these costs from our non-GAAP metrics to allow investors to better understand the underlying operating results of the business and to facilitate comparison of our current financial results to our historical financial results and to our peer group companies' financial results.
- State opioid assessments related to prior fiscal years is the portion of state assessments for prescription opioid medications that were sold or distributed in periods prior to the period in which the expense is incurred. This portion is excluded from non-GAAP financial measures because it is retrospectively applied to sales in prior fiscal years and inclusion would obscure analysis of the current fiscal year results of our underlying, ongoing business. Additionally, while states' laws may require us to make payments on an ongoing basis, the portion of the assessment related to sales in prior periods are contemplated to be one-time, nonrecurring items. Income from state opioid assessments related to prior fiscal years represents reversals of accruals when the underlying assessments were invalidated by a Court or reimbursed by manufacturers.
- Restructuring and employee severance costs are excluded because they are not part of the ongoing operations of our underlying business.
- Amortization and other acquisition-related costs, which include transaction costs, integration costs, and changes in the fair value of contingent consideration obligations, are excluded because they are not part of the ongoing operations of our underlying business and to facilitate comparison of our current financial results to our historical financial results and to our peer group companies' financial results. Additionally, costs for amortization of acquisition-related intangible assets are non-cash amounts, which are variable in amount and frequency and are significantly impacted by the timing and size of acquisitions, so their exclusion facilitates comparison of historical, current and forecasted financial results. We also exclude other acquisition-related costs, which are directly related to an acquisition but do not meet the criteria to be recognized on the acquired entity's initial balance sheet as part of the purchase price allocation. These costs are also significantly impacted by the timing, complexity and size of acquisitions.
- Impairments and gain or loss on disposal of assets are excluded because they do not occur in or reflect the ordinary course of our ongoing business operations and are inherently unpredictable in timing and amount, and in the case of impairments, are non-cash amounts, so their exclusion facilitates comparison of historical, current and forecasted financial results.
- Litigation recoveries or charges, net are excluded because they often relate to events that may have occurred in prior or multiple periods, do not occur in or reflect the ordinary course of our business and are inherently unpredictable in timing and amount. During fiscal 2022, we incurred a one-time contingent attorneys' fee of $18 million related to the finalization of the Settlement Agreement resulting in the settlement of the vast majority of opioid lawsuits filed by state and local governmental entities. Due to the unique nature and significance of the Settlement Agreement, and the one-time, contingent nature of the fee, this fee was included in litigation recoveries or charges, net. Additionally, during fiscal 2022 our Pharmaceutical segment profit was positively impacted by a $16 million judgment for lost profits. This judgment was the result of an ordinary course intellectual property rights claim and, therefore, is not adjusted in calculating the litigation recoveries or charges, net adjustment. During fiscal 2021, we incurred a tax benefit related to a carryback of a net operating loss. Some pre-tax amounts, which contributed to this loss, relate to litigation charges. As a result, we allocated substantially all of the tax benefit to litigation charges.
- Loss on early extinguishment of debt is excluded because it does not typically occur in the normal course of business and may obscure analysis of trends and financial performance. Additionally, the amount and frequency of this type of charge is not consistent and is significantly impacted by the timing and size of debt extinguishment transactions.
- (Gain)/Loss on sale of equity interest in naviHealth was incurred in connection with the sale of our remaining equity interest in naviHealth in fiscal 2020. The equity interest was retained in connection with the initial sale of our majority interest in naviHealth during fiscal 2019. We exclude this significant gain because gains or losses on investments of this magnitude do not typically occur in the normal course of business and are similar in nature to a gain or loss from a divestiture of a majority interest, which we exclude from non-GAAP results. The gain on the initial sale of our majority interest in naviHealth in fiscal 2019 was also excluded from our non-GAAP measures.
The tax effect for each of the items listed above is determined using the tax rate and other tax attributes applicable to the item and the jurisdiction(s) in which the item is recorded. The gross, tax and net impact of each item are presented with our GAAP to non-GAAP reconciliations.
Non-GAAP adjusted free cash flow: We provide this non-GAAP financial measure as a supplemental metric to assist readers in assessing the effects of items and events on our cash flow on a year-over-year basis and in comparing our performance to that of our peer group companies. In calculating this non-GAAP metric, certain items are excluded from net cash provided by operating activities because they relate to significant and unusual or non-recurring events and are inherently unpredictable in timing and amount. We believe adjusted free cash flow is important to management and useful to investors as a supplemental measure as it indicates the cash flow available for working capital needs, debt repayments, dividend payments, share repurchases, strategic acquisitions, or other strategic uses of cash. A reconciliation of our GAAP financial results to Non-GAAP adjusted free cash flow is provided in Schedule 6 of the financial statement tables included with this release.
Forward Looking Non-GAAP Measures
In this document, the Company presents certain forward-looking non-GAAP metrics. The Company does not provide outlook on a GAAP basis because the items that the Company excludes from GAAP to calculate the comparable non-GAAP measure can be dependent on future events that are less capable of being controlled or reliably predicted by management and are not part of the Company's routine operating activities. Additionally, management does not forecast many of the excluded items for internal use and therefore cannot create or rely on outlook done on a GAAP basis.
The occurrence, timing and amount of any of the items excluded from GAAP to calculate non-GAAP could significantly impact the Company's fiscal 2022 GAAP results. Over the past five fiscal years, the excluded items have impacted the Company's EPS from $0.75 to $18.06, which includes a $17.54 charge related to the opioid litigation we recognized in fiscal 2020. The excluded items for fiscal 2022 year to date period impacted the Company's EPS by $8.41.
Definitions
Growth rate calculation: growth rates in this report are determined by dividing the difference between current-period results and prior-period results by prior-period results.
Interest and Other, net: other(income)/expense, net plus interest expense, net.
Segment Profit: segment revenue minus (segment cost of products sold and segment distribution, selling, general and administrative expenses).
Segment Profit margin: segment profit divided by segment revenue.
Non-GAAP gross margin: gross margin, excluding LIFO charges/(credits) and surgical gown recall costs/(income).
Non-GAAP distribution, selling, general and administrative expenses or Non-GAAP SG&A: distribution, selling, general and administrative expenses, excluding surgical gown recall costs/(income) and state opioid assessment related to prior fiscal years.
Non-GAAP operating earnings: operating earnings/(loss) excluding (1) LIFO charges/(credits), (2) surgical gown recall costs/(income), (3) state opioid assessment related to prior fiscal years, (4) restructuring and employee severance, (5) amortization and other acquisition-related costs, (6) impairments and (gain)/loss on disposal of assets, and (7) litigation (recoveries)/charges, net.
Non-GAAP earnings before income taxes: earnings/(loss) before income taxes excluding (1) LIFO charges/(credits), (2) surgical gown recall costs/(income), (3) state opioid assessment related to prior fiscal years, (4) restructuring and employee severance, (5) amortization and other acquisition-related costs, (6) impairments and (gain)/loss on disposal of assets, (7) litigation (recoveries)/charges, net, (8) loss on early extinguishment of debt and (9) (gain)/loss on sale of equity interest in naviHealth.
Non-GAAP net earnings attributable to Cardinal Health, Inc.: net earnings/(loss) attributable to Cardinal Health, Inc. excluding (1) LIFO charges/(credits), (2) surgical gown recall costs/(income), (3) state opioid assessment related to prior fiscal years, (4) restructuring and employee severance, (5) amortization and other acquisition-related costs, (6) impairments and (gain)/loss on disposal of assets, (7) litigation (recoveries)/charges, net, (8) loss on early extinguishment of debt and (9) (gain)/loss on sale of equity interest in naviHealth, each net of tax.
Non-GAAP effective tax rate: provision for/(benefit from) income taxes adjusted for (1) LIFO charges/(credits), (2) surgical gown recall costs/(income), (3) state opioid assessment related to prior fiscal years, (4) restructuring and employee severance, (5) amortization and other acquisition-related costs, (6) impairments and (gain)/loss on disposal of assets, (7) litigation (recoveries)/charges, net, (8) loss on early extinguishment of debt and (9) (gain)/loss on sale of equity interest in naviHealth, each net of tax, divided by (earnings/(loss) before income taxes adjusted for the first nine items).
Non-GAAP diluted earnings per share attributable to Cardinal Health, Inc.: non-GAAP net earnings attributable to Cardinal Health, Inc. divided by diluted weighted-average shares outstanding.
Non-GAAP adjusted free cash flow: net cash provided by operating activities less payments related to additions to property and equipment, excluding settlement payments and receipts related to matters included in litigation (recoveries)/charges, net, as defined above, or other significant and unusual or non-recurring cash payments or receipts. For example, the U.S. federal income tax refund of $966 million for the tax benefit from the net operating loss carryback related to a self-insurance pre-tax loss was excluded from the Company's fiscal 2022 non-GAAP adjusted free cash flow.
View original content to download multimedia:https://www.prnewswire.com/news-releases/cardinal-health-reports-fourth-quarter-and-full-year-results-for-fiscal-year-2022-301604223.html
SOURCE Cardinal Health
Spread & Containment
There Goes The Fed’s Inflation Target: Goldman Sees Terminal Rate 100bps Higher At 3.5%
There Goes The Fed’s Inflation Target: Goldman Sees Terminal Rate 100bps Higher At 3.5%
Two years ago, we first said that it’s only a matter…
Share this:

Two years ago, we first said that it's only a matter of time before the Fed admits it is unable to rsolve the so-called "last mile" of inflation and that as a result, the old inflation target of 2% is no longer viable.
At some point Fed will concede it has no control over supply. That's when we will start getting leaks of raising the inflation target
— zerohedge (@zerohedge) June 21, 2022
Then one year ago, we correctly said that while everyone was paying attention elsewhere, the inflation target had already been hiked to 2.8%... on the way to even more increases.
The new inflation target has been set to 2.8%. The rest is just narrative fill for the next 2 years. https://t.co/X1xYkecyPy
— zerohedge (@zerohedge) February 21, 2023
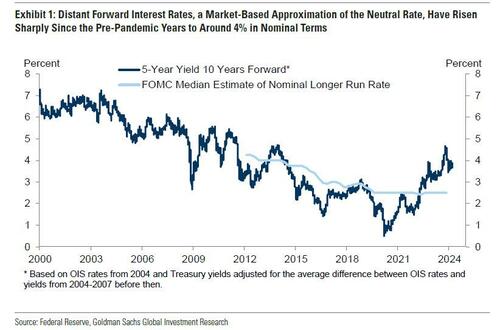
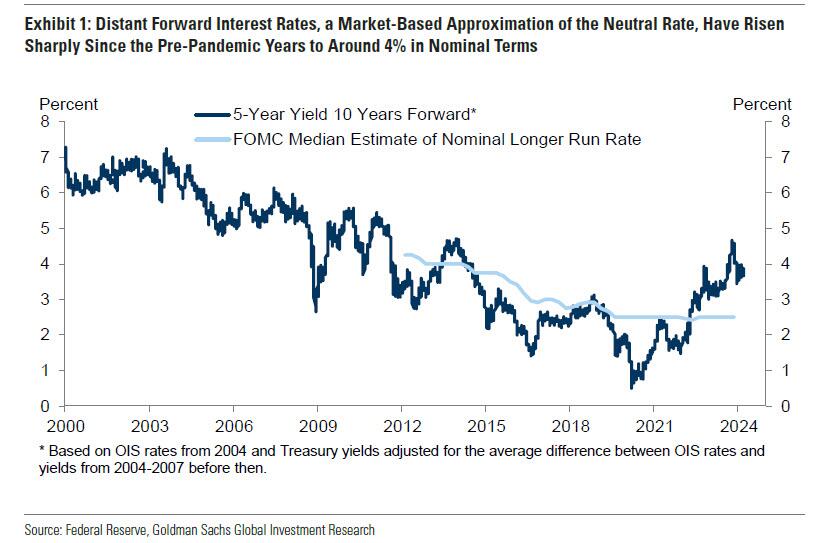
And while the Fed still pretends it can one day lower inflation to 2% even as it prepares to cut rates as soon as June, moments ago Goldman published a note from its economics team which had to balls to finally call a spade a spade, and concluded that - as party of the Fed's next big debate, i.e., rethinking the Neutral rate - both the neutral and terminal rate, a polite euphemism for the inflation target, are much higher than conventional wisdom believes, and that as a result Goldman is "penciling in a terminal rate of 3.25-3.5% this cycle, 100bp above the peak reached last cycle."
There is more in the full Goldman note, but below we excerpt the key fragments:
We argued last cycle that the long-run neutral rate was not as low as widely thought, perhaps closer to 3-3.5% in nominal terms than to 2-2.5%. We have also argued this cycle that the short-run neutral rate could be higher still because the fiscal deficit is much larger than usual—in fact, estimates of the elasticity of the neutral rate to the deficit suggest that the wider deficit might boost the short-term neutral rate by 1-1.5%. Fed economists have also offered another reason why the short-term neutral rate might be elevated, namely that broad financial conditions have not tightened commensurately with the rise in the funds rate, limiting transmission to the economy.
Over the coming year, Fed officials are likely to debate whether the neutral rate is still as low as they assumed last cycle and as the dot plot implies....
...Translation: raising the neutral rate estimate is also the first step to admitting that the traditional 2% inflation target is higher than previously expected. And once the Fed officially crosses that particular Rubicon, all bets are off.
... Their thinking is likely to be influenced by distant forward market rates, which have risen 1-2pp since the pre-pandemic years to about 4%; by model-based estimates of neutral, whose earlier real-time values have been revised up by roughly 0.5pp on average to about 3.5% nominal and whose latest values are little changed; and by their perception of how well the economy is performing at the current level of the funds rate.
The bank's conclusion:
We expect Fed officials to raise their estimates of neutral over time both by raising their long-run neutral rate dots somewhat and by concluding that short-run neutral is currently higher than long-run neutral. While we are fairly confident that Fed officials will not be comfortable leaving the funds rate above 5% indefinitely once inflation approaches 2% and that they will not go all the way back to 2.5% purely in the name of normalization, we are quite uncertain about where in between they will ultimately land.
Because the economy is not sensitive enough to small changes in the funds rate to make it glaringly obvious when neutral has been reached, the terminal or equilibrium rate where the FOMC decides to leave the funds rate is partly a matter of the true neutral rate and partly a matter of the perceived neutral rate. For now, we are penciling in a terminal rate of 3.25-3.5% this cycle, 100bps above the peak reached last cycle. This reflects both our view that neutral is higher than Fed officials think and our expectation that their thinking will evolve.
Not that this should come as a surprise: as a reminder, with the US now $35.5 trillion in debt and rising by $1 trillion every 100 days, we are fast approaching the Minsky Moment, which means the US has just a handful of options left: losing the reserve currency status, QEing the deficit and every new dollar in debt, or - the only viable alternative - inflating it all away. The only question we had before is when do "serious" economists make the same admission.
Meanwhile, nothing changes: total US debt jumps $57BN on March 15, to a record $34.543 trillion.
— zerohedge (@zerohedge) March 19, 2024
Three ways this ends: inflate it away, QE it all, or reserve status collapse
They now have.
And while we have discussed the staggering consequences of raising the inflation target by just 1% from 2% to 3% on everything from markets, to economic growth (instead of doubling every 35 years at 2% inflation target, prices would double every 23 years at 3%), and social cohesion, we will soon rerun the analysis again as the implications are profound. For now all you need to know is that with the US about to implicitly hit the overdrive of dollar devaluation, anything that is non-fiat will be much more preferable over fiat alternatives.
Much more in the full Goldman note available to pro subs in the usual place.
Spread & Containment
Household Net Interest Income Falls As Rates Spike
A Bloomberg article from this morning offered an excellent array of charts detailing the shifts in interest payment flows amid rising rates. The historical…
Share this:

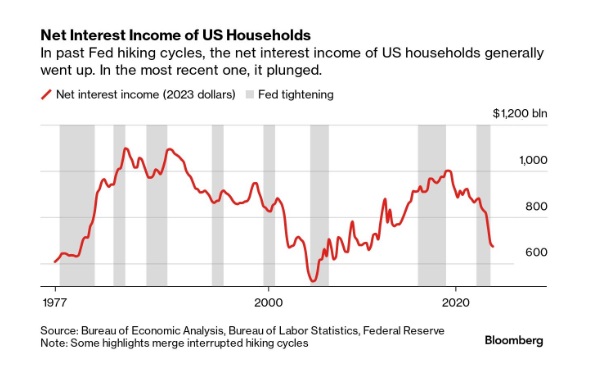
A Bloomberg article from this morning offered an excellent array of charts detailing the shifts in interest payment flows amid rising rates. The historical anomaly was both surprising and contradicted our priors.
10 Key Points:
- Historical Anomaly: This is the first time in the last fifty years that a Federal Reserve rate hike cycle has led to a significant drop in household net interest income.
- Interest Expense Increase: Since the Fed began raising rates in March 2022, Americans’ annual interest expenses on debts like mortgages and credit cards have surged by nearly $420 billion.
- Interest Income Lag: The increase in interest income during the same period was only about $280 billion, resulting in a net decline in household interest income, a departure from past trends.
- Consumer Debt Influence: The recent rate hikes impacted household finances more because of a higher proportion of consumer credit, which adjusts more quickly to rate changes, increasing interest costs.
- Banks and Savers: Banks have been slow to pass on higher interest rates to depositors, and the prolonged period of low rates before 2022 may have discouraged savers from actively seeking better returns.
- Shift in Wealth: There’s been a shift from interest-bearing assets to stocks, with dividends surpassing interest payments as a source of unearned income during the pandemic.
- Distributional Discrepancy: Higher interest rates benefit wealthier individuals who own interest-earning assets, whereas lower-income earners face the brunt of increased debt servicing costs, exacerbating economic inequality.
- Job Market Impact: Typically, Fed rate hikes affect households through the job market, as businesses cut costs, potentially leading to layoffs or wage suppression, though this hasn’t occurred yet in the current cycle.
- Economic Impact: The distribution of interest income and debt servicing means that rate increases transfer money from those more likely to spend (and thus stimulate the economy) to those less likely to increase consumption, potentially dampening economic activity.
- No Immediate Relief: Expectations for the Fed to reduce rates have diminished, indicating that high-interest expenses for households may persist.


Uncategorized
One more airline cracks down on lounge crowding in a way you won’t like
Qantas Airways is increasing the price of accessing its network of lounges by as much as 17%.
Share this:


Over the last two years, multiple airlines have dealt with crowding in their lounges. While they are designed as a luxury experience for a small subset of travelers, high numbers of people taking a trip post-pandemic as well as the different ways they are able to gain access through status or certain credit cards made it difficult for some airlines to keep up with keeping foods stocked, common areas clean and having enough staff to serve bar drinks at the rate that customers expect them.
In the fall of 2023, Delta Air Lines (DAL) caught serious traveler outcry after announcing that it was cracking down on crowding by raising how much one needs to spend for lounge access and limiting the number of times one can enter those lounges.
Related: Competitors pushed Delta to backtrack on its lounge and loyalty program changes
Some airlines saw the outcry with Delta as their chance to reassure customers that they would not raise their fees while others waited for the storm to pass to quietly implement their own increases.
Shutterstock
This is how much more you'll have to pay for Qantas lounge access
Australia's flagship carrier Qantas Airways (QUBSF) is the latest airline to announce that it would raise the cost accessing the 24 lounges across the country as well as the 600 international lounges available at airports across the world through partner airlines.
More Travel:
- A new travel term is taking over the internet (and reaching airlines and hotels)
- The 10 best airline stocks to buy now
- Airlines see a new kind of traveler at the front of the plane
Unlike other airlines which grant access primarily after reaching frequent flyer status, Qantas also sells it through a membership — starting from April 18, 2024, prices will rise from $600 Australian dollars ($392 USD) to $699 AUD ($456 USD) for one year, $1,100 ($718 USD) to $1,299 ($848 USD) for two years and $2,000 AUD ($1,304) to lock in the rate for four years.
Those signing up for lounge access for the first time also currently pay a joining fee of $99 AUD ($65 USD) that will rise to $129 AUD ($85 USD).
The airline also allows customers to purchase their membership with Qantas Points they collect through frequent travel; the membership fees are also being raised by the equivalent amount in points in what adds up to as much as 17% — from 308,000 to 399,900 to lock in access for four years.
Airline says hikes will 'cover cost increases passed on from suppliers'
"This is the first time the Qantas Club membership fees have increased in seven years and will help cover cost increases passed on from a range of suppliers over that time," a Qantas spokesperson confirmed to Simple Flying. "This follows a reduction in the membership fees for several years during the pandemic."
The spokesperson said the gains from the increases will go both towards making up for inflation-related costs and keeping existing lounges looking modern by updating features like furniture and décor.
While the price increases also do not apply for those who earned lounge access through frequent flyer status or change what it takes to earn that status, Qantas is also introducing even steeper increases for those renewing a membership or adding additional features such as spouse and partner memberships.
In some cases, the cost of these features will nearly double from what members are paying now.
stocks pandemic

Google’s A.I. Fiasco Exposes Deeper Infowarp


Home buyers must now navigate higher mortgage rates and prices


Supreme Court Rules Public Officials May Block Their Constituents On Social Media


Greenback Surges after BOJ Hikes and Ends YCC and RBA Delivers a Dovish Hold


Manufacturing and construction vs. the still-inverted yield curve


Student loan borrowers may finally get answers to loan forgiveness issues


When words make you sick


Germany Is Running Out Of Money And Debt Levels Are Exploding, Finance Minister Warns


TikTok Ban Obscures Chinese Stock Gold Rush


You can strike gold and silver investment opportunities at Costco
-

 Spread & Containment6 days ago
IFM’s Hat Trick and Reflections On Option-To-Buy M&A
-

 Uncategorized4 weeks ago
All Of The Elements Are In Place For An Economic Crisis Of Staggering Proportions
-

 International2 weeks ago
EyePoint poaches medical chief from Apellis; Sandoz CFO, longtime BioNTech exec to retire
-

 Uncategorized1 month ago
California Counties Could Be Forced To Pay $300 Million To Cover COVID-Era Program
-

 Uncategorized4 weeks ago
Apparel Retailer Express Moving Toward Bankruptcy
-

 Uncategorized1 month ago
Industrial Production Decreased 0.1% in January
-

 International2 weeks ago
Walmart launches clever answer to Target’s new membership program
-

 Uncategorized1 month ago
RFK Jr: The Wuhan Cover-Up & The Rise Of The Biowarfare-Industrial Complex