Uncategorized
Bitcoin Price History: 2009 – 2023
Bitcoin’s past performance can help you understand where its value is heading. Here’s bitcoin’s price history delineated since its inception.
Share this:

Bitcoin’s past performance can help you understand where its value is heading. Here’s bitcoin’s price history delineated since its inception.
Introduction
How many times has bitcoin been declared dead? At least 463 times. And it’s never been because of its monetary system failing or its technical operation breaking down, but because of its price crashing.
Some may argue that those two things — tech development and price actions — are inherently connected, but that’s not the case.
Price swings in bitcoin are mainly driven by its own halving cycles as well as macroeconomic events. Since it roared into life from humble beginnings, bitcoin has had a turbulent history. Its infamous volatility has resulted in multiple appreciations of 1,000% in value, only to later drop by as much as 80% or even 90% — such as in 2014.
Every single time, though, it has bounced back, recovered its previous highs and gone on to set new ones. This resilience has proven some of the most seasoned investors wrong and won new supporters along the way.
In this article, we take you through bitcoin’s price history in detail, year after year, around the critical events that shaped it as an innovative monetary system.
Price History
Bitcoin was created in 2008 to challenge the existing system of centralized, credit-based money issued by bureaucrats and unstable banks. By trusting code instead of human vulnerabilities, bitcoin offered a way out of that debacle.
At first the new invention was nothing more than an experiment, but those who read the white paper and were knowledgeable of cryptography, money and finance, could already see it turning into something much bigger than a simple cryptographic toy.
For the first year, bitcoin didn’t have a market price; it had no premine or any rounds of investment from big venture capital firms. Something changed in 2010 when it started to be traded for goods and services which would set it on the path toward today’s innovative and alternative currency system — a journey from $0 in 2009 to $68,000 in only 13 years.
Next, we’ll explore how bitcoin grew from a tech plaything with lofty ambitions to a bona fide monetary asset that’s continuing to deliver on its promise.
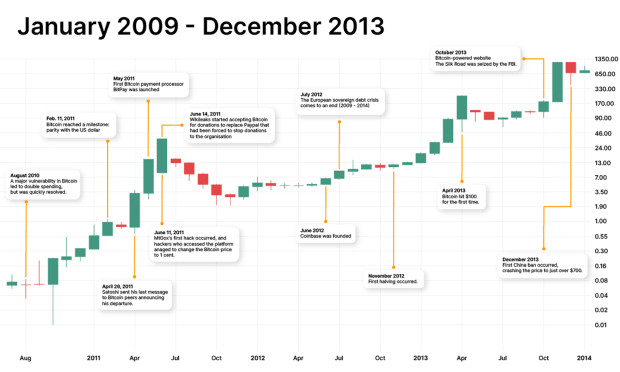
January 2009-December 2013
Bitcoin’s proof-of-concept was emphasized in the white paper published on October 31, 2008, by Satoshi Nakamoto. All through 2009, anyone could join the network by mining blocks of Bitcoin with their computers’ CPUs without much effort. All things considered, the price was still $0.
2009: Genesis
Price Range $0-$.0009
Satoshi mined the genesis block with the famous text note and headline from the London Times, “Chancellor on Brink of Second Bailout for Banks” — a clear reference to the 2008-2009 financial crisis.

The block reward was 50 bitcoin and people were mining thousands of bitcoin every day. The New Liberty Standard Exchange recorded the first exchange of bitcoin for dollars in late 2009, though people were mostly trading bitcoin over the BitcoinTalk forum.
The European sovereign debt crisis began in November when Greece revealed that its budget deficit was nearly double the prior estimates. While this event was too early in Bitcoin’s history to affect the price in any meaningful way, indebted sovereigns would continue to be a worry in the legacy monetary system against which bitcoin compared itself.
On October 12th, 2009 a member of the BitcoinTalk forum traded 5050 BTC for a sum of $5.02 via Paypal, which implies a price of $0.00099 per coin and one of the lowest prices per BTC ever recorded. This transaction kicked off a series of OTC purchases in the succeeding months.
2010: Bitcoin Begins Trading
Price Range $.00099-$0.4
On the 20th of February, a person on reddit using the username theymos claims to have sold 160 BTC for $.003, which would make it the lowest ever price recorded.
On May 22, Laszlo Hanyecz bought two pizzas for 10,000 bitcoin which is held as an iconic first exchange of bitcoin for a real-world product; Bitcoin Pizza Day was born.
The first large-scale bitcoin exchange, Mt. Gox, made its appearance on July 18.
In August, the most significant vulnerability in the history of the Bitcoin network was exploited when an attacker managed to spend billions of bitcoin they did not own. The bug was spotted and fixed within hours, and miners had to fork the network and release a new, updated Bitcoin protocol without the malicious transaction included.
2011: Dollar Parity
Price Range $0.4-$4.70
Bitcoin achieved a milestone in February when it reached parity with the U.S. dollar for the first time. On April 26, 2011, Satoshi Nakamoto sent his final email to fellow developers stating he had “moved on to other projects” — and was never heard from again.
Bitcoin payment processor BitPay was founded in May to allow companies to accept bitcoin as a form of payment. By June, the price of one bitcoin had reached $30 but slowly dropped back to the $2-$4 range that it sustained for the rest of the year.
Nonprofits like the Electronic Frontier Foundation and WikiLeaks began taking bitcoin in donations, the latter turning to bitcoin after PayPal had frozen WikiLeaks’ accounts in December 2010.
In June of 2011, Mt. Gox experienced its first hack in which hackers managed to access the company auditors’ computer and change the price of bitcoin to 1 cent.
2012: European Debt Crisis
Price Range: $4-$13.50
The beginning of 2012 was still marked by the European sovereign debt crisis, with some member states becoming highly dependent on the European Central Bank and the International Monetary Fund to service their debts. Cyprus was particularly hard hit, with incremental demand for bitcoin coming from the areas most affected by the Cypriot financial crisis.
Coinbase was founded in June 2012, offering a new way to buy and sell cryptocurrencies.
On the 9th of August, a Mt. Gox glitch caused bitcoin to be priced at $1B a piece on the exchange. 11 days later on the 20th of August, the price tumbled 50% from $15.28 to $7.60 as news of a dubious Bitcoin savings and trust fund scheme offering a 7% weekly interest rate was closed. The operator of the fund, Trendon Shavers would later be sentenced in the first Bitcoin securities-fraud case.
Bitcoin spent the remainder of the year consolidating, and in November it went through its first Halving. The price at the end of the year was $13.50.
2013: The Silk Road Seizure
Price Range: $13-$755
Bitcoin experienced its first post-halving bull run. The year started with a price of just above $13, rallying to $26 over the course of a month. The rally continued in April and quickly rose to $268, before crashing 80% to $51 from the 10th to the 13th of the same month.
In June Mt. Gox stopped processing US withdrawals and by July, the price had retraced back to $68.50. It continued to trade at just above $100 when Silk Road was seized by the FBI in October.
On the 12th of August, the German regulators officially declared Bitcoin a unit of account.
By December, it had spiked to a new all-time high of $1,163, rising 840% in 8 weeks and then fell back to $687 only days later. In December, the People’s Bank of China (PBOC) prohibited Chinese financial institutions from using bitcoin, resulting in a drop to just above $700. It wouldn’t be the last time China “banned” bitcoin.
January 2014-December 2017

This period is identified by the advent of altcoins and the injection of big funds into the cryptocurrency market, components of the ICO mania of 2017. Bitcoin went from just over $800 in 2014 to trading at close to $20,000 in 2017.
With big money came greater attention from the media and financial institutions, and governments started to observe Bitcoin and its phenomena more closely — sometimes putting pressure on the market through strict regulations, especially in China.
2014: Mt. Gox Is Hacked
Price Range: $767-$321
Bitcoin’s infamous volatility was very high in 2014. The year started with a price recovery to above $1,000, but by the end of February, it had already retraced back to under $600 with a flash crash down to $111 (a 90% drop from its $1,000 high!) due to troubles at Mt. Gox. — the hack involved user funds of around 750,000 bitcoin. The exchange had to file for bankruptcy following the episode.
The PBOC instructed domestic lenders to close the accounts of Chinese bitcoin exchanges by April 15.
Bitcoin spent the turbulent rest of the year recovering and crashing shortly thereafter and closed 2014 at just over $300.
In December, the first Bitcoin hard fork, Bitcoin XT, was released by Mike Hearn, who aimed to increase maximum transactions per second from 7 to 24. Such an increase meant the block size had to be expanded from one megabyte to eight megabytes.
2015: The Beginning Of The Blocksize Wars
Price Range: $314-$431
On January 4, Bitstamp suffered a serious security breach, losing approximately 19,000 BTC, with a market value of about $5.1m at the time.
Bitcoin started the new year at $314 and kept on relatively quiet compared to 2014, with little volatility and more consolidation. Ethereum was launched on July 30, and its platform triggered the creation of thousands of new cryptocurrencies eager to compete with Bitcoin in the years to come.
On June 22, 2015, Gavin Andresen published BIP 101 which called for an increase to the block size. The Blocksize Wars continued in August with Gavin Andresen and Mike Hearn proposing to increase the block size limit to 20 MB.
In September, the U.S. Commodities Futures Trading Commission (CFTC) defined bitcoin as a commodity. In contrast, the EU decided against imposing value added tax (VAT) on crypto transactions in October. This effectively defined bitcoin as a currency.
2016: Price Recovery
Price Range: $434-$966
The second Bitcoin Halving occurred on July 9, and throughout the year the price of bitcoin was relatively stable, trading between $350 and $700 in the summer months, only to hit $966 at the end of the year.
2016 was marked by the hack of the bitcoin exchange Bitfinex in August, which resulted in nearly 120,000 BTC stolen from users.
2017: Crypto and ICO Mania
Price Range: $998-$14,245
Like 2013, the year that followed the first Bitcoin Halving, 2017 was also historic for bitcoin. In the beginning of the year, the price hovered around $1,000, broke $2,000 in mid-May and skyrocketed to $19,892 on December 15, recording a 20x rise in less than 12 months.

The chart above refers to bitcoin’s dominance in the cryptocurrency market. With the creation of thousands of new cryptocurrencies, and the explosion of the ICO mania, bitcoin’s dominance fell dramatically, as investor funds and gambling money made their way from bitcoin into the altcoin markets.
The ICO mania signaled that venture capital firms had arrived and thousands of crypto projects began to get funding, turning the crypto market into a casino of sorts. Incidentally, the misinformation and FUD around Bitcoin increased around this time.
On August 2, a major bitcoin exchange, Bitfinex, was hacked and nearly 120,000 BTC (around $60m at the time) was stolen by hackers. The bitcoin price immediately tumbled 14% to $214 in a period of just 30 minutes, before it rebounded upwards the very same day — a typical flash crash.
In August, a major upgrade — SegWit — was implemented on the Bitcoin network, which brought some relief to Bitcoin’s scalability issue and enabled the implementation of the Lightning Network.
After breaking $5,000 in the beginning of September, news that China wanted to crack down on bitcoin and cryptocurrencies crashed the price down to the $3,600 range. By October, the cryptocurrency had already recovered to $5,000, and the following epic surge to $20,000 awaited.
Bitcoin futures contracts were first introduced in December, trading on the Chicago Mercantile Exchange (CME).
2017 was the year everyone took notice of bitcoin, from institutional and retail investors to governments and economists. They all started their own battle to back or oppose Bitcoin.
January 2018-November 2021

After the previous era of failed ICOs, the altcoin market tried other ways to raise capital, including STOs (“security token offering”) and IEOs (“initial exchange offering”) — all with poor results. In the meantime, Bitcoin was preparing for a series of technological advances that would benefit its scalability and security, culminating in the Taproot implementation in November 2021.
This was the Covid era, when the world and its economy shut down for nearly two years, bringing dramatic consequences to financial markets and bitcoin. Yet, this was also the era when bitcoin hit the current all-time high of over $69,000 — against all odds.
2018: Bear Territory
Price Range: $14,093-$3,809
After the bullish action at the end of 2017, bitcoin spent 2018 in bear territory, and by the end of the first quarter, its price had already retraced almost 50% from January’s value.
In January, Chinese authorities ordered the closing of mining operations. The notice called for an “orderly exit” without setting a deadline.
On the 18th of June, Facebook announce their cryptocurrency project, Libra. The announcement prompted a swift reaction from government regulators worldwide. The announcement didn’t impact the price of bitcoin too much.
For most of the year, bitcoin traded within the $6,000 and $8,000 range, hitting a bottom of $3,250 in December and closing the year at just over $3,700, down 73% from the beginning of the year.
2019: Leaving The Bear Behind
Price Range: $3,692-$7,240
Bitcoin mainly moved sideways during 2019, with a significant spike in June when positive news about institutional investors and wider adoption of cryptocurrencies converged and triggered a positive move upwards.
Bakkt, the long awaited and much hyped futures contracts was released on the 22nd of September.
For the rest of the year, bitcoin price hovered around the $7,000 mark, ending 2019 at just over $7,200.
2020: Covid Surge
Price Range: $7,194-$28,841
2020 will be remembered as the year of Covid, which affected many aspects of life, including financial markets and bitcoin. When the deadly flu was declared a pandemic in March 2020, markets went into significant turmoil, crashing to price levels that had not been seen since the 2008 economic crisis.
Bitcoin crashed to a low of $4,000 on March 17, as the world witnessed the events unfolding. In May, the third Halving in Bitcoin’s history occurred, and the price slowly recovered, pushing up to over $10,000 again.
MicroStrategy was the first publicly traded company to start accumulating bitcoin in its cash reserves. Micheal Saylor, who had once fiercely opposed Bitcoin, admitted that he did not understand Bitcoin at the time and he had now realized that bitcoin was the world’s only conceivable safe haven and sound money. The company went on to purchase in excess of 130,000 BTC and is showing no signs of stopping.
From the end of August, the series of positive news around bitcoin adoption started to push the price up, as well as the U.S. government’s attempts to help the economy recover by more money printing — bringing the amount of dollars in circulation from 15 to 19 trillion over just a few months. More money printing led many to believe that their dollars were no longer a safe haven, and they started looking at the sound money qualities that bitcoin could offer.
By the end of the year, bitcoin price was back to its previous ATH of $20,000 and surpassed it, closing on December 31 at over $29,000.
2021: From Hope To Despair
Price Range: $29,022-$47,191
After an exciting end to 2020, bitcoin started 2021 with great optimism and had a wild first quarter culminating with the first all-time high of the year in mid-April, at $64,594. Such a bullish movement was likely triggered by claims of continuous liquidity injection in the markets by the Federal Reserve, coupled with news that Elon Musk, Tesla and other businesses had started allocating bitcoin instead of USD in their treasuries. Tesla announced in February that it had acquired $1.5 billion worth of bitcoin — 10% of its treasury — for “more flexibility to further diversify and maximize returns on our cash.”
In May, a new China restriction hit Bitcoin, announcing that financial institutions and payment platforms were prohibited from transacting in cryptocurrencies. Furthermore, all the bitcoin mining plants had to close down. Bitcoin crashed to $32,450 on May 23 and to a new low of $29,970 on July 21. This China ban also had repercussions on the mining industry, with the hash rate dropping significantly in the following months, as miners relocated their ASICs primarily to Russia, Kazakhstan and North America.
In September, renewed optimism followed a series of events, including the hash rate recovery, the news that El Salvador had made bitcoin legal tender and the first futures-based Bitcoin ETF launching in October — which led to the second all-time high for the year at $68,789, on November 10, 2021.
Bitcoin closed out the year by retreating 20% from that all-time high. This decline in bitcoin’s price occurred in conjunction with broader market declines that were triggered by concerns over a new COVID-19 virus variant.
Imminent interest rate hikes, soaring inflation and announcements that the Fed would begin to reduce its bond purchases and slowly drain liquidity from financial markets, were all signs that the world economy was going into recession mode.
January 2022-Present
2022: Liquidity Is Drained and Insolvencies Begin
Price Range: $46,319-$16,537

The world’s economic and financial turmoil continued in 2022, made worse by a new war on Europe’s doorstep, the removal of Russia from global payment systems like Visa and SWIFT, rising interest rates (.75 basis points each month — totaling 4.25% by year-end), Bank of England bailout, rising inflation, gas and energy crisis and a general recession looming over most of the Western world.
Stricter regulations on Bitcoin and cryptocurrencies called for by governments and regulators added extra FUD to the general mood, further distancing investors from riskier assets.
By January, bitcoin had dropped to $35,000 over the surging threat of an imminent Russia-Ukraine war, which promptly erupted at the end of February. By March, bitcoin had recovered to $47,459, but the global geopolitical and economic crisis caused a new and more durable crash down to the $20,000 range, a level that bitcoin kept for months as the economy tried to find relief.
Beginning in March, the Luna Foundation Guard bought bitcoin as a reserve asset intended to support the Terra Network’s algorithmic stablecoin, UST, in case of “volatile market conditions.” The company acquired 80,000 bitcoin in the process, worth nearly $3 billion at the time.
On May 7, there were early signs of a capital flight from UST as $85 million UST was swapped for $84.5 million USDC, causing UST to lose its peg to the dollar in the process. By the 14th, the Luna Foundation Guard had sold all but 313 of their 80,000 bitcoin in an unsuccessful attempt to defend the stablecoin peg. The bitcoin price was severely affected, dropping 44% between May 6 and May 18.
The fall of Terra caused contagion in the market, leading to the collapse of major CeFi firms Celsius, Voyager and hedge fund Three Arrows Capital (3AC). 3AC was unable to meet obligations toward its partners and creditors, and the default on its loans created a domino effect on all parties involved. FTX rescued these companies in an apparent show of strength.
Tesla sold 75% of its bitcoin holdings in Q2 after the fall in value in previous months.
Mining firm Core Scientific also began selling their bitcoin stack in June, bringing the number of BTC held from 9,618 BTC in April to only 24 at the end of the year. Core Scientific’s liquidity problems only emerged in October, and the company raised the possibility of filing for bankruptcy, listing among the reasons for its struggles the financial exposure to Celsius and its affiliates.
Another bitcoin miner, Argo Blockchain, also experienced financial troubles in October, failing to raise $27 million from a strategic investor and its stock losing over 41% of its value on Nasdaq.
In September, Ethereum differentiated itself further from Bitcoin by switching to proof-of-stake.
At first, November provided respite for the bitcoin price — until Coindesk published a revealing article on Almeda’s balance sheet and the collapse of FTX began. A few days later, Binance’s Chengpeng Zhao (CZ) ignited an exchange war by tweeting his intention to sell $2.1 billion USD equivalent in cash (BUSD and FTT), which triggered a 27% crash over the course of the following two days.
With rumors circulating wildly about Grayscale’s insolvency, Grayscale was forced to release a statement on the 18th declaring that their coins were safe with Coinbase. The markets remained on tenterhooks, and so on the 21st, bitcoin reached a new low of $15,477 as rumors of Genesis insolvency continued.
Bitcoin closed the year at $16,537, down 64% from 12 months earlier.
2023: Price Recovery
Price Range: $16,537 -
With the new year came some fresh optimism as investors began to believe the U.S. Federal Reserve’s interest rate increases would slow down. The bitcoin price broke out on January 10, increasing 24% over the course of four days.
On January 21, Casey Rodomor launched Ordinals, which enabled on-chain Bitcoin native digital artifacts. The price increased 45% in January, closing out the month at $23,150 and showing signs of a strong recovery from a difficult bear market.
FAQs
How much was bitcoin when it first came out?
Bitcoin didn’t have a price when it was first introduced into the world. For several years, there were no exchanges where users could trade it for fiat money and it was only possible to accumulate bitcoin through mining — or buying it peer-to-peer from someone who had mined it.
What is bitcoin’s highest-ever price?
Bitcoin’s highest-ever price is $68,789, reached on November 10, 2021.
Is now a good time to buy bitcoin?
The best time to buy bitcoin depends on the investor’s situation; however, when the price is low, it is cheaper to accumulate more. This article explores bitcoin’s price patterns and the macro environment around it, which should make it easier for investors to more conveniently identify when it’s the best time to buy or sell bitcoin.
Conclusion
It should be clear by now that bitcoin is an asset like no other. Its ecosystem tends to operate on four-year cycles, while its price may be defined by factors relating to monetary policy, such as the implementation of quantitative easing or quantitative tightening policies.
In just 14 years, bitcoin’s incredible growth has established it as a new asset class everyone started to pay attention to.
Bitcoin Magazine provides a lot of help for those who’d like to do their homework to better learn about bitcoin’s price movements and how to make informed investment decisions.
Consider education as a tool to understand why Bitcoin has gone so far in just over a decade, and you may be able to shift to a longer-term vision beyond its day-to-day volatility.
nasdaq pandemic covid-19 cryptocurrency bitcoin ethereum blockchain crypto btc etf otc crypto commoditiesUncategorized
February Employment Situation
By Paul Gomme and Peter Rupert The establishment data from the BLS showed a 275,000 increase in payroll employment for February, outpacing the 230,000…
Share this:


By Paul Gomme and Peter Rupert
The establishment data from the BLS showed a 275,000 increase in payroll employment for February, outpacing the 230,000 average over the previous 12 months. The payroll data for January and December were revised down by a total of 167,000. The private sector added 223,000 new jobs, the largest gain since May of last year.

Temporary help services employment continues a steep decline after a sharp post-pandemic rise.


Average hours of work increased from 34.2 to 34.3. The increase, along with the 223,000 private employment increase led to a hefty increase in total hours of 5.6% at an annualized rate, also the largest increase since May of last year.

The establishment report, once again, beat “expectations;” the WSJ survey of economists was 198,000. Other than the downward revisions, mentioned above, another bit of negative news was a smallish increase in wage growth, from $34.52 to $34.57.

The household survey shows that the labor force increased 150,000, a drop in employment of 184,000 and an increase in the number of unemployed persons of 334,000. The labor force participation rate held steady at 62.5, the employment to population ratio decreased from 60.2 to 60.1 and the unemployment rate increased from 3.66 to 3.86. Remember that the unemployment rate is the number of unemployed relative to the labor force (the number employed plus the number unemployed). Consequently, the unemployment rate can go up if the number of unemployed rises holding fixed the labor force, or if the labor force shrinks holding the number unemployed unchanged. An increase in the unemployment rate is not necessarily a bad thing: it may reflect a strong labor market drawing “marginally attached” individuals from outside the labor force. Indeed, there was a 96,000 decline in those workers.


Earlier in the week, the BLS announced JOLTS (Job Openings and Labor Turnover Survey) data for January. There isn’t much to report here as the job openings changed little at 8.9 million, the number of hires and total separations were little changed at 5.7 million and 5.3 million, respectively.

As has been the case for the last couple of years, the number of job openings remains higher than the number of unemployed persons.

Also earlier in the week the BLS announced that productivity increased 3.2% in the 4th quarter with output rising 3.5% and hours of work rising 0.3%.

The bottom line is that the labor market continues its surprisingly (to some) strong performance, once again proving stronger than many had expected. This strength makes it difficult to justify any interest rate cuts soon, particularly given the recent inflation spike.
unemployment pandemic unemploymentUncategorized
Mortgage rates fall as labor market normalizes
Jobless claims show an expanding economy. We will only be in a recession once jobless claims exceed 323,000 on a four-week moving average.
Share this:


Everyone was waiting to see if this week’s jobs report would send mortgage rates higher, which is what happened last month. Instead, the 10-year yield had a muted response after the headline number beat estimates, but we have negative job revisions from previous months. The Federal Reserve’s fear of wage growth spiraling out of control hasn’t materialized for over two years now and the unemployment rate ticked up to 3.9%. For now, we can say the labor market isn’t tight anymore, but it’s also not breaking.
The key labor data line in this expansion is the weekly jobless claims report. Jobless claims show an expanding economy that has not lost jobs yet. We will only be in a recession once jobless claims exceed 323,000 on a four-week moving average.
From the Fed: In the week ended March 2, initial claims for unemployment insurance benefits were flat, at 217,000. The four-week moving average declined slightly by 750, to 212,250
Below is an explanation of how we got here with the labor market, which all started during COVID-19.
1. I wrote the COVID-19 recovery model on April 7, 2020, and retired it on Dec. 9, 2020. By that time, the upfront recovery phase was done, and I needed to model out when we would get the jobs lost back.
2. Early in the labor market recovery, when we saw weaker job reports, I doubled and tripled down on my assertion that job openings would get to 10 million in this recovery. Job openings rose as high as to 12 million and are currently over 9 million. Even with the massive miss on a job report in May 2021, I didn’t waver.
Currently, the jobs openings, quit percentage and hires data are below pre-COVID-19 levels, which means the labor market isn’t as tight as it once was, and this is why the employment cost index has been slowing data to move along the quits percentage.

3. I wrote that we should get back all the jobs lost to COVID-19 by September of 2022. At the time this would be a speedy labor market recovery, and it happened on schedule, too
Total employment data
4. This is the key one for right now: If COVID-19 hadn’t happened, we would have between 157 million and 159 million jobs today, which would have been in line with the job growth rate in February 2020. Today, we are at 157,808,000. This is important because job growth should be cooling down now. We are more in line with where the labor market should be when averaging 140K-165K monthly. So for now, the fact that we aren’t trending between 140K-165K means we still have a bit more recovery kick left before we get down to those levels.

From BLS: Total nonfarm payroll employment rose by 275,000 in February, and the unemployment rate increased to 3.9 percent, the U.S. Bureau of Labor Statistics reported today. Job gains occurred in health care, in government, in food services and drinking places, in social assistance, and in transportation and warehousing.
Here are the jobs that were created and lost in the previous month:

In this jobs report, the unemployment rate for education levels looks like this:
- Less than a high school diploma: 6.1%
- High school graduate and no college: 4.2%
- Some college or associate degree: 3.1%
- Bachelor’s degree or higher: 2.2%

Today’s report has continued the trend of the labor data beating my expectations, only because I am looking for the jobs data to slow down to a level of 140K-165K, which hasn’t happened yet. I wouldn’t categorize the labor market as being tight anymore because of the quits ratio and the hires data in the job openings report. This also shows itself in the employment cost index as well. These are key data lines for the Fed and the reason we are going to see three rate cuts this year.
recession unemployment covid-19 fed federal reserve mortgage rates recession recovery unemploymentUncategorized
Inside The Most Ridiculous Jobs Report In History: Record 1.2 Million Immigrant Jobs Added In One Month
Inside The Most Ridiculous Jobs Report In History: Record 1.2 Million Immigrant Jobs Added In One Month
Last month we though that the January…
Share this:


Last month we though that the January jobs report was the "most ridiculous in recent history" but, boy, were we wrong because this morning the Biden department of goalseeked propaganda (aka BLS) published the February jobs report, and holy crap was that something else. Even Goebbels would blush.
What happened? Let's take a closer look.
On the surface, it was (almost) another blockbuster jobs report, certainly one which nobody expected, or rather just one bank out of 76 expected. Starting at the top, the BLS reported that in February the US unexpectedly added 275K jobs, with just one research analyst (from Dai-Ichi Research) expecting a higher number.
Some context: after last month's record 4-sigma beat, today's print was "only" 3 sigma higher than estimates. Needless to say, two multiple sigma beats in a row used to only happen in the USSR... and now in the US, apparently.

Before we go any further, a quick note on what last month we said was "the most ridiculous jobs report in recent history": it appears the BLS read our comments and decided to stop beclowing itself. It did that by slashing last month's ridiculous print by over a third, and revising what was originally reported as a massive 353K beat to just 229K, a 124K revision, which was the biggest one-month negative revision in two years!

Of course, that does not mean that this month's jobs print won't be revised lower: it will be, and not just that month but every other month until the November election because that's the only tool left in the Biden admin's box: pretend the economic and jobs are strong, then revise them sharply lower the next month, something we pointed out first last summer and which has not failed to disappoint once.
In the past month the Biden department of goalseeking stuff higher before revising it lower, has revised the following data sharply lower:
— zerohedge (@zerohedge) August 30, 2023
- Jobs
- JOLTS
- New Home sales
- Housing Starts and Permits
- Industrial Production
- PCE and core PCE
To be fair, not every aspect of the jobs report was stellar (after all, the BLS had to give it some vague credibility). Take the unemployment rate, after flatlining between 3.4% and 3.8% for two years - and thus denying expectations from Sahm's Rule that a recession may have already started - in February the unemployment rate unexpectedly jumped to 3.9%, the highest since February 2022 (with Black unemployment spiking by 0.3% to 5.6%, an indicator which the Biden admin will quickly slam as widespread economic racism or something).

And then there were average hourly earnings, which after surging 0.6% MoM in January (since revised to 0.5%) and spooking markets that wage growth is so hot, the Fed will have no choice but to delay cuts, in February the number tumbled to just 0.1%, the lowest in two years...

... for one simple reason: last month's average wage surge had nothing to do with actual wages, and everything to do with the BLS estimate of hours worked (which is the denominator in the average wage calculation) which last month tumbled to just 34.1 (we were led to believe) the lowest since the covid pandemic...

... but has since been revised higher while the February print rose even more, to 34.3, hence why the latest average wage data was once again a product not of wages going up, but of how long Americans worked in any weekly period, in this case higher from 34.1 to 34.3, an increase which has a major impact on the average calculation.

While the above data points were examples of some latent weakness in the latest report, perhaps meant to give it a sheen of veracity, it was everything else in the report that was a problem starting with the BLS's latest choice of seasonal adjustments (after last month's wholesale revision), which have gone from merely laughable to full clownshow, as the following comparison between the monthly change in BLS and ADP payrolls shows. The trend is clear: the Biden admin numbers are now clearly rising even as the impartial ADP (which directly logs employment numbers at the company level and is far more accurate), shows an accelerating slowdown.

But it's more than just the Biden admin hanging its "success" on seasonal adjustments: when one digs deeper inside the jobs report, all sorts of ugly things emerge... such as the growing unprecedented divergence between the Establishment (payrolls) survey and much more accurate Household (actual employment) survey. To wit, while in January the BLS claims 275K payrolls were added, the Household survey found that the number of actually employed workers dropped for the third straight month (and 4 in the past 5), this time by 184K (from 161.152K to 160.968K).

This means that while the Payrolls series hits new all time highs every month since December 2020 (when according to the BLS the US had its last month of payrolls losses), the level of Employment has not budged in the past year. Worse, as shown in the chart below, such a gaping divergence has opened between the two series in the past 4 years, that the number of Employed workers would need to soar by 9 million (!) to catch up to what Payrolls claims is the employment situation.

There's more: shifting from a quantitative to a qualitative assessment, reveals just how ugly the composition of "new jobs" has been. Consider this: the BLS reports that in February 2024, the US had 132.9 million full-time jobs and 27.9 million part-time jobs. Well, that's great... until you look back one year and find that in February 2023 the US had 133.2 million full-time jobs, or more than it does one year later! And yes, all the job growth since then has been in part-time jobs, which have increased by 921K since February 2023 (from 27.020 million to 27.941 million).

Here is a summary of the labor composition in the past year: all the new jobs have been part-time jobs!

But wait there's even more, because now that the primary season is over and we enter the heart of election season and political talking points will be thrown around left and right, especially in the context of the immigration crisis created intentionally by the Biden administration which is hoping to import millions of new Democratic voters (maybe the US can hold the presidential election in Honduras or Guatemala, after all it is their citizens that will be illegally casting the key votes in November), what we find is that in February, the number of native-born workers tumbled again, sliding by a massive 560K to just 129.807 million. Add to this the December data, and we get a near-record 2.4 million plunge in native-born workers in just the past 3 months (only the covid crash was worse)!

The offset? A record 1.2 million foreign-born (read immigrants, both legal and illegal but mostly illegal) workers added in February!

Said otherwise, not only has all job creation in the past 6 years has been exclusively for foreign-born workers...

... but there has been zero job-creation for native born workers since June 2018!

This is a huge issue - especially at a time of an illegal alien flood at the southwest border...

... and is about to become a huge political scandal, because once the inevitable recession finally hits, there will be millions of furious unemployed Americans demanding a more accurate explanation for what happened - i.e., the illegal immigration floodgates that were opened by the Biden admin.
Which is also why Biden's handlers will do everything in their power to insure there is no official recession before November... and why after the election is over, all economic hell will finally break loose. Until then, however, expect the jobs numbers to get even more ridiculous.


Wendy’s has a new deal for daylight savings time haters


Watch Live: President Biden Reminds Americans Just How Good They’ve Got It Thanks To Him


Mortgage rates fall as labor market normalizes


Racial and Ethnic Wealth Inequality in the Post‑Pandemic Era


Watch: President Biden Delivers The “Darkest, Most Un-American Speech Given By A President”


Wealth Inequality by Age in the Post‑Pandemic Era


Is the biotech market rally real? Data suggest comeback in private, public markets


February Employment Situation


People Who Received Ivermectin Were Better Off, Study Finds


Shipping company files surprise Chapter 7 bankruptcy, liquidation
-

 Uncategorized2 weeks ago
All Of The Elements Are In Place For An Economic Crisis Of Staggering Proportions
-

 Uncategorized1 month ago
Cathie Wood sells a major tech stock (again)
-

 Uncategorized3 weeks ago
California Counties Could Be Forced To Pay $300 Million To Cover COVID-Era Program
-

 Uncategorized2 weeks ago
Apparel Retailer Express Moving Toward Bankruptcy
-

 Uncategorized3 weeks ago
Industrial Production Decreased 0.1% in January
-

 International1 day ago
Walmart launches clever answer to Target’s new membership program
-

 Uncategorized3 weeks ago
RFK Jr: The Wuhan Cover-Up & The Rise Of The Biowarfare-Industrial Complex
-

 Uncategorized3 weeks ago
GOP Efforts To Shore Up Election Security In Swing States Face Challenges