Bitcoin Post-Halving Report (Q2 2020) by Cointelegraph Markets Research
Bitcoin Post-Halving Report (Q2 2020) by Cointelegraph Markets Research
Share this:


Strengthening network fundamentals support the bullish case for Bitcoin price one month after the halving.
Cointelegraph Markets’ post-halving Bitcoin (BTC) analysis report takes a deep look at the 2020 halving, its effect on the crypto market and miners, and how it compared to the previous halving events.
The three main sections of this report are:
The Bitcoin halving
Scheduled to take place roughly every four years, the Bitcoin halving is a built-in event that cuts Bitcoin’s block reward by half. The halving that occurred on May 11 is the third of its kind, bringing with it the reduction of Bitcoin’s issuance rate from 12.5 BTC to 6.25 BTC for every new block that is mined roughly every 10 minutes.
In other words, for the next four years, the amount of new Bitcoin entering into existence, or “mined” daily, has been cut in half from roughly 1,800 to 900 BTC per day — the equivalent of $8.9 million at the current market price of $9,900.
The halving is one of Bitcoin’s most notable events, as it plays a major role in the currency’s deflationary nature and has so far served as a gateway to drive mainstream interest in the cryptocurrency.
A notable feature of the most recent halving is that the reduced issuance rate has dropped Bitcoin’s inflation rate to 1.8%, which is below the inflation target of the United States Federal Reserve. This new era of mining also marks a “make-or-break” period for the popular stock-to-flow model, according to its creator.
What’s next for Bitcoin miners?
Key highlights:
- The Bitcoin network hash rate has stabilized following a steep drop following the halving.
- Most miners are continuing to hold BTC even after the halving.
- Lower breakeven prices are expected for miners upgrading to new equipment.
- The halving produced noticeable changes in BTC mining pool dynamics
How miners behave in response to the most recent halving can provide valuable insight into the possible directions Bitcoin’s price will take. With the halving complete, investors and institutions are surely keeping a close eye on the Bitcoin mining ecosystem, comprised of miners, mining pools and other key players.
In addition to supporting the network, miners also play a major role in Bitcoin’s market dynamics. Currently, miners represent the majority of Bitcoin’s selling pressure, creating 900 new BTC every single day on average following the 2020 halving.
Although this figure may not seem like a lot when compared to the Bitcoin trading volumes that consistently surpass $10 billion daily, miners are the Bitcoin market’s natural sellers.
The halving’s impact on Bitcoin’s hash rate and mining difficulty
According to Blockchain.com data, the Bitcoin network hash rate showed constant growth following a drop on March 12 caused by the crash in BTC price — an event now referred to as Black Thursday.
The network hash rate peaked at 122.165 exahashes per second on May 8. However, this trend quickly changed following the halving, resulting in an accentuated drop of 25.76% to 90.69 EH/s in 12 days. After bottoming out at 90.29 EH/s on May 26, Bitcoin’s hash rate has been surging and is currently sitting at 113.9 EH/s.
.Source: Blockchain.com")
Total Network hash rate (TH/s).Source: Blockchain.com
The drop in the hash rate came as no surprise to many and some industry insiders believe it may even be a bullish sign for Bitcoin. As production costs have doubled, mining simply becomes unsustainable for some operations who may have higher electricity costs or old-generation equipment like the popular Antminer S9.
Marc Fresa, the founder of United States-based Asic.to, a company that specializes in producing firmware for mining machines, previously told Cointelegraph:
“You can expect the hash rate to decrease as profitability for miners across the board are slashed. This result will cause the older generation miners to be unplugged unless they can find a new home with extremely cheap or free power.”
While the drop in hash rate translates into equipment being shut down or re-directed at other networks with similar hashing algorithms like Bitcoin Cash or Bitcoin SV, the gap has also created an opportunity for new operations to enter the fold as new mining equipment will be available in June.
Meanwhile, an analysis of the Bitcoin network difficulty following its latest adjustment on June 4 reveals a key similarity to when BTC/USD traded at lows of $3,100 in December 2018.
On June 4, the difficulty adjusted down by 9.3%. That followed a downward shift two weeks previously of 6%. If the next adjustment is also negative — it is currently forecast at -5% — it will be only the third time ever that three back-to-back negative adjustments have occurred.

Network difficulty. Source: Blockchain.com
How miners behaved before, during and after the halving
Data from on-chain analytics provider CryptoQuant shows that before the halving, miners refrained from sending Bitcoin to exchanges, which was an important factor in Bitcoin’s price surge prior to the halving. This trend changed slightly during the price dip on May 10.
. Source: CryptoQuant")
Miners’ Position Index (MPI). Source: CryptoQuant
A Miners’ Position Index reading above 2.0 suggests miners sell their BTC after mining, while a negative value shows they avoid selling as much as possible in favor of accumulation.
The current MPI shows that miners are still holding on to their BTC following the halving despite the rise in Bitcoin’s price. This shows that miners are not eager to sell at current prices following an increase in production costs.
After the halving, exchange inflow data shows that some accentuated drops in Bitcoin’s price coincided with an increase in the number of newly mined BTC being sent to exchanges. This shows that miners still have an important impact on the price despite their selling potential being cut in half.

All Bitcoin exchange inflows. Source: CryptoQuant
Mining equipment and profitability
New Bitcoin mining equipment is expected to be available this month. Bitmain’s S19 ASIC series was made available for presale in February, and it is expected to be shipped out in June.
The Antminer S19 Pro has a 110 terahash-per-second hash rate with 29.5 joules per terahash, while the standard S19 generates 95 TH/s at 34.5 J/TH. The S19 Pro and S19 cost $2,633 and $1,964, respectively.
Competing ASIC manufacturer MicroBT has recently revealed its M30 series, which will be available in June as well. The ASIC miner will also have two versions: the M30s++ with a hash rate of 112 TH/s at a power efficiency of 31 J/TH, and the M30s+ with 100TH/s with 34 J/TH of efficiency. The price tag for the M30s++ is $1,980 and $1,780 for the M30s+.
Electricity prices for miners in China range from $0.03 to $0.05 per kilowatt-hour, whereas various locations in the U.S. can reach $0.06 per kWh and higher.
This means that — on paper — miners with the new Antminer S19 Pro equipment need Bitcoin to stay within the $2,500-to-$4,900 price range at $0.03–$0.06 per kWh, whereas miners with the standard S19 need the price to stay within the $2,900-to-$5,500 price range for an electricity cost of $0.03–$0.06 per kWh.
As for the MicroBT M30 series, the break-even price is $2,500 to $5,00 for the M30s++ at $0.03–$0.06 per kWh; and the M30s+ break-even price is within the $3,000-to-$5,500 price range at $0.03–$0.06 per kWh.
The Bitcoin halving and mining pools
Chinese mining pools make up the majority of the Bitcoin network hash rate — a factor that concerns some experts. According to Cambridge University’s Centre for Alternative Finance, China currently accounts for nearly 65% of hash power.

Network hash rate historical distribution. Source: BTC.com
Noticeably, the OKEx pool has gone from less than 1% of the network hash rate to 5.66% at the time of writing. F2Pool, the largest mining pool on the network, has seen a somewhat modest increase from 16.16% to 18.08%.
BTC correlation with stocks, gold & rising institutional interest
Key highlights:
- Bitcoin only correlated with stocks on smaller time frames.
- The relationship between major markets and Bitcoin shifts before and after each halving, suggesting a decoupling from stocks in 2020.
- Grayscale GBTC and CME BTC futures volumes show institutions are deeply interested.
- Options markets pricing show halving uncertainties are no longer a risk.
Prior to the halving, there was a great deal of discussion and concern about the correlation between Bitcoin and traditional markets. While the discussion has melted to nothing more than background noise, the correlation between the two remains.
What investors should note is that virtually all markets have started trading in tandem since central banks began liquidity injections and the coronavirus pandemic took center stage in March.
Simply implying that stocks and Bitcoin have been behaving similarly based on a few months of strong correlation does not mean the potential “digital gold” theory has become a bust. Bitcoin’s $175-billion market capitalization pales in comparison to gold’s $9-trillion market cap, leading to excessive volatility.
Nonetheless, professional investors have been flocking to Bitcoin, and growing CME futures open interest is key evidence.

30-day Bitcoin USD correlation Vs. S&P 500. Source: TradingView
Although one can argue Bitcoin’s 30-day correlation with the S&P 500 has been close to 0.80 since early 2020, it is not significantly representative based on a more extended timeframe. A similar movement happened in late 2017, as both the stock and cryptocurrency markets soared.
Bitcoin’s price swings have been notoriously disconnected from movements in other markets. But from time to time, the prices move in the same direction across the board for multiple asset classes.
 vs. S&P 500. Source: TradingView")
Bitcoin USD (blue) vs. S&P 500. Source: TradingView
March was a particularly rough month for Bitcoin, but the S&P 500 also showed weakness. Investors panicked as soon as lockdown announcements were made across many major U.S. cities.
For example, the U.S. Federal Reserve’s recent expansionary movement was part of a coordinated global effort to cut interest rates and purchase over $6 trillion worth of assets by central banks.
Oftentimes, the result of such policies is a contingent of investors seeking hard assets to protect from “monetary inflation,” as legendary investor Paul Tudor Jones wrote in his investment letter.
There is no indication so far that the halving had an impact on Bitcoin’s correlation with traditional assets. A decoupling should be expected as soon as investors’ attention is drawn away from central banks’ expansionist measures.

30-day Bitcoin USD correlation vs. gold - Source: TradingView
As shown above, there’s no clear pattern on a longer time frame on the 30-day correlation between gold and Bitcoin. This completely disproves the “digital gold” theory, and it’s also an excellent sign that Bitcoin is far from mature.
The digital asset is working exactly as designed: a commodity in its own league, uncorrelated to traditional financial assets.
Bitcoin and market indexes amid halvings

2012 Halving: Market indexes vs. BTC returns. Source: Coinmetrics.io
One month before the 2020 halving, Bitcoin’s correlation with the S&P 500 and Nasdaq was around 37.8%. This one-month correlation shifted after each halving with both market indexes.
When looking at the correlations between Bitcoin’s price and the S&P 500, one can see that in 2012, it was slightly positive (at 10%) before the halving and shifted negatively to -17% after the halving. In 2016, again, it was slightly negative at -7.9% then flipped considerably positively to 43.4% afterward.
Similar outcomes were observed when investigating the one-month correlations between Bitcoin’s price and the Nasdaq. In 2012, it was non-existent (0.6%) before the halving and at -4.2% afterward. In 2016, it was slightly negative at -8.7% before the halving and then positive at 35.5% after the halving.
As seen from the cumulative returns before and after each halving, Bitcoin surged in 2012, while showing a modest loss in 2016 when considering the three-month timeframe after the event.
If the previous trends continue, investors could expect a negative correlation moving forward with major market indexes in the next month. However, the U.S. Federal Reserve’s quantitative easing injections have been leading stock markets to recover from the March crash in the same fashion as Bitcoin. This uptrend contradicts the inverse relationship between both assets seen after each halving in previous years.

2016 Halving: Market indexes vs. BTC returns. Source: Coinmetrics.io
The relationship between Bitcoin and gold after halvings
In the last three months before the 2020 halving, Bitcoin had a 20% correlation with gold while showing a very small relationship when only considering the last month before the halving (-5.5%).
Bitcoin showed a very high correlation with gold three months prior to the 2012 and 2016 halvings at 81.9% and 61.2%, respectively. The same positive correlation is present one month before the halving in both cases.
As explained above, the correlation between Bitcoin and gold shifts dramatically after the halving, resulting in a negative relationship. In 2012, the one-month correlation after the halving between Bitcoin and gold was -44.9%, while it was -67.7% in 2016.
 2012 Halving: Gold vs. Bitcoin returns. Source: Coinmetrics.io and Gold.org
In 2012 and 2016, gold’s price decreased after each Bitcoin halving event, while Bitcoin showed a contrasting behavior in each year.

2016 Halving: Gold vs. Bitcoin returns. Source: Coinmetrics.io and Gold.org
If the previous cycles continue, investors could expect a shift in the trend, meaning Bitcoin’s correlation with gold could turn negative in the next few months.
Institutional interest picking up
Bitcoin has also seen increased interest from institutional investors. Open interest at the Chicago Mercantile Exchange BTC futures crossed the $500-million mark right after the halving. This is an all-time high, albeit the daily traded volume remains some 50% below mid-February levels.

CME Bitcoin Futures Total Open Interest. Source: Skew
Relevant investors’ entry into CME Bitcoin markets became evident after hedge fund investor Paul Tudor Jones revealed his recently acquired stake. Furthermore, on May 8, 3iQ Corp announced the completion of a $48-million offering of its Bitcoin Fund, which recently began trading on the Toronto Stock Exchange.
Another staggering figure was Grayscale Investments’ capital inflow to its GBTC security, an exchange-traded fund whose single asset is Bitcoin. Grayscale’s crypto funds brought in over $500 million in Q1 alone, 90% exclusively from institutional players.
Further development occurred in May as Renaissance Technologies’ Medallion Fund, a hedge fund with $10 billion worth of assets under management, received the U.S. Securities and Exchange Commission’s approval to trade CME Bitcoin futures.

CME Bitcoin options open interest. Source: Skew
Bitcoin options markets at CME, a derivative contract with lackluster volumes, have also started to gain traction. Over the span of 14 days, its open interest skyrocketed by 1,200%, jumping to $174 million.
Additionally, as halving uncertainties became less of a risk, institutional investors began mounting bullish positions, as 90% of recent CME open interest comes from call options.
Tether market cap growth boosts Bitcoin
Key highlights:
- A positive relationship between the issuing of Tether (USDT) and Bitcoin’s price presents a positive outlook for the short and medium-term.
- Bitcoin and crypto-related social media volume continue to influence volume leading into each halving.
Stablecoin market growth points to positive future Bitcoin gains
. Source: Coinmetrics.io")
USDT market cap vs. Bitcoin (Sept. 2, 2019–May 18, 2020). Source: Coinmetrics.io
Between Feb. 10 and May 18, Tether’s treasury consistently minted USDT, leading to the development of a positive correlation (23%) between Bitcoin returns and Tether’s market cap growth.
The last minting period (Sept. 2, 2019–Dec. 27, 2019) shows a positive correlation (17%), while the last non-minting period (Dec. 28, 2019–Feb. 9, 2020) indicates a negative correlation (-9.6%) between those variables.
The shifts in correlations between minting and non-minting periods go in the same line as previous studies that show when Tether issues new coins, there is a positive effect on Bitcoin’s price.
Newer research contradicts previous findings for this theory, however. When analyzing shorter timeframes and employing a regression model, we find some significant results between the two variables:
- In the first minting period, USDT’s market cap growth suggests a predictive power on Bitcoin’s returns. When USDT’s market cap grew by 1%, Bitcoin price would grow by 0.314% the next day — a statistically significant result at the 10% level.
- There was not a significant relationship in the non-minting period and in the more recent minting period.
- Since Sept. 2, 2019, incorporating minting and non-minting periods, there is a significant relationship at the 1% level between both variables. When USDT’s market cap grows by 1%, Bitcoin’s price gains 0.59% the same day.
As the global market cap of stablecoins continues to grow over $10.7 billion, investors can expect the continuity of this relationship after the halving, thus reinforcing the positive outlook for Bitcoin’s price.

Stablecoin market capitalization. Source: Stable Coin Index
Social media metrics reflect investors’ confidence amid halving
The number of Bitcoin-related tweets reached 82,000 on the day of the halving, which is a record value since February 2018.

BTC price vs number of tweets in 2020. Source: Coinmetrics.io and Bitinfocharts
Thirty days before the halving, Bitcoin’s price correlation with the number of tweets was at 90%, while the same analysis before 2016’s halving was also positive at 17.5%.
In 2016, the positive relationship seen before the halving shifted to a negative correlation after the halving as social media volume naturally decreases after an event that only occurs every four years.

BTC price vs number of tweets in 2016. Source: Coinmetrics.io and Bitinfocharts
As a benchmark, since 2014, the correlation between Bitcoin’s price and the number of tweets is 40%, reinforcing this year’s high social enthusiasm about Bitcoin before the halving.
As previously reported by Cointelegraph, social media activity influences trading volume and had a very small influence on Bitcoin’s price throughout 2019.
The month before the halving, correlation between the number of tweets mentioning Bitcoin and BTC’s trading volume was 74.3%, reinforcing the strong relationship between social media activity and the asset’s trading volume.
Bitcoin’s volatility seems to go hand-in-hand with periods of higher interest in social media volume around Bitcoin, suggesting short-term opportunities to take advantage of that surge.
Looking forward
The 2020 halving has already had a noticeable impact on Bitcoin much like the halvings before it, both of which preceded considerable appreciation in BTC’s price.
The hash rate, mining difficulty and other on-chain metrics have been in flux and adapting to the new economic reality of reduced mining block rewards.
Meanwhile, Bitcoin continues to follow certain patterns such as a noticeable correlation in value to traditional markets and geopolitical events. However, previous halvings have shown that the relationship between major markets and Bitcoin shifts before and after each halving, suggesting the asset could decouple from stocks in 2020.
Additionally, the recent positive relationship between Tether’s USDT issuance and Bitcoin’s price continues to present a pleasant outlook for the short and medium-term.
This seems likely, considering the continuous growth in USDT market capitalization that is rapidly approaching $10 billion after supplanting Ripple (XRP) as the third-largest cryptocurrency earlier this month.
The latest Bitcoin halving has also seen record media attention compared to 2016, as well as unprecedented institutional interest and volumes. Notably, Paul Tudor Jones revealed right around the time of the halving that his fund had made a small 1%–2% size allocation to Bitcoin.
Growing institutional interest and new funds entering the Bitcoin market are a strong bullish sign for the cryptocurrency, and 2020 is shaping up to be a pivotal year for Bitcoin — which is on its way to becoming a new standalone asset class.
The views and opinions expressed here are solely those of the authors and do not necessarily reflect the views of Cointelegraph. Every investment and trading move involves risk. You should conduct your own research when making a decision.
Government
Mistakes Were Made
Mistakes Were Made
Authored by C.J.Hopkins via The Consent Factory,
Make fun of the Germans all you want, and I’ve certainly done that…
Share this:


Authored by C.J.Hopkins via The Consent Factory,
Make fun of the Germans all you want, and I’ve certainly done that a bit during these past few years, but, if there’s one thing they’re exceptionally good at, it’s taking responsibility for their mistakes. Seriously, when it comes to acknowledging one’s mistakes, and not rationalizing, or minimizing, or attempting to deny them, and any discomfort they may have allegedly caused, no one does it quite like the Germans.
Take this Covid mess, for example. Just last week, the German authorities confessed that they made a few minor mistakes during their management of the “Covid pandemic.” According to Karl Lauterbach, the Minister of Health, “we were sometimes too strict with the children and probably started easing the restrictions a little too late.” Horst Seehofer, the former Interior Minister, admitted that he would no longer agree to some of the Covid restrictions today, for example, nationwide nighttime curfews. “One must be very careful with calls for compulsory vaccination,” he added. Helge Braun, Head of the Chancellery and Minister for Special Affairs under Merkel, agreed that there had been “misjudgments,” for example, “overestimating the effectiveness of the vaccines.”
This display of the German authorities’ unwavering commitment to transparency and honesty, and the principle of personal honor that guides the German authorities in all their affairs, and that is deeply ingrained in the German character, was published in a piece called “The Divisive Virus” in Der Spiegel, and immediately widely disseminated by the rest of the German state and corporate media in a totally organic manner which did not in any way resemble one enormous Goebbelsian keyboard instrument pumping out official propaganda in perfect synchronization, or anything creepy and fascistic like that.
Germany, after all, is “an extremely democratic state,” with freedom of speech and the press and all that, not some kind of totalitarian country where the masses are inundated with official propaganda and critics of the government are dragged into criminal court and prosecuted on trumped-up “hate crime” charges.
OK, sure, in a non-democratic totalitarian system, such public “admissions of mistakes” — and the synchronized dissemination thereof by the media — would just be a part of the process of whitewashing the authorities’ fascistic behavior during some particularly totalitarian phase of transforming society into whatever totalitarian dystopia they were trying to transform it into (for example, a three-year-long “state of emergency,” which they declared to keep the masses terrorized and cooperative while they stripped them of their democratic rights, i.e., the ones they hadn’t already stripped them of, and conditioned them to mindlessly follow orders, and robotically repeat nonsensical official slogans, and vent their impotent hatred and fear at the new “Untermenschen” or “counter-revolutionaries”), but that is obviously not the case here.
No, this is definitely not the German authorities staging a public “accountability” spectacle in order to memory-hole what happened during 2020-2023 and enshrine the official narrative in history. There’s going to be a formal “Inquiry Commission” — conducted by the same German authorities that managed the “crisis” — which will get to the bottom of all the regrettable but completely understandable “mistakes” that were made in the heat of the heroic battle against The Divisive Virus!
OK, calm down, all you “conspiracy theorists,” “Covid deniers,” and “anti-vaxxers.” This isn’t going to be like the Nuremberg Trials. No one is going to get taken out and hanged. It’s about identifying and acknowledging mistakes, and learning from them, so that the authorities can manage everything better during the next “pandemic,” or “climate emergency,” or “terrorist attack,” or “insurrection,” or whatever.
For example, the Inquiry Commission will want to look into how the government accidentally declared a Nationwide State of Pandemic Emergency and revised the Infection Protection Act, suspending the German constitution and granting the government the power to rule by decree, on account of a respiratory virus that clearly posed no threat to society at large, and then unleashed police goon squads on the thousands of people who gathered outside the Reichstag to protest the revocation of their constitutional rights.
Thousands gathered outside the Reichstag building in Berlin to protest the "New Normal" totalitarianism this morning, so the police declared the demonstration illegal and turned the water cannons on them ... are you satisfied yet, totalitarians? pic.twitter.com/j70CHsEWWM
— Consent Factory (@consent_factory) November 18, 2020
Once they do, I’m sure they’ll find that that “mistake” bears absolutely no resemblance to the Enabling Act of 1933, which suspended the German constitution and granted the government the power to rule by decree, after the Nazis declared a nationwide “state of emergency.”
Another thing the Commission will probably want to look into is how the German authorities accidentally banned any further demonstrations against their arbitrary decrees, and ordered the police to brutalize anyone participating in such “illegal demonstrations.”
Memories fade, and history is rewritten, so here's a 2.5 minute montage of goon squads in Germany (which, of course, bear no resemblance whatsoever to the SA, or the SS, or any other Nazi goons) enforcing compliance with official "New Normal" ideology during 2020-2022. https://t.co/GIrb4NCJcC pic.twitter.com/6BIOgLVLKx
— CJ Hopkins (@CJHopkins_Z23) March 10, 2024
And, while the Commission is inquiring into the possibly slightly inappropriate behavior of their law enforcement officials, they might want to also take a look at the behavior of their unofficial goon squads, like Antifa, which they accidentally encouraged to attack the “anti-vaxxers,” the “Covid deniers,” and anyone brandishing a copy of the German constitution.
Don't worry, Covidian Cultists ... German Antifa is mobilizing to unleash total war on "extremist neo-Nazi Corona Deniers" like the lady holding the copy of the German constitution in the lower right! pic.twitter.com/HkdXBxyaEJ
— Consent Factory (@consent_factory) December 12, 2020
Come to think of it, the Inquiry Commission might also want to look into how the German authorities, and the overwhelming majority of the state and corporate media, accidentally systematically fomented mass hatred of anyone who dared to question the government’s arbitrary and nonsensical decrees or who refused to submit to “vaccination,” and publicly demonized us as “Corona deniers,” “conspiracy theorists,” “anti-vaxxers,” “far-right anti-Semites,” etc., to the point where mainstream German celebrities like Sarah Bosetti were literally describing us as the inessential “appendix” in the body of the nation, quoting an infamous Nazi almost verbatim.

And then there’s the whole “vaccination” business. The Commission will certainly want to inquire into that. They will probably want to start their inquiry with Karl Lauterbach, and determine exactly how he accidentally lied to the public, over and over, and over again …
And whipped people up into a mass hysteria over “KILLER VARIANTS” …

And “LONG COVID BRAIN ATTACKS” …

And how “THE UNVACCINATED ARE HOLDING THE WHOLE COUNTRY HOSTAGE, SO WE NEED TO FORCIBLY VACCINATE EVERYONE!”

And so on. I could go on with this all day, but it will be much easier to just refer you, and the Commission, to this documentary film by Aya Velázquez. Non-German readers may want to skip to the second half, unless they’re interested in the German “Corona Expert Council” …
Look, the point is, everybody makes “mistakes,” especially during a “state of emergency,” or a war, or some other type of global “crisis.” At least we can always count on the Germans to step up and take responsibility for theirs, and not claim that they didn’t know what was happening, or that they were “just following orders,” or that “the science changed.”
Plus, all this Covid stuff is ancient history, and, as Olaf, an editor at Der Spiegel, reminds us, it’s time to put the “The Divisive Pandemic” behind us …
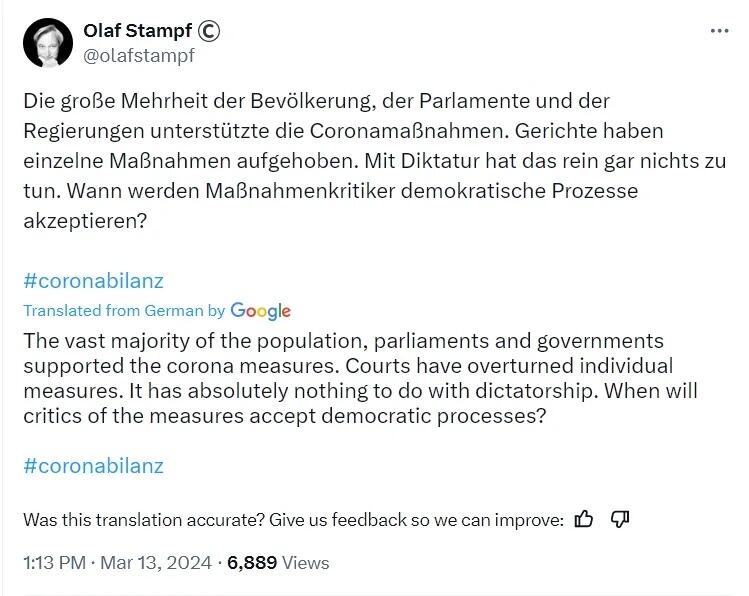
… and click heels, and heil the New Normal Democracy!
Government
Harvard Medical School Professor Was Fired Over Not Getting COVID Vaccine
Harvard Medical School Professor Was Fired Over Not Getting COVID Vaccine
Authored by Zachary Stieber via The Epoch Times (emphasis ours),
A…
Share this:


Authored by Zachary Stieber via The Epoch Times (emphasis ours),
A Harvard Medical School professor who refused to get a COVID-19 vaccine has been terminated, according to documents reviewed by The Epoch Times.
Martin Kulldorff, an epidemiologist, was fired by Mass General Brigham in November 2021 over noncompliance with the hospital’s COVID-19 vaccine mandate after his requests for exemptions from the mandate were denied, according to one document. Mr. Kulldorff was also placed on leave by Harvard Medical School (HMS) because his appointment as professor of medicine there “depends upon” holding a position at the hospital, another document stated.
Mr. Kulldorff asked HMS in late 2023 how he could return to his position and was told he was being fired.
“You would need to hold an eligible appointment with a Harvard-affiliated institution for your HMS academic appointment to continue,” Dr. Grace Huang, dean for faculty affairs, told the epidemiologist and biostatistician.
She said the lack of an appointment, combined with college rules that cap leaves of absence at two years, meant he was being terminated.
Mr. Kulldorff disclosed the firing for the first time this month.
“While I can’t comment on the specifics due to employment confidentiality protections that preclude us from doing so, I can confirm that his employment agreement was terminated November 10, 2021,” a spokesperson for Brigham and Women’s Hospital told The Epoch Times via email.
Mass General Brigham granted just 234 exemption requests out of 2,402 received, according to court filings in an ongoing case that alleges discrimination.
The hospital said previously, “We received a number of exemption requests, and each request was carefully considered by a knowledgeable team of reviewers.”
“A lot of other people received exemptions, but I did not,” Mr. Kulldorff told The Epoch Times.
Mr. Kulldorff was originally hired by HMS but switched departments in 2015 to work at the Department of Medicine at Brigham and Women’s Hospital, which is part of Mass General Brigham and affiliated with HMS.
“Harvard Medical School has affiliation agreements with several Boston hospitals which it neither owns nor operationally controls,” an HMS spokesperson told The Epoch Times in an email. “Hospital-based faculty, such as Mr. Kulldorff, are employed by one of the affiliates, not by HMS, and require an active hospital appointment to maintain an academic appointment at Harvard Medical School.”
HMS confirmed that some faculty, who are tenured or on the tenure track, do not require hospital appointments.
Natural Immunity
Before the COVID-19 vaccines became available, Mr. Kulldorff contracted COVID-19. He was hospitalized but eventually recovered.
That gave him a form of protection known as natural immunity. According to a number of studies, including papers from the U.S. Centers for Disease Control and Prevention, natural immunity is better than the protection bestowed by vaccines.
Other studies have found that people with natural immunity face a higher risk of problems after vaccination.
Mr. Kulldorff expressed his concerns about receiving a vaccine in his request for a medical exemption, pointing out a lack of data for vaccinating people who suffer from the same issue he does.
“I already had superior infection-acquired immunity; and it was risky to vaccinate me without proper efficacy and safety studies on patients with my type of immune deficiency,” Mr. Kulldorff wrote in an essay.
In his request for a religious exemption, he highlighted an Israel study that was among the first to compare protection after infection to protection after vaccination. Researchers found that the vaccinated had less protection than the naturally immune.
“Having had COVID disease, I have stronger longer lasting immunity than those vaccinated (Gazit et al). Lacking scientific rationale, vaccine mandates are religious dogma, and I request a religious exemption from COVID vaccination,” he wrote.
Both requests were denied.
Mr. Kulldorff is still unvaccinated.
“I had COVID. I had it badly. So I have infection-acquired immunity. So I don’t need the vaccine,” he told The Epoch Times.
Dissenting Voice
Mr. Kulldorff has been a prominent dissenting voice during the COVID-19 pandemic, countering messaging from the government and many doctors that the COVID-19 vaccines were needed, regardless of prior infection.
He spoke out in an op-ed in April 2021, for instance, against requiring people to provide proof of vaccination to attend shows, go to school, and visit restaurants.
“The idea that everybody needs to be vaccinated is as scientifically baseless as the idea that nobody does. Covid vaccines are essential for older, high-risk people and their caretakers and advisable for many others. But those who’ve been infected are already immune,” he wrote at the time.
Mr. Kulldorff later co-authored the Great Barrington Declaration, which called for focused protection of people at high risk while removing restrictions for younger, healthy people.
Harsh restrictions such as school closures “will cause irreparable damage” if not lifted, the declaration stated.
The declaration drew criticism from Dr. Anthony Fauci, head of the National Institute of Allergy and Infectious Diseases, and Dr. Rochelle Walensky, who became the head of the CDC, among others.
In a competing document, Dr. Walensky and others said that “relying upon immunity from natural infections for COVID-19 is flawed” and that “uncontrolled transmission in younger people risks significant morbidity(3) and mortality across the whole population.”
“Those who are pushing these vaccine mandates and vaccine passports—vaccine fanatics, I would call them—to me they have done much more damage during this one year than the anti-vaxxers have done in two decades,” Mr. Kulldorff later said in an EpochTV interview. “I would even say that these vaccine fanatics, they are the biggest anti-vaxxers that we have right now. They’re doing so much more damage to vaccine confidence than anybody else.”
Surveys indicate that people have less trust now in the CDC and other health institutions than before the pandemic, and data from the CDC and elsewhere show that fewer people are receiving the new COVID-19 vaccines and other shots.
Support
The disclosure that Mr. Kulldorff was fired drew criticism of Harvard and support for Mr. Kulldorff.
The termination “is a massive and incomprehensible injustice,” Dr. Aaron Kheriaty, an ethics expert who was fired from the University of California–Irvine School of Medicine for not getting a COVID-19 vaccine because he had natural immunity, said on X.
“The academy is full of people who declined vaccines—mostly with dubious exemptions—and yet Harvard fires the one professor who happens to speak out against government policies.” Dr. Vinay Prasad, an epidemiologist at the University of California–San Francisco, wrote in a blog post. “It looks like Harvard has weaponized its policies and selectively enforces them.”
A petition to reinstate Mr. Kulldorff has garnered more than 1,800 signatures.
Some other doctors said the decision to let Mr. Kulldorff go was correct.
“Actions have consequence,” Dr. Alastair McAlpine, a Canadian doctor, wrote on X. He said Mr. Kulldorff had “publicly undermine[d] public health.”
Uncategorized
Correcting the Washington Post’s 11 Charts That Are Supposed to Tell Us How the Economy Changed Since Covid
The Washington Post made some serious errors or omissions in its 11 charts that are supposed to tell us how Covid changed the economy. Wages Starting with…
Share this:

The Washington Post made some serious errors or omissions in its 11 charts that are supposed to tell us how Covid changed the economy.
Wages
Starting with its second chart, the article gives us an index of average weekly wages since 2019. The index shows a big jump in 2020, which then falls off in 2021 and 2022, before rising again in 2023.
It tells readers:
“Many Americans got large pay increases after the pandemic, when employers were having to one-up each other to find and keep workers. For a while, those wage gains were wiped out by decade-high inflation: Workers were getting larger paychecks, but it wasn’t enough to keep up with rising prices.”
That actually is not what its chart shows. The big rise in average weekly wages at the start of the pandemic was not the result of workers getting pay increases, it was the result of low-paid workers in sectors like hotels and restaurants losing their jobs.
The number of people employed in the low-paying leisure and hospitality sector fell by more than 8 million at the start of the pandemic. Even at the start of 2021 it was still down by over 4 million.
Laying off low-paid workers raises average wages in the same way that getting the short people to leave raises the average height of the people in the room. The Washington Post might try to tell us that the remaining people grew taller, but that is not what happened.
The other problem with this chart is that it is giving us weekly wages. The length of the average workweek jumped at the start of the pandemic as employers decided to work the workers they had longer hours rather than hire more workers. In January of 2021 the average workweek was 34.9 hours, compared to 34.4 hours in 2019 and 34.3 hours in February.
This increase in hours, by itself, would raise weekly pay by 2.0 percent. As hours returned to normal in 2022, this measure would misleadingly imply that wages were falling.
It is also worth noting that the fastest wage gains since the pandemic have been at the bottom end of the wage distribution and the Black/white wage gap has fallen to its lowest level on record.
Saving Rates
The third chart shows the saving rate since 2019. It shows a big spike at the start of the pandemic, as people stopped spending on things like restaurants and travel and they got pandemic checks from the government. It then falls sharply in 2022 and is lower in the most recent quarters than in 2019.
The piece tells readers:
“But as the world reopened — and people resumed spending on dining out, travel, concerts and other things that were previously off-limits — savings rates have leveled off. Americans are also increasingly dip into rainy-day funds to pay more for necessities, including groceries, housing, education and health care. In fact, Americans are now generally saving less of their incomes than they were before the pandemic.
This is an incomplete picture due to a somewhat technical issue. As I explained in a blogpost a few months ago, there is an unusually large gap between GDP as measured on the output side and GDP measured on the income side. In principle, these two numbers should be the same, but they never come out exactly equal.
In recent quarters, the gap has been 2.5 percent of GDP. This is extraordinarily large, but it also is unusual in that the output side is higher than the income side, the opposite of the standard pattern over the last quarter century.
It is standard for economists to assume that the true number for GDP is somewhere between the two measures. If we make that assumption about the data for 2023, it would imply that income is somewhat higher than the data now show and consumption somewhat lower.
In that story, as I showed in the blogpost, the saving rate for 2023 would be 6.8 percent of disposable income, roughly the same as the average for the three years before the pandemic. This would mean that people are not dipping into their rainy-day funds as the Post tells us. They are spending pretty much as they did before the pandemic.
Credit Card Debt
The next graph shows that credit card debt is rising again, after sinking in the pandemic. The piece tells readers:
“But now, debt loads are swinging higher again as families try to keep up with rising prices. Total household debt reached a record $17.5 trillion at the end of 2023, according to the Federal Reserve Bank of New York. And, in a worrisome sign for the economy, delinquency rates on mortgages, car loans and credit cards are all rising, too.”
There are several points worth noting here. Credit card debt is rising, but measured relative to income it is still below where it was before the pandemic. It was 6.7 percent of disposable income at the end of 2019, compared to 6.5 percent at the end of last year.
The second point is that a major reason for the recent surge in credit card debt is that people are no longer refinancing mortgages. There was a massive surge in mortgage refinancing with the low interest rates in 2020-2021.
Many of the people who refinanced took additional money out, taking advantage of the increased equity in their home. This channel of credit was cut off when mortgage rates jumped in 2022 and virtually ended mortgage refinancing. This means that to a large extent the surge in credit card borrowing is simply a shift from mortgage debt to credit card debt.
The point about total household debt hitting a record can be said in most months. Except in the period immediately following the collapse of the housing bubble, total debt is almost always rising.
And the rise in delinquencies simply reflects the fact that they had been at very low levels in 2021 and 2022. For the most part, delinquency rates are just getting back to their pre-pandemic levels, which were historically low.
Grocery Prices and Gas Prices
The next two charts show the patterns in grocery prices and gas prices since the pandemic. It would have been worth mentioning that every major economy in the world saw similar run-ups in prices in these two areas. In other words, there was nothing specific to U.S. policy that led to a surge in inflation here.
The Missing Charts
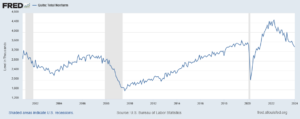
There are several areas where it would have been interesting to see charts which the Post did not include. It would have been useful to have a chart on job quitters, the number of people who voluntarily quit their jobs during the pandemic. In the tight labor markets of 2021 and 2022 the number of workers who left jobs they didn’t like soared to record levels, as shown below.
The vast majority of these workers took other jobs that they liked better. This likely explains another item that could appear as a graph, the record level of job satisfaction.
In a similar vein there has been an explosion in the number of people who work from home at least part-time. This has increased by more than 17 million during the pandemic. These workers are saving themselves thousands of dollars a year on commuting costs and related expenses, as well as hundreds of hours spent commuting.
Finally, there has been an explosion in the use of telemedicine since the pandemic. At the peak, nearly one in four visits with a health care professional was a remote consultation. This saved many people with serious health issues the time and inconvenience associated with a trip to a hospital or doctor’s office. The increased use of telemedicine is likely to be a lasting gain from the pandemic.
The World Has Changed
The pandemic will likely have a lasting impact on the economy and society. The Washington Post’s charts captured part of this story, but in some cases misrepr
The post Correcting the Washington Post’s 11 Charts That Are Supposed to Tell Us How the Economy Changed Since Covid appeared first on Center for Economic and Policy Research.
federal reserve pandemic mortgage rates gdp interest rates

The War Between Knowledge And Stupidity


Women’s basketball is gaining ground, but is March Madness ready to rival the men’s game?


Sylvester researchers, collaborators call for greater investment in bereavement care


Gen Z, The Most Pessimistic Generation In History, May Decide The Election


“I Can’t Even Save”: Americans Are Getting Absolutely Crushed Under Enormous Debt Load


Illegal Immigrants Leave US Hospitals With Billions In Unpaid Bills


“Extreme Events”: US Cancer Deaths Spiked In 2021 And 2022 In “Large Excess Over Trend”


Problems After COVID-19 Vaccination More Prevalent Among Naturally Immune: Study


Moderna turns the spotlight on long Covid with new initiatives


Looking Back At COVID’s Authoritarian Regimes
-

 Uncategorized3 weeks ago
All Of The Elements Are In Place For An Economic Crisis Of Staggering Proportions
-

 International1 week ago
EyePoint poaches medical chief from Apellis; Sandoz CFO, longtime BioNTech exec to retire
-

 Uncategorized4 weeks ago
California Counties Could Be Forced To Pay $300 Million To Cover COVID-Era Program
-

 Spread & Containment4 days ago
IFM’s Hat Trick and Reflections On Option-To-Buy M&A
-

 Uncategorized3 weeks ago
Apparel Retailer Express Moving Toward Bankruptcy
-

 Uncategorized1 month ago
Industrial Production Decreased 0.1% in January
-

 International1 week ago
Walmart launches clever answer to Target’s new membership program
-

 Uncategorized4 weeks ago
RFK Jr: The Wuhan Cover-Up & The Rise Of The Biowarfare-Industrial Complex