Aurora Cannabis Announces Fiscal 2021 Third Quarter Results
Domestic Medical Net Revenue Steady at $26.9 Million
Strong International Medical Net Revenue of $9.4 Million
Total Cannabis Net Revenue, Excluding Provisions, of $58.4 Million
Business Transformation Plan Continues, Management…
Domestic Medical Net Revenue Steady at $26.9 Million
Strong International Medical Net Revenue of $9.4 Million
Total Cannabis Net Revenue, Excluding Provisions, of $58.4 Million
Business Transformation Plan Continues, Management Expects to Deliver Incremental Cost-Saving Measures of $60 Million to $80 Million Annually
Balance Sheet Remains Strong with ~$525 Million of Cash on Hand at May 12, 2021
Lead Independent Director Ronald Funk Appointed as Chairman, Michael Singer to Remain Board Member
NYSE | TSX: ACB
Aurora Cannabis Inc. (the ” Company ” or ” Aurora “) (NYSE: ACB) (TSX: ACB), the Canadian company defining the future of cannabinoids worldwide, today announced its financial and operational results for the third quarter of fiscal 2021 ended March 31, 2021 .
“Consistent with many of our peers, the quarter presented challenges in the Canadian adult-use segment. This reinforces the importance of Aurora’s broadly diversified business model that balances domestic medical, international medical, and adult-use platforms,” stated Miguel Martin , Chief Executive Officer of Aurora Cannabis. “To that point, we delivered the strongest performance in domestic medical and the best results in international medical cannabis of any Canadian LP during the period. This is critical, because we expect being #1 by revenue in Canada’s medical market, the largest federally regulated medical market globally, should translate into global adult-use success in the future as medical regimes evolve to adult-use markets. In addition, being the #2 largest Canadian LP by global cannabis sales this quarter, and a leader across multiple markets and segments, gives Aurora the brand recognition and clout to pursue numerous incremental opportunities around the world.”
“Aurora also announced today that our cost structure transformation continues and we have identified further cost savings of $60 million to $80 million annually that are expected to be achieved within eighteen months and are incremental to the ~$300 million in annual savings already achieved. We anticipate that this initiative will not only allow us to meet our financial objectives while the Canadian adult-use market normalizes over the next several quarters, but will not have any effect on future revenue growth. We have recently added Alex Miller and Lori Schick to the team; two highly respected leaders in the areas of operations and human resources, respectively, to accelerate the execution of our corporate objectives. They each bring 20 plus years of transformative regulated industry experience and are already fully engaged. Lastly, our balance sheet remains strong with approximately $525 million in cash. This will allow us to support organic growth as well as opportunistic M&A, particularly in the U.S.”
Third Quarter 2021 Highlights (Unless otherwise stated, comparisons are made between fiscal Q3 2021 and Q3 2020 results and are in Canadian dollars)
Q3 2021 total cannabis net revenue 1 before provisions was $58.4 million , a 19.5% decrease over Q3 2020 and a 17.0% sequential decline. After accounting for return and price provisions, Q3 2021 total cannabis net revenue was $55.2 million , a 20.8% decrease in cannabis net revenue 1 over fiscal Q3 of the prior year.
Reflecting the shift in mix toward our medical businesses, the Q3 2021 average net selling price per gram of dried cannabis 1 increased to $5.00 per gram from $4.64 in Q3 2020 and $4.45 in Q2 2021. This excludes the impact of the Q3 2021 bulk wholesale of excess lower-potency cannabis flower at clear-out pricing.
Adjusted gross margin before fair value adjustments on cannabis net revenue 1 was 44% in Q3 2021, versus 43% in Q3 2020. The increase in adjusted gross margin is due to a significant shift in revenue mix towards our medical markets which command much higher average net selling prices, partially offset by the purposeful reduction in production levels at Sky resulting in charges related to under-utilization of capacity.
Adjusted EBITDA 1 loss was $24.0 million in Q3 2021 ( $16.7 million loss excluding restructuring charges and product swap provisions) compared to the prior year Adjusted EBITDA loss 1 of $49.6 million primarily driven by the substantial decrease in SG&A and R&D expenses and continued healthy gross margins.
______________________
1 These terms are non-GAAP measures, see “Non-GAAP Measures” below.
Medical cannabis:
Medical cannabis net revenue 1 was $36.4 million , a 17% increase from the prior year period. The increase was primarily attributable to a continued strong performance in both the international and Canadian medical businesses. International medical sales grew by 134% over the prior year comparative period.
Adjusted gross margin before fair value adjustments on medical cannabis net revenue 1 was 59% versus 60% in the prior year, remaining strong despite the increase in cost of sales from the under-utilized capacity at Aurora Sky and the continued ramp up of the Aurora Nordic facility in Europe .
Consumer cannabis:
Consumer cannabis net revenue 1 was $18.0 million ( $21.3 million excluding provisions), a 53% decrease from the prior year. This was due primarily to Covid-19 related challenges across Canada in both provincial distributors and consumer access to in-store retail shopping. Also impacting the change in Consumer cannabis net revenue in fiscal Q3 were Aurora’s one-time transition to our new contract sales force, and the load-in of 2.0 products and the Daily Special launch in the prior year comparative period.
Adjusted gross margin before fair value adjustments on consumer cannabis net revenue 1 was 21% versus 28% in the prior year period, primarily driven by a $1.8 million increase in cost of sales due to under-utilized capacity as a result of the scaling back production at Aurora Sky (expected to partially reverse in future quarters), and a decrease in the average net selling price per gram of consumer cannabis as a result of price compression.
Selling, General and Administrative (“SG&A”):
SG&A, including Research and Development (“R&D”), was $45.1 million ( $41.9 million excluding restructuring costs), down $32.8 million or 42% from the prior year period as a result of the Company’s Business Transformation Plan.
Additional Financial Information:
Cash balance at May 12, 2021 was approximately $525 million .
As previously announced on December 15, 2020 , Aurora has aligned production to current demand and reduced network complexity in order to improve its operational flexibility and cashflow. The Company is currently operating Aurora Sky at 25% capacity, and in fiscal Q3 2021 produced 14,484 kilograms of cannabis and achieved net sales of 13,520 kilograms.
Fiscal Q3 2021 Cash Use:
In Q3 2021, despite a decline in Canadian consumer revenue, the Company managed cash flow tightly using $35.9 million in cash to fund operations, excluding working capital investments and restructuring costs and other costs of $5.4 million . Cash used to pay for capital expenditures, net of disposals, in Q3 2021 was $12.2 million versus $83.9 million in Q3 2020 and $8.8 million in Q2 2021. Cash used in operations and for capital expenditures are crucial metrics in Aurora’s drive toward generating sustainable positive free cash flow, and both have improved significantly over the past year. The Company’s ongoing business transformation, with the additional cost efficiency savings described earlier, is expected to move the operating cash flow metric in a positive direction over the coming quarters.
Net working capital used $25.0 million in the quarter, driven by a decrease in accounts payable and an increase in biological assets. Q3 2021 saw Aurora bring production levels into alignment with demand as 14,484 kilograms of cannabis were produced and 13,520 kilograms equivalents were sold, a marked improvement over prior quarters. The remaining government wage subsidy accrual of $19.7 million initially recorded in December 2020 was collected in April 2021 . With the balancing of production with sales, had this wage subsidy accrual been collected in March 2021 , the Company’s net investment in working capital would have been approximately $5.3 million in the quarter.
The main components of cash source and use in Q3 2021 were as follows:
($ thousands)
Q3 2021
Q3 2020 (4)
Q2 2021
Cash Flow
Cash, Opening
$434,386
$201,336 (2)
$133,678
Cash used in operations
($41,266)
($57,853)
($36,753)
Working capital change
($25,029)
$2,836
($30,433)
Capital expenditures
($12,240)
($83,803)
($8,837)
Debt and interest payments
($7,766)
($60,770)
($8,559)
Cash use
($86,301)
($199,590)
($84,582)
Proceeds raised from sale of marketable securities and investments in associates
–
–
$6,135
Proceeds raised through debt
–
$22,000
–
Proceeds raised through equity financing (1)
$172,153
$206,462
$379,155
Cash raised
$172,153
$228,462
$385,290
Cash, Ending (3)
$520,238
$230,208
$434,386
(1)
Includes impact of foreign exchange rates on USD cash raised from financing
(2)
Includes restricted cash of $45.0M for Q3 2020 held as cash collateral under the BMO Credit Facility.
(3)
Ending cash balance above includes restricted cash of $50.0M for Q3 and Q2 2021, as required under the amended BMO Credit Facility. The restricted cash can be used to repay, at any time at the Company’s discretion the outstanding principal on its term loan on a 1:1 basis with a corresponding reduction in the restricted cash balance requirement.
(4)
Previous reported amounts have been restated to adjust for the change in accounting policy for inventory costing relating to by-products and the allocation of production management staff salaries. Refer to Note 2(e) of the unaudited Condensed Consolidated Interim Financial Statements for a reconciliation on the change in accounting policy.
Refer to “Condensed Consolidated Interim Statement of Cash Flows” in the “Condensed Consolidated Interim Financial Statements (unaudited)” for our cash flow statements prepared in accordance with IAS 7 – Statement of Cash Flows.
($ thousands, except Operational Results)
Q3 2021
Q3 2020 (6)
$ Change
% Change
Q2 2021
$ Change
% Change
Financial Results
Total net revenue (1)
$55,161
$73,541
($18,380)
(25)
%
$67,673
($12,512)
(18)
%
Cannabis net revenue (1)(2)(3a)
$55,161
$69,637
($14,476)
(21)
%
$67,673
($12,512)
(18)
%
Medical cannabis net revenue (2)(3a)
$36,378
$31,086
$5,292
17
%
$38,856
($2,478)
(6)
%
Consumer cannabis net revenue (1)(2)(3a)
$18,023
$38,551
($20,528)
(53)
%
$28,573
($10,550)
(37)
%
Wholesale bulk cannabis net revenue (2)(3a)
$760
$—
$760
N/A
$244
$516
211
%
Adjusted gross margin before FV adjustments on cannabis net revenue (2)(3b)(7)
44
%
43
%
N/A
1
%
42
%
N/A
2
%
Adjusted gross margin before FV adjustments on medical cannabis net revenue (2)(3b)(7)
59
%
60
%
N/A
(1)
%
56
%
N/A
3
%
Adjusted gross margin before FV adjustments on consumer cannabis net revenue (2)(3b)(7)
21
%
28
%
N/A
(7)
%
27
%
N/A
(6)
%
Adjusted gross margin before FV adjustments on wholesale bulk cannabis net revenue (2)(3b)(7)
(140)
%
N/A
N/A
(140)
%
(305)
%
N/A
165
%
SG&A expense (7)
$41,684
$72,318
($30,634)
(42)
%
$41,972
($288)
(1)
%
R&D expense
$3,398
$5,601
($2,203)
(39)
%
$2,432
$966
40
%
Adjusted EBITDA (2)(3c)(7)
($24,020)
($49,579)
$25,559
(52)
%
($16,802)
($7,218)
43
%
Balance Sheet
Working capital (7)
$642,512
$429,293
$213,219
50
%
$592,746
$49,766
8
%
Cannabis inventory and biological assets (2)(4)(7)
$98,839
$225,966
($127,127)
(56)
%
$179,502
($80,663)
(45)
%
Total assets (7)
$2,835,357
$4,699,137
($1,863,780)
(40)
%
$2,830,190
$5,167
0
%
Operational Results – Cannabis
Average net selling price of dried cannabis (2)
$3.59
$4.64
($1.05)
(23)
%
$4.12
($0.53)
(13)
%
Kilograms sold (5)
13,520
12,729
791
6
%
15,253
(1,733)
(11)
%
(1)
Includes the impact of actual and expected product returns and price adjustments (Q3 2021 – $3.2 million; Q2 2021 – $2.7 million; Q3 2020 – $2.9 million).
(2)
These terms are defined in the ” Cautionary Statement Regarding Certain Non-GAAP Performance Measures ” of the MD&A.
(3)
Refer to the following sections for reconciliation of non-GAAP measures to the IFRS equivalent measure:
a.
Refer to the ” Revenue ” section for a reconciliation of cannabis net revenue to the IFRS equivalent.
b.
Refer to the ” Cost of Sales and Gross Margin ” section for reconciliation to the IFRS equivalent.
c.
Refer to the ” Adjusted EBITDA” section for reconciliation to the IFRS equivalent.
(4)
Represents total biological assets and cannabis inventory, exclusive of merchandise, accessories, supplies and consumables.
(5)
The kilograms sold is offset by the grams returned during the period.
(6)
As a result of the Company’s divestment of its wholly owned subsidiaries, Aurora Larssen Projects (“ALPS”) and Aurora Hemp Europe (“AHE”), the operations of ALPS and AHE have been presented as discontinued operations and the Company’s operational results have been retroactively restated, as required. Refer to Note 11(b) of the Financial Statements for more information about the divestitures.
(7)
Amounts have been retroactively restated for the change in accounting policy for inventory costing relating to by-products and the allocation of production management staff salaries. Refer to the ” Change in Accounting Policies ” section in Note 2(e) of the Financial Statements.
Operational Efficiency Plan
Today Aurora announced a plan to accelerate $60 million to $80 million in annualized cost efficiencies which are expected to be realized over the next 12-18 months. The efficiencies are expected to be $40 million – $60 million in costs of goods sold (“COGS”) and approximately $20 million in SG&A, and relate primarily to production costs, facility and logistic expenses, organizational efficiencies, insurance and capital markets related expenses. These efficiencies are incremental to the approximately $300 million of total annualized expense reductions achieved since the announcement of the Company’s Business Transformation Plan in February 2020 .
Executive Board Transitions and Recent Executive Leadership Appointments
Aurora is pleased to announce that Mr. Ronald Funk , lead independent Director, has assumed the role of Chairman, effective immediately. Mr. Michael Singer has reverted from Executive Chairman to the Board seat he has occupied since May 2016 . This transition reflects the strength of current management and the Board’s planned governance enhancements to include an independent Chairman.
Mr. Funk has 30+ years in senior executive roles managing profitable regulated CPG brands. He brings unique skills and experiences that will assist the Company in the pursuit of global growth. He has served on the Board for three years and has proven himself to be an effective leader as the Company has grown and evolved. Mr. Singer has served as Interim CEO from February to September 2020 , during which time he managed the Company’s business transformation towards profitability and transitioning management, including the hiring of CEO Miguel Martin .
Aurora has also announced the appointment of Mr. Alex Miller to the role of Executive Vice President, Supply Chain and Ms. Lori Schick to the role of Executive Vice President, Human Resources. Alex Miller brings 25+ years of experience in food, CPG and pharmaceutical industry experience in operations and supply chain leadership positions, most recently as Vice President, Operations at MAV Beauty Brands Inc. Lori Schick brings 20+ years of global human resources leadership experience leading organizational transformation and building high performance teams. Most recently Lori was Senior Vice President and Head of People at Holt, Renfrew & Co.
Stock Exchange Listing Transfer to NASDAQ from NYSE
Aurora also announced that it will transfer its U.S. stock exchange listing from the New York Stock Exchange (“NYSE”) to The Nasdaq Global Select Market (“Nasdaq”), effective May 24, 2021 , after the market close. The last day of trading of the Company’s common stock on NYSE is expected to be May 24, 2021 . The Company expects its common stock will begin trading as a Nasdaq-listed security at market open on May 25, 2021 and will continue to be listed under the ticker symbol “ACB”. The transfer is automatic, and shareholders are not required to take any action. This transition will not impact the Company’s primary listing on the Toronto Stock Exchange (TSX: ACB).
“Nasdaq represents a good fit for Aurora and this listing transfer will enable us to realize cost efficiencies as part of our efforts to deliver long-term value to shareholders,” concluded Martin.
Filing of Prospectus Supplement
Aurora intends to file a new prospectus supplement for a U.S. $300 million At-the-Market offering program (“ATM”). This is a routine filing which Aurora believes will provide maximum flexibility to pursue select acquisitions going forward, including within the U.S. Given the strength of Aurora’s current cash position, it is not expected to need to access the ATM facility without an accretive use of proceeds.
Conference Call
Aurora will host a conference call today, May 13, 2021, to discuss these results. Miguel Martin, Chief Executive Officer, and Glen Ibbott , Chief Financial Officer, will host the call starting at 5:00 p.m. Eastern time / 3:00 p.m. Mountain Time . A question and answer session will follow management’s presentation.
Conference Call Details
DATE:
Thursday, May 13, 2021
TIME:
5:00 p.m. Eastern Time | 3:00 p.m. Mountain Time
WEBCAST:
http://public.viavid.com/index.php?id=144524
About Aurora
Aurora is a global leader in the cannabis industry serving both the medical and consumer markets. Headquartered in Edmonton, Alberta , Aurora is a pioneer in global cannabis dedicated to helping people improve their lives. The Company’s brand portfolio includes Aurora, Aurora Drift, San Rafael ’71, Daily Special, AltaVie, MedReleaf, CanniMed, Whistler, and Reliva CBD. Providing customers with innovative, high-quality cannabis products, Aurora’s brands continue to break through as industry leaders in the medical, performance, wellness and recreational markets wherever they are launched. For more information, please visit our website at www.auroramj.com .
Aurora’s common shares trade on the TSX and NYSE under the symbol “ACB”, and is a constituent of the S&P/TSX Composite Index.
Forward Looking Statements
This news release includes statements containing certain “forward-looking information” within the meaning of applicable securities law (“forward-looking statements”). Forward-looking statements are frequently characterized by words such as “plan”, “continue”, “expect”, “project”, “intend”, “believe”, “anticipate”, “estimate”, “may”, “will”, “potential”, “proposed” and other similar words, or statements that certain events or conditions “may” or “will” occur. Forward looking statements made in this news release include the Company’s expectations of the impact of its current market position on its future prospects, future cost savings and their expected impact on revenue, the anticipated transfer of the Company’s listing to NASDAQ and its expected –the-market offering impact on cost savings, and the anticipated filing of a prospectus supplement for an at the-market offering. These forward-looking statements are only predictions. Various assumptions were used in drawing the conclusions or making the projections contained in the forward-looking statements throughout this news release. Forward looking statements are based on the opinions, estimates and assumptions of management in light of management’s experience and perception of historical trends, current conditions and expected developments at the date the statements are made, such as current and future market conditions, the ability to maintain SG&A costs in line with current expectations, the ability to achieve high margin revenues in the Canadian consumer market, the current and future regulatory environment and future approvals and permits. Forward-looking statements are subject to a variety of risks, uncertainties and other factors that management believes to be relevant and reasonable in the circumstances could cause actual events, results, level of activity, performance, prospects, opportunities or achievements to differ materially from those projected in the forward-looking statements, including the risks associated with: entering the U.S. market, the ability to realize the anticipated benefits associated with the acquisition of Reliva and other acquisitions (if any), achievement of Aurora’s business transformation plan, general business and economic conditions, changes in laws and regulations, product demand, changes in prices of required commodities, competition, the effects of and responses to the COVID-19 pandemic and other risks, uncertainties and factors set out under the heading “Risk Factors” in the Company’s annual information form dated September 24, 2020 (the “AIF”) and filed with Canadian securities regulators available on the Company’s issuer profile on SEDAR at www.sedar.com and filed with and available on the SEC’s website at www.edgar.gov . The Company cautions that the list of risks, uncertainties and other factors described in the AIF is not exhaustive and other factors could also adversely affect its results. Readers are urged to consider the risks, uncertainties and assumptions carefully in evaluating the forward-looking statements and are cautioned not to place undue reliance on such information. The Company is under no obligation, and expressly disclaims any intention or obligation, to update or revise any forward-looking statements, whether as a result of new information, future events or otherwise, except as expressly required by applicable securities law.
Non-GAAP Measures
The Company uses certain financial performance measures that are not recognized or defined under IFRS (termed “Non-GAAP Measures”). As a result, this data may not be comparable to data presented by other licensed producers of cannabis and cannabis companies. For an explanation of these measures to related comparable financial information presented in the consolidated financial statements prepared in accordance with IFRS, refer to the discussion below. The Company believes that these Non-GAAP Measures are useful indicators of operating performance and are specifically used by management to assess the financial and operational performance of the Company. These Non-GAAP Measures include, but are not limited, to the following:
Cannabis net revenue represents revenue from the sale of cannabis products, excluding excise taxes. Cannabis net revenue is further broken down as follows:
Medical cannabis net revenue represents Canadian and international cannabis net revenue for medical cannabis sales only, excluding wholesale bulk cannabis net revenue.
Consumer cannabis net revenue represents cannabis net revenue for consumer cannabis sales only.
Wholesale bulk cannabis net revenue represents cannabis net revenue for wholesale bulk sales only.
Management believes the cannabis net revenue measures provide more specific information about the net revenue purely generated from our core cannabis business and by market type.
Average net selling price per gram and gram equivalent is calculated by taking cannabis net revenue and removing the impact of cost of sales net against revenue in agency relationships, which is then divided by total grams and grams equivalent of cannabis sold in the period. Average net selling price per gram and gram equivalent is further broken down as follows:
Average net selling price per gram of dried cannabis represents the average net selling price per gram for dried cannabis sales only, excluding wholesale bulk cannabis sold in the period.
Average net selling price per gram and gram equivalent of consumer cannabis represents the average net selling price per gram and gram equivalent for dried cannabis and cannabis derivatives sold in the consumer market
Management believes the average net selling price per gram or gram equivalent measures provide more specific information about the pricing trends over time by product and market type. Under an agency relationship, revenue is recognized net of cost of sales in accordance with IFRS. Management believes the removal of agency cost of sales in determining the average net selling price per gram and gram equivalent is more reflective of our average net selling price generated in the marketplace.
Adjusted gross profit before FV adjustments on cannabis net revenue represents cash gross profit and gross margin on cannabis net revenue and is calculated by subtracting from total cannabis net revenue (i) cost of sales, before the effects of changes in FV of biological assets and inventory; (ii) cost of sales from non-cannabis auxiliary support functions; and removing (iii) depreciation in cost of sales; and (iv) cannabis inventory impairment. Adjusted gross margin before FV adjustments on cannabis net revenue is calculated by dividing adjusted gross profit before FV adjustments on cannabis net revenue divided by cannabis net revenue. Adjusted gross profit and gross margin before FV adjustments on cannabis net revenue is further broken down as follows:
Adjusted gross profit and gross margin before FV adjustments on medical cannabis net revenue represents adjusted gross profit and gross margin before FV adjustments on sales generated in the medical market only.
Adjusted gross profit and gross margin before FV adjustments on consumer cannabis net revenue represents adjusted gross profit and gross margin before FV adjustments on sales generated in the consumer market only.
Adjusted gross profit and gross margin before FV adjustments on wholesale bulk cannabis net revenue represents adjusted gross profit and gross margin before FV adjustments on sales generated from wholesale bulk cannabis only.
Management believes that these measures provide useful information to assess the profitability of our cannabis operations as it represents the cash gross profit and margin generated from cannabis operations and excludes the effects of non-cash FV adjustments on inventory and biological assets, which are required by IFRS.
Adjusted EBITDA is calculated as net income (loss) excluding interest income (expense), accretion, income taxes, depreciation, amortization, changes in fair value of inventory sold, changes in fair value of biological assets, share-based compensation, acquisition costs, foreign exchange, share of income (losses) from investment in associates, government grant income, fair value gains and losses on financial instruments, gains and losses on deemed disposal, losses on disposal of assets, restructuring charges, onerous contract provisions, and non-cash impairments of deposits, property, plant and equipment, equity investments, intangibles, goodwill, and other assets. Adjusted EBITDA is intended to provide a proxy for the Company’s operating cash flow and is widely used by industry analysts to compare Aurora to its competitors, and derive expectations of future financial performance for Aurora. Adjusted EBITDA increases comparability between comparative companies by eliminating variability resulting from differences in capital structures, management decisions related to resource allocation, and the impact of FV adjustments on biological assets and inventory and financial instruments, which may be volatile and fluctuate significantly from period to period.
Non-GAAP measures should be considered together with other data prepared accordance with IFRS to enable investors to evaluate the Company’s operating results, underlying performance and prospects in a manner similar to Aurora’s management. Accordingly, these non-GAAP measures are intended to provide additional information and should not be considered in isolation or as a substitute for measures of performance prepared in accordance with IFRS.
Reconciliation of Non-GAAP Measures
Net Revenue
Three months ended
March 31, 2021
March 31, 2020 (1)
December 31, 2020
Medical cannabis net revenue
36,378
31,086
38,856
Consumer cannabis net revenue
18,023
38,551
28,573
Wholesale bulk cannabis net revenue
760
–
244
Total cannabis net revenue
55,161
69,637
67,673
Total net revenue
55,161
73,541
67,673
(1)
As a result of the Company’s divestment of its wholly owned subsidiaries ALPS and AHE, the operations of ALPS and AHE have been presented as discontinued operations and the Company’s results have been retroactively restated, as required. Refer to Note 11(b) of the Financial Statements for information about the divestitures.
Adjusted Gross Margin
($ thousands)
Medical Cannabis
Consumer Cannabis
Wholesale
Bulk Cannabis
Ancillary Support Functions
Total
Three months ended March 31, 2021
Gross revenue
39,457
23,828
760
—
64,045
Excise taxes
(3,079)
(5,805)
—
—
(8,884)
Net revenue
36,378
18,023
760
—
55,161
Cost of sales
(74,473)
(50,105)
(2,967)
—
(127,545)
Gross profit (loss) before FV adjustments (1)
(38,095)
(32,082)
(2,207)
—
(72,384)
Depreciation
5,169
3,121
100
—
8,390
Inventory impairment in cost of sales
54,226
32,749
1,045
—
88,020
Adjusted gross profit (loss) before FV adjustments (1)
21,300
3,788
(1,062)
—
24,026
Adjusted gross margin before FV adjustments (1)
59
%
21
%
(140)
%
—
%
44
%
Three months ended March 31, 2020 (2)(3)
Gross revenue
34,339
49,387
—
3,904
87,630
Excise taxes
(3,253)
(10,836)
—
—
(14,089)
Net revenue
31,086
38,551
—
3,904
73,541
Cost of sales
(15,422)
(32,115)
—
(3,119)
(50,656)
Gross profit (loss) before FV adjustments (1)
15,664
6,436
—
785
22,885
Depreciation
3,113
4,477
—
—
7,590
Adjusted gross profit (loss) before FV adjustments (1)
18,777
10,913
—
785
30,475
Adjusted gross margin before FV adjustments (1)
60
%
28
%
—
%
20
%
41
%
Three months ended December 31, 2020
Gross revenue
41,872
37,459
244
—
79,575
Excise taxes
(3,016)
(8,886)
—
—
(11,902)
Net revenue
38,856
28,573
244
—
67,673
Cost of sales
(23,946)
(25,681)
(1,017)
—
(50,644)
Gross profit before FV adjustments (1)
14,910
2,892
(773)
—
17,029
Depreciation
6,376
4,472
29
—
10,877
Inventory impairment in cost of sales
333
406
—
—
739
Adjusted gross profit before FV adjustments (1)
21,619
7,770
(744)
—
28,645
Adjusted gross margin before FV adjustments (1)
56
%
27
%
(305)
%
—
%
42
%
(1)
These terms are defined in the “Cautionary Statement Regarding Certain Non-GAAP Performance Measures” of the MD&A.
(2)
Amounts have been retroactively restated for the change in accounting policy for inventory costing relating to by-products and the allocation of production management staff salaries. Refer to the ” Change in Accounting Policies ” section below for further detail.
(3)
As a result of the Company’s divestment of its wholly owned subsidiaries, ALPS and AHE, the operations of ALPS and AHE have been presented as discontinued operations and the Company’s operational results have been retroactively restated, as required. Refer to Note 11(b) of the Financial Statements for more information about the divestiture. Discontinued operations, from ALPS and AHE, had incurred an adjusted gross profit before FV adjustments of $0.1 million for the three months ended March 31, 2020. ALPS generated no adjusted gross profit before FV adjustments in the three months ended March 31, 2020.
Adjusted EBITDA
($ thousands)
Three months ended
Nine months ended
March 31, 2021
March 31, 2020 (1)(2)
December 31, 2020
March 31, 2021 (2)
March 31, 2020 (1)(2)
Net (loss) income from continuing operations
(164,650)
(133,528)
(292,788)
(564,598)
(1,424,466)
Finance costs
16,990
6,655
18,872
50,553
48,364
Interest (income) expense
(1,467)
(1,998)
(1,865)
(4,599)
(4,884)
Income tax expense (recovery)
(129)
(12,441)
3,167
3,649
(18,873)
Depreciation and amortization
15,570
22,538
24,883
62,897
73,090
EBITDA
(133,686)
(118,774)
(247,731)
(452,098)
(1,326,769)
Changes in fair value of inventory sold
29,583
14,144
5,942
38,829
48,672
Unrealized gain on changes in fair value of biological assets
(16,506)
(10,904)
(6,262)
(28,175)
(44,735)
Share-based compensation
5,233
8,904
5,987
18,081
53,155
Acquisition costs
—
1,300
—
1,104
4,323
Foreign exchange loss (gain)
7,035
12,280
527
135
16,181
Share of loss from investment in associates
9
4,611
117
499
8,933
Government grant income
(4,692)
—
(23,678)
(28,370)
—
Losses (gains) on financial instruments (3)
(2,566)
(6,416)
17,309
22,109
30,413
Loss on loss of control of subsidiary
—
(500)
—
—
(500)
Losses (gains) on deemed disposal of significant influence investment
(204)
—
—
1,239
—
Gains (losses) on disposal of assets held for sale and property, plant, and equipment
(1,595)
—
(3,317)
(3,990)
—
Restructuring charges
801
—
—
1,011
—
Onerous contract provision
—
—
2,000
2,000
—
Impairment of deposit, inventory, investment in associate, property, plant and equipment, intangibles, and goodwill
92,568
45,776
232,304
328,913
1,057,825
Adjusted EBITDA (4)
(24,020)
(49,579)
(16,802)
(98,713)
(152,002)
(1)
Amounts have been retroactively restated for the change in accounting policy for inventory costing relating to by-products and the allocation of production management staff salaries. Refer to the ” Change in Accounting Policies ” in Note 2(e) of the Financial Statements.
(2)
As a result of the Company’s divestment of its wholly owned subsidiaries ALPS and AHE, the operations of ALPS and AHE have been presented as discontinued operations and the Company’s operational results have been retroactively restated, as required. Refer to Note 11(b) of the Financial Statements for more information about the divestiture. Including the results of ALPS and AHE, adjusted EBITDA loss would have been $52.3 million for the three months ended March 31, 2020, and $99.2 million and $162.3 million for the nine months ended March 31, 2021 and 2020, respectively.
(3)
Includes fair value changes on derivative investments, derivative liabilities, contingent consideration, loss on induced conversion of debentures, and (gain) loss on the modification of debt. Refer to Note 21 of the Financial Statements.
(4)
Adjusted EBITDA is a non-GAAP financial measure and is not a recognized, defined, or standardized measure under IFRS. Refer to “Cautionary Statement Regarding Certain Non-GAAP Performance Measures” section of the MD&A.
Included in the three months ended March 31, 2021 Adjusted EBITDA loss is $2.2 million (three months ended December 31, 2020 – $0.8 million ) legal settlement and contract termination fees and $3.2 million (three months ended December 31, 2020 – $2.1 million ) related to restructuring charges, severance and benefits associated with the business transformation plan, and $1.9 million (three months ended December 31, 2020 – $1.8 million ) in revenue provisions as a result of our Company initiated product swap to replace low quality product with higher potency product at the provinces. Excluding these impacts, Adjusted EBITDA loss is $16.7 million (three months ended December 31, 2020 – $12.1 million ).
Chronic stress and inflammation linked to societal and environmental impacts in new study
From anxiety about the state of the world to ongoing waves of Covid-19, the stresses we face can seem relentless and even overwhelming. Worse, these stressors…
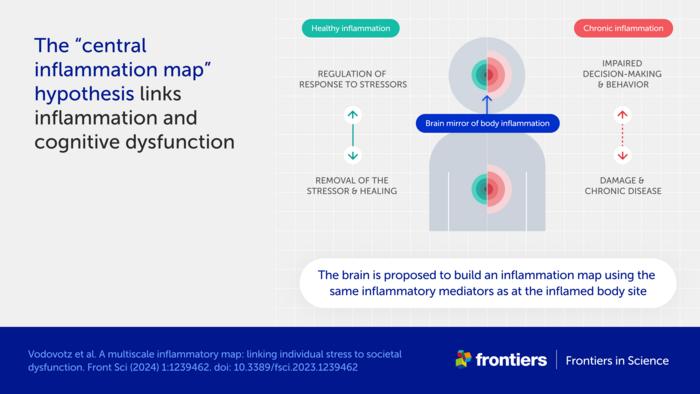
From anxiety about the state of the world to ongoing waves of Covid-19, the stresses we face can seem relentless and even overwhelming. Worse, these stressors can cause chronic inflammation in our bodies. Chronic inflammation is linked to serious conditions such as cardiovascular disease and cancer – and may also affect our thinking and behavior.
Credit: Image: Vodovotz et al/Frontiers
From anxiety about the state of the world to ongoing waves of Covid-19, the stresses we face can seem relentless and even overwhelming. Worse, these stressors can cause chronic inflammation in our bodies. Chronic inflammation is linked to serious conditions such as cardiovascular disease and cancer – and may also affect our thinking and behavior.
A new hypothesis published in Frontiers in Science suggests the negative impacts may extend far further.
“We propose that stress, inflammation, and consequently impaired cognition in individuals can scale up to communities and populations,” explained lead author Prof Yoram Vodovotz of the University of Pittsburgh, USA.
“This could affect the decision-making and behavior of entire societies, impair our cognitive ability to address complex issues like climate change, social unrest, and infectious disease – and ultimately lead to a self-sustaining cycle of societal dysfunction and environmental degradation,” he added.
Bodily inflammation ‘mapped’ in the brain
One central premise to the hypothesis is an association between chronic inflammation and cognitive dysfunction.
“The cause of this well-known phenomenon is not currently known,” said Vodovotz. “We propose a mechanism, which we call the ‘central inflammation map’.”
The authors’ novel idea is that the brain creates its own copy of bodily inflammation. Normally, this inflammation map allows the brain to manage the inflammatory response and promote healing.
When inflammation is high or chronic, however, the response goes awry and can damage healthy tissues and organs. The authors suggest the inflammation map could similarly harm the brain and impair cognition, emotion, and behavior.
Accelerated spread of stress and inflammation online
A second premise is the spread of chronic inflammation from individuals to populations.
“While inflammation is not contagious per se, it could still spread via the transmission of stress among people,” explained Vodovotz.
The authors further suggest that stress is being transmitted faster than ever before, through social media and other digital communications.
“People are constantly bombarded with high levels of distressing information, be it the news, negative online comments, or a feeling of inadequacy when viewing social media feeds,” said Vodovotz. “We hypothesize that this new dimension of human experience, from which it is difficult to escape, is driving stress, chronic inflammation, and cognitive impairment across global societies.”
Inflammation as a driver of social and planetary disruption
These ideas shift our view of inflammation as a biological process restricted to an individual. Instead, the authors see it as a multiscale process linking molecular, cellular, and physiological interactions in each of us to altered decision-making and behavior in populations – and ultimately to large-scale societal and environmental impacts.
“Stress-impaired judgment could explain the chaotic and counter-intuitive responses of large parts of the global population to stressful events such as climate change and the Covid-19 pandemic,” explained Vodovotz.
“An inability to address these and other stressors may propagate a self-fulfilling sense of pervasive danger, causing further stress, inflammation, and impaired cognition in a runaway, positive feedback loop,” he added.
The fact that current levels of global stress have not led to widespread societal disorder could indicate an equally strong stabilizing effect from “controllers” such as trust in laws, science, and multinational organizations like the United Nations.
“However, societal norms and institutions are increasingly being questioned, at times rightly so as relics of a foregone era,” said Prof Paul Verschure of Radboud University, the Netherlands, and a co-author of the article. “The challenge today is how we can ward off a new adversarial era of instability due to global stress caused by a multi-scale combination of geopolitical fragmentation, conflicts, and ecological collapse amplified by existential angst, cognitive overload, and runaway disinformation.”
Reducing social media exposure as part of the solution
The authors developed a mathematical model to test their ideas and explore ways to reduce stress and build resilience.
“Preliminary results highlight the need for interventions at multiple levels and scales,” commented co-author Prof Julia Arciero of Indiana University, USA.
“While anti-inflammatory drugs are sometimes used to treat medical conditions associated with inflammation, we do not believe these are the whole answer for individuals,” said Dr David Katz, co-author and a specialist in preventive and lifestyle medicine based in the US. “Lifestyle changes such as healthy nutrition, exercise, and reducing exposure to stressful online content could also be important.”
“The dawning new era of precision and personalized therapeutics could also offer enormous potential,” he added.
At the societal level, the authors suggest creating calm public spaces and providing education on the norms and institutions that keep our societies stable and functioning.
“While our ‘inflammation map’ hypothesis and corresponding mathematical model are a start, a coordinated and interdisciplinary research effort is needed to define interventions that would improve the lives of individuals and the resilience of communities to stress. We hope our article stimulates scientists around the world to take up this challenge,” Vodovotz concluded.
The article is part of the Frontiers in Science multimedia article hub ‘A multiscale map of inflammatory stress’. The hub features a video, an explainer, a version of the article written for kids, and an editorial, viewpoints, and policy outlook from other eminent experts: Prof David Almeida (Penn State University, USA), Prof Pietro Ghezzi (University of Urbino Carlo Bo, Italy), and Dr Ioannis P Androulakis (Rutgers, The State University of New Jersey, USA).
Journal
Frontiers in Science
DOI
10.3389/1239462
Method of Research
Computational simulation/modeling
Subject of Research
Not applicable
Article Title
A multiscale inflammatory map: linking individual stress to societal dysfunction
Article Publication Date
12-Mar-2024
COI Statement
YV is a cofounder of, and stakeholder in, Immunetrics, Inc. and a consultant to Anuna AI. PFMJV is the founder of, and stakeholder in, Eodyne Systems s.l. and Sapiens5 Holding BV. DLK was employed by Tangelo – Intend, Inc. Neither these companies nor the funders mentioned above were involved in the study design, data collection, analysis, interpretation of data, the writing of this article, or the decision to submit it for publication. The companies mentioned above also did not provide funding for the study. The remaining author declares that the research was conducted in the absence of any commercial or financial relationships that could be construed as a potential conflict of interest. The authors YV and PV declared that they are editorial board members of Frontiers, at the time of submission. This had no impact on the peer review process and the final decision.
Acadia’s Nuplazid fails PhIII study due to higher-than-expected placebo effect
After years of trying to expand the market territory for Nuplazid, Acadia Pharmaceuticals might have hit a dead end, with a Phase III fail in schizophrenia…
After years of trying to expand the market territory for Nuplazid, Acadia Pharmaceuticals might have hit a dead end, with a Phase III fail in schizophrenia due to the placebo arm performing better than expected.
Steve Davis
“We will continue to analyze these data with our scientific advisors, but we do not intend to conduct any further clinical trials with pimavanserin,” CEO Steve Davis said in a Monday press release. Acadia’s stock $ACAD dropped by 17.41% before the market opened Tuesday.
Pimavanserin, a serotonin inverse agonist and also a 5-HT2A receptor antagonist, is already in the market with the brand name Nuplazid for Parkinson’s disease psychosis. Efforts to expand into other indications such as Alzheimer’s-related psychosis and major depression have been unsuccessful, and previous trials in schizophrenia have yielded mixed data at best. Its February presentation does not list other pimavanserin studies in progress.
The Phase III ADVANCE-2 trial investigated 34 mg pimavanserin versus placebo in 454 patients who have negative symptoms of schizophrenia. The study used the negative symptom assessment-16 (NSA-16) total score as a primary endpoint and followed participants up to week 26. Study participants have control of positive symptoms due to antipsychotic therapies.
The company said that the change from baseline in this measure for the treatment arm was similar between the Phase II ADVANCE-1 study and ADVANCE-2 at -11.6 and -11.8, respectively. However, the placebo was higher in ADVANCE-2 at -11.1, when this was -8.5 in ADVANCE-1. The p-value in ADVANCE-2 was 0.4825.
In July last year, another Phase III schizophrenia trial — by Sumitomo and Otsuka — also reported negative results due to what the company noted as Covid-19 induced placebo effect.
According to Mizuho Securities analysts, ADVANCE-2 data were disappointing considering the company applied what it learned from ADVANCE-1, such as recruiting patients outside the US to alleviate a high placebo effect. The Phase III recruited participants in Argentina and Europe.
Analysts at Cowen added that the placebo effect has been a “notorious headwind” in US-based trials, which appears to “now extend” to ex-US studies. But they also noted ADVANCE-1 reported a “modest effect” from the drug anyway.
Nonetheless, pimavanserin’s safety profile in the late-stage study “was consistent with previous clinical trials,” with the drug having an adverse event rate of 30.4% versus 40.3% with placebo, the company said. Back in 2018, even with the FDA approval for Parkinson’s psychosis, there was an intense spotlight on Nuplazid’s safety profile.
Acadia previously aimed to get Nuplazid approved for Alzheimer’s-related psychosis but had many hurdles. The drug faced an adcomm in June 2022 that voted 9-3 noting that the drug is unlikely to be effective in this setting, culminating in a CRL a few months later.
As for the company’s next R&D milestones, Mizuho analysts said it won’t be anytime soon: There is the Phase III study for ACP-101 in Prader-Willi syndrome with data expected late next year and a Phase II trial for ACP-204 in Alzheimer’s disease psychosis with results anticipated in 2026.
Acadia collected $549.2 million in full-year 2023 revenues for Nuplazid, with $143.9 million in the fourth quarter.
"Beware the Ides of March,” Shakespeare quotes the soothsayer’s warning Julius Caesar about what turned out to be an impending assassination on March 15. The death of American liberty happened around the same time four years ago, when the orders went out from all levels of government to close all indoor and outdoor venues where people gather.
It was not quite a law and it was never voted on by anyone. Seemingly out of nowhere, people who the public had largely ignored, the public health bureaucrats, all united to tell the executives in charge – mayors, governors, and the president – that the only way to deal with a respiratory virus was to scrap freedom and the Bill of Rights.
And they did, not only in the US but all over the world.
The forced closures in the US began on March 6 when the mayor of Austin, Texas, announced the shutdown of the technology and arts festival South by Southwest. Hundreds of thousands of contracts, of attendees and vendors, were instantly scrapped. The mayor said he was acting on the advice of his health experts and they in turn pointed to the CDC, which in turn pointed to the World Health Organization, which in turn pointed to member states and so on.
There was no record of Covid in Austin, Texas, that day but they were sure they were doing their part to stop the spread. It was the first deployment of the “Zero Covid” strategy that became, for a time, official US policy, just as in China.
It was never clear precisely who to blame or who would take responsibility, legal or otherwise.
This Friday evening press conference in Austin was just the beginning. By the next Thursday evening, the lockdown mania reached a full crescendo. Donald Trump went on nationwide television to announce that everything was under control but that he was stopping all travel in and out of US borders, from Europe, the UK, Australia, and New Zealand. American citizens would need to return by Monday or be stuck.
Americans abroad panicked while spending on tickets home and crowded into international airports with waits up to 8 hours standing shoulder to shoulder. It was the first clear sign: there would be no consistency in the deployment of these edicts.
There is no historical record of any American president ever issuing global travel restrictions like this without a declaration of war. Until then, and since the age of travel began, every American had taken it for granted that he could buy a ticket and board a plane. That was no longer possible. Very quickly it became even difficult to travel state to state, as most states eventually implemented a two-week quarantine rule.
The next day, Friday March 13, Broadway closed and New York City began to empty out as any residents who could went to summer homes or out of state.
On that day, the Trump administration declared the national emergency by invoking the Stafford Act which triggers new powers and resources to the Federal Emergency Management Administration.
In addition, the Department of Health and Human Services issued a classified document, only to be released to the public months later. The document initiated the lockdowns. It still does not exist on any government website.
The White House Coronavirus Response Task Force, led by the Vice President, will coordinate a whole-of-government approach, including governors, state and local officials, and members of Congress, to develop the best options for the safety, well-being, and health of the American people. HHS is the LFA [Lead Federal Agency] for coordinating the federal response to COVID-19.
Closures were guaranteed:
Recommend significantly limiting public gatherings and cancellation of almost all sporting events, performances, and public and private meetings that cannot be convened by phone. Consider school closures. Issue widespread ‘stay at home’ directives for public and private organizations, with nearly 100% telework for some, although critical public services and infrastructure may need to retain skeleton crews. Law enforcement could shift to focus more on crime prevention, as routine monitoring of storefronts could be important.
In this vision of turnkey totalitarian control of society, the vaccine was pre-approved: “Partner with pharmaceutical industry to produce anti-virals and vaccine.”
The National Security Council was put in charge of policy making. The CDC was just the marketing operation. That’s why it felt like martial law. Without using those words, that’s what was being declared. It even urged information management, with censorship strongly implied.
The timing here is fascinating. This document came out on a Friday. But according to every autobiographical account – from Mike Pence and Scott Gottlieb to Deborah Birx and Jared Kushner – the gathered team did not meet with Trump himself until the weekend of the 14th and 15th, Saturday and Sunday.
According to their account, this was his first real encounter with the urge that he lock down the whole country. He reluctantly agreed to 15 days to flatten the curve. He announced this on Monday the 16th with the famous line: “All public and private venues where people gather should be closed.”
This makes no sense. The decision had already been made and all enabling documents were already in circulation.
There are only two possibilities.
One: the Department of Homeland Security issued this March 13 HHS document without Trump’s knowledge or authority. That seems unlikely.
Two: Kushner, Birx, Pence, and Gottlieb are lying. They decided on a story and they are sticking to it.
Trump himself has never explained the timeline or precisely when he decided to greenlight the lockdowns. To this day, he avoids the issue beyond his constant claim that he doesn’t get enough credit for his handling of the pandemic.
With Nixon, the famous question was always what did he know and when did he know it? When it comes to Trump and insofar as concerns Covid lockdowns – unlike the fake allegations of collusion with Russia – we have no investigations. To this day, no one in the corporate media seems even slightly interested in why, how, or when human rights got abolished by bureaucratic edict.
As part of the lockdowns, the Cybersecurity and Infrastructure Security Agency, which was and is part of the Department of Homeland Security, as set up in 2018, broke the entire American labor force into essential and nonessential.
They also set up and enforced censorship protocols, which is why it seemed like so few objected. In addition, CISA was tasked with overseeing mail-in ballots.
Only 8 days into the 15, Trump announced that he wanted to open the country by Easter, which was on April 12. His announcement on March 24 was treated as outrageous and irresponsible by the national press but keep in mind: Easter would already take us beyond the initial two-week lockdown. What seemed to be an opening was an extension of closing.
This announcement by Trump encouraged Birx and Fauci to ask for an additional 30 days of lockdown, which Trump granted. Even on April 23, Trump told Georgia and Florida, which had made noises about reopening, that “It’s too soon.” He publicly fought with the governor of Georgia, who was first to open his state.
Before the 15 days was over, Congress passed and the president signed the 880-page CARES Act, which authorized the distribution of $2 trillion to states, businesses, and individuals, thus guaranteeing that lockdowns would continue for the duration.
There was never a stated exit plan beyond Birx’s public statements that she wanted zero cases of Covid in the country. That was never going to happen. It is very likely that the virus had already been circulating in the US and Canada from October 2019. A famous seroprevalence study by Jay Bhattacharya came out in May 2020 discerning that infections and immunity were already widespread in the California county they examined.
What that implied was two crucial points: there was zero hope for the Zero Covid mission and this pandemic would end as they all did, through endemicity via exposure, not from a vaccine as such. That was certainly not the message that was being broadcast from Washington. The growing sense at the time was that we all had to sit tight and just wait for the inoculation on which pharmaceutical companies were working.
By summer 2020, you recall what happened. A restless generation of kids fed up with this stay-at-home nonsense seized on the opportunity to protest racial injustice in the killing of George Floyd. Public health officials approved of these gatherings – unlike protests against lockdowns – on grounds that racism was a virus even more serious than Covid. Some of these protests got out of hand and became violent and destructive.
Meanwhile, substance abuse rage – the liquor and weed stores never closed – and immune systems were being degraded by lack of normal exposure, exactly as the Bakersfield doctors had predicted. Millions of small businesses had closed. The learning losses from school closures were mounting, as it turned out that Zoom school was near worthless.
It was about this time that Trump seemed to figure out – thanks to the wise council of Dr. Scott Atlas – that he had been played and started urging states to reopen. But it was strange: he seemed to be less in the position of being a president in charge and more of a public pundit, Tweeting out his wishes until his account was banned. He was unable to put the worms back in the can that he had approved opening.
By that time, and by all accounts, Trump was convinced that the whole effort was a mistake, that he had been trolled into wrecking the country he promised to make great. It was too late. Mail-in ballots had been widely approved, the country was in shambles, the media and public health bureaucrats were ruling the airwaves, and his final months of the campaign failed even to come to grips with the reality on the ground.
At the time, many people had predicted that once Biden took office and the vaccine was released, Covid would be declared to have been beaten. But that didn’t happen and mainly for one reason: resistance to the vaccine was more intense than anyone had predicted. The Biden administration attempted to impose mandates on the entire US workforce. Thanks to a Supreme Court ruling, that effort was thwarted but not before HR departments around the country had already implemented them.
As the months rolled on – and four major cities closed all public accommodations to the unvaccinated, who were being demonized for prolonging the pandemic – it became clear that the vaccine could not and would not stop infection or transmission, which means that this shot could not be classified as a public health benefit. Even as a private benefit, the evidence was mixed. Any protection it provided was short-lived and reports of vaccine injury began to mount. Even now, we cannot gain full clarity on the scale of the problem because essential data and documentation remains classified.
After four years, we find ourselves in a strange position. We still do not know precisely what unfolded in mid-March 2020: who made what decisions, when, and why. There has been no serious attempt at any high level to provide a clear accounting much less assign blame.
Not even Tucker Carlson, who reportedly played a crucial role in getting Trump to panic over the virus, will tell us the source of his own information or what his source told him. There have been a series of valuable hearings in the House and Senate but they have received little to no press attention, and none have focus on the lockdown orders themselves.
The prevailing attitude in public life is just to forget the whole thing. And yet we live now in a country very different from the one we inhabited five years ago. Our media is captured. Social media is widely censored in violation of the First Amendment, a problem being taken up by the Supreme Court this month with no certainty of the outcome. The administrative state that seized control has not given up power. Crime has been normalized. Art and music institutions are on the rocks. Public trust in all official institutions is at rock bottom. We don’t even know if we can trust the elections anymore.
In the early days of lockdown, Henry Kissinger warned that if the mitigation plan does not go well, the world will find itself set “on fire.” He died in 2023. Meanwhile, the world is indeed on fire. The essential struggle in every country on earth today concerns the battle between the authority and power of permanent administration apparatus of the state – the very one that took total control in lockdowns – and the enlightenment ideal of a government that is responsible to the will of the people and the moral demand for freedom and rights.
How this struggle turns out is the essential story of our times.
CODA: I’m embedding a copy of PanCAP Adapted, as annotated by Debbie Lerman. You might need to download the whole thing to see the annotations. If you can help with research, please do.
We use cookies on our website to give you the most relevant experience by remembering your preferences and repeat visits. By clicking “Accept”, you consent to the use of ALL the cookies.
This website uses cookies to improve your experience while you navigate through the website. Out of these, the cookies that are categorized as necessary are stored on your browser as they are essential for the working of basic functionalities of the website. We also use third-party cookies that help us analyze and understand how you use this website. These cookies will be stored in your browser only with your consent. You also have the option to opt-out of these cookies. But opting out of some of these cookies may affect your browsing experience.
Necessary cookies are absolutely essential for the website to function properly. These cookies ensure basic functionalities and security features of the website, anonymously.
Cookie
Duration
Description
cookielawinfo-checbox-analytics
11 months
This cookie is set by GDPR Cookie Consent plugin. The cookie is used to store the user consent for the cookies in the category "Analytics".
cookielawinfo-checbox-functional
11 months
The cookie is set by GDPR cookie consent to record the user consent for the cookies in the category "Functional".
cookielawinfo-checbox-others
11 months
This cookie is set by GDPR Cookie Consent plugin. The cookie is used to store the user consent for the cookies in the category "Other.
cookielawinfo-checkbox-necessary
11 months
This cookie is set by GDPR Cookie Consent plugin. The cookies is used to store the user consent for the cookies in the category "Necessary".
cookielawinfo-checkbox-performance
11 months
This cookie is set by GDPR Cookie Consent plugin. The cookie is used to store the user consent for the cookies in the category "Performance".
viewed_cookie_policy
11 months
The cookie is set by the GDPR Cookie Consent plugin and is used to store whether or not user has consented to the use of cookies. It does not store any personal data.
Functional cookies help to perform certain functionalities like sharing the content of the website on social media platforms, collect feedbacks, and other third-party features.
Performance cookies are used to understand and analyze the key performance indexes of the website which helps in delivering a better user experience for the visitors.
Analytical cookies are used to understand how visitors interact with the website. These cookies help provide information on metrics the number of visitors, bounce rate, traffic source, etc.
Advertisement cookies are used to provide visitors with relevant ads and marketing campaigns. These cookies track visitors across websites and collect information to provide customized ads.


")
")


