August home sales and price notch higher amid temporary rate reprieve, C.A.R. reports
August home sales and price notch higher amid temporary rate reprieve, C.A.R. reports
PR Newswire
LOS ANGELES, Sept. 16, 2022
Existing, single-family home sales totaled 313,540 in August on a seasonally adjusted annualized rate, up 6.1 percent from…
Share this:

August home sales and price notch higher amid temporary rate reprieve, C.A.R. reports
PR Newswire
LOS ANGELES, Sept. 16, 2022
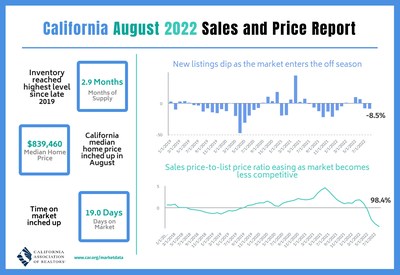
- Existing, single-family home sales totaled 313,540 in August on a seasonally adjusted annualized rate, up 6.1 percent from July and down 24.4 percent from August 2021.
- August's statewide median home price was, $839,460 up 0.7 percent from July and up 1.4 percent from August 2021.
- Year-to-date statewide home sales were down 14.9 percent in August.
LOS ANGELES, Sept. 16, 2022 /PRNewswire/ -- A brief retreat in mortgage rates that created a slightly more favorable lending environment provided a window of opportunity for California homebuyers and perked up home sales in August for the first time in five months, the CALIFORNIA ASSOCIATION OF REALTORS® (C.A.R.) said today.
Infographic: https://www.car.org/Global/Infographics/2022-08-Sales-and-Price
Closed escrow sales of existing, single-family detached homes in California totaled a seasonally adjusted annualized rate of 313,540 in August, according to information collected by C.A.R. from more than 90 local REALTOR® associations and MLSs statewide. The statewide annualized sales figure represents what would be the total number of homes sold during 2022 if sales maintained the August pace throughout the year. It is adjusted to account for seasonal factors that typically influence home sales. August's sales pace was up 6.1 percent on a monthly basis from 295,460 in July and down 24.4 percent from a year ago, when 414,860 homes were sold on an annualized basis. August's monthly sales increase was higher than the long-run average of 0.4 percent for a July-August period in the past 43 years and marked the first monthly sales increase in five months.
"California's housing market stabilized briefly as a temporary reprieve on mortgage rates in July and early August brought buyers into the market," said C.A.R. President Otto Catrina, a Bay Area real estate broker and REALTOR®. "Active listings have passed their annual peak, and while homes are taking slightly longer to sell, the share of homes seeing price reductions has also stabilized to near pre-pandemic levels. In fact, price growth in August actually picked up on both a monthly and annual basis, and pending sales suggest a bounce-back for homes priced $2 million and above."
California home prices stabilized in August as the statewide median price increased on both a monthly basis and yearly basis, but at a less-than-2-percent growth pace. The statewide median price edged up 0.7 percent in August to $839,460 from the $833,910 recorded in July and was up 1.4 percent from the $827,940 recorded last August. The year-over-year price gain was the smallest in more than two years. The nominal price increase was attributed partly to a change in the mix of sales in August. With sales in the million-dollar price segment rising 6.8 percent from the prior month, the August statewide median price also pushed up slightly by 0.7 percent from July.
"It's encouraging to see that August's sales pace rebounded above an annualized 300,000 units sold," said C.A.R. Vice President and Chief Economist Jordan Levine. "Although we do not expect a rapid bounce-back because the Fed is expected to continue raising interest rates to get inflation under control, the monthly increase in closed and pending sales suggests that the market may have already priced in most of the rate increases to date. Still, buyers will continue to grapple with rising costs of borrowing, which will keep home sales below the 350,000 annualized pace for the remainder of the year."
Consumer optimism bounced back as interest rates declined in early August, according to C.A.R.'s monthly Consumer Housing Sentiment Index. Conducted in early September, the share of respondents who believed it was a good time to buy a home rose month-over-month for the third straight month to 19 percent, pushing the Housing Sentiment Index to 59, but was significantly lower than the Index of 72 in August 2021. Meanwhile, those who believed it was a good time to sell a home continued to decline to 56 percent, dropping sharply from 72 percent in August 2021. With interest rates moving upward since mid-August, housing sentiment will likely reverse direction next month. In fact, two-thirds (64%) of consumers believed that the overall economic conditions in California would not improve in the next 12 months, and three-quarters (75%) believed that interest rates would rise in the next 12 months.
Other key points from C.A.R.'s August 2022 resale housing report include:
- At the regional level, sales continued to fall sharply from last year, but the declines in August moderated slightly from the prior month. Three of the five major regions continued to drop by more than 25 percent from last year, with the Central Coast region dipping the most at 30.6 percent year-over-year. The San Francisco Bay Area (-29.1 percent) and Southern California (-28.8 percent) also dipped more than 25 percent from last year, but the declines were less severe compared to the drops recorded in July. The Central Valley (-22.1 percent) and the Far North (-10.5 percent) had the smallest sales declines of the five major regions, but both continued to fall year-over-year by double-digits.
- All but four counties tracked by C.A.R. posted sales drops from last August 2022. Of the 47 counties that experienced a year-over-year sales decline, 30 counties suffered a plunge of more than 20 percent. San Benito County recorded the biggest sales drop from last August at -68.2 percent, followed by Sonoma (-40.3 percent), and Monterey (-35.8 percent). Counties that experienced a sales decline decreased an average of -23.4 percent in August. Four counties recorded a sales increase from a year ago, with Plumas gaining the most at 43.3 percent. Siskiyou (11.9 percent), Del Norte (9.1 percent) and Nevada (2.2 percent) were the other three counties that recorded an annual sales increase. For the first eight months of 2022, sales in San Benito had the sharpest decline at -31.2 percent, while Yuba (8.4 percent) continued to post the best sales performance of all counties compared to last year.
- For the first eight months of 2022, sales in San Luis Obispo continued to drop the sharpest at -28.9 percent, while Yuba (17.7 percent) continued to post the best sales performance of all counties compared to last year.
- More than two-thirds of all California counties experienced a year-over-year increase in their median prices, but their growth rates have been decelerating in the past three months. Seven counties continued to record double-digit growth rates in their median prices from a year ago but was fewer than the 31 counties recorded in May. Napa (29.2 percent) had the biggest price gain of all counties, followed by Sutter (14.8 percent) and Kern (14.5 percent). Fifteen counties registered a dipped in their median prices from a year ago, with Tehama dropping the most at -13.8 percent, followed by San Francisco (-11.6 percent) and El Dorado (-7.3 percent).
- Housing supply in California improved from a year ago but tightened slightly from the prior month as housing demand rose in August. The statewide Unsold Inventory Index (UII) increased to 2.9 months in August 2022 from 1.9 months a year ago. Weaker housing demand, however, continued to be the primary factor for the improvement in the index. With both closed sales and pending sales slowing by more than 20 percent, active listings have been staying on the market longer, resulting in a year-over-year surge of 57.1 percent in homes for sale in August.
- Forty-seven of the 51 counties tracked by C.A.R. recorded an increase in active listings on a year-over-year basis in August, a slight increase from July's 46 counties. Three counties had triple-digit year-over-year gains in homes for sale, with Yuba leading the pack again with a surge of 162.4 percent from a year ago, followed by Placer (105.6 percent) and Mendocino (100.0 percent). Despite an overall improvement in housing supply conditions, four counties experienced a dip in active listings from last year. Active listings in Del Norte dropped the most at -56.0 percent, followed by Plumas (-5.9 percent), Sonoma (-2.9 percent), and Lassen (-1.0 percent).
- The median number of days it took to sell a California single-family home was 19 days in August and 9 days in August 2021.
- C.A.R.'s statewide sales-price-to-list-price ratio* was 98.4 percent in August 2022 and was below 100 percent for the first time since June 2020. The statewide sales-price-to-list-price ratio was 102.8 percent in August 2021.
- The statewide average price per square foot** for an existing single-family home was $406, up from $395 in August a year ago.
- The 30-year, fixed-mortgage interest rate averaged 5.22 percent in August, up from 2.84 percent in August 2021, according to Freddie Mac. The five-year, adjustable mortgage interest rate averaged 4.36 percent, compared to 2.42 percent in August 2021.
Note: The County MLS median price and sales data in the tables are generated from a survey of more than 90 associations of REALTORS® throughout the state and represent statistics of existing single-family detached homes only. County sales data is not adjusted to account for seasonal factors that can influence home sales. Movements in sales prices should not be interpreted as changes in the cost of a standard home. The median price is where half sold for more and half sold for less; medians are more typical than average prices, which are skewed by a relatively small share of transactions at either the lower end or the upper end. Median prices can be influenced by changes in cost, as well as changes in the characteristics and the size of homes sold. The change in median prices should not be construed as actual price changes in specific homes.
*Sales-to-list-price ratio is an indicator that reflects the negotiation power of home buyers and home sellers under current market conditions. The ratio is calculated by dividing the final sales price of a property by its last list price and is expressed as a percentage. A sales-to-list ratio with 100 percent or above suggests that the property sold for more than the list price, and a ratio below 100 percent indicates that the price sold below the asking price.
**Price per square foot is a measure commonly used by real estate agents and brokers to determine how much a square foot of space a buyer will pay for a property. It is calculated as the sale price of the home divided by the number of finished square feet. C.A.R. currently tracks price-per-square foot statistics for 50 counties.
Leading the way…® in California real estate for more than 110 years, the CALIFORNIA ASSOCIATION OF REALTORS® (www.car.org) is one of the largest state trade organizations in the United States with more than 217,000 members dedicated to the advancement of professionalism in real estate. C.A.R. is headquartered in Los Angeles.
August 2022 County Sales and Price Activity
(Regional and condo sales data not seasonally adjusted)
August 2022 | Median Sold Price of Existing Single-Family Homes | Sales | |||||||
State/Region/County | Aug. 2022 | July 2022 | Aug. 2021 | Price | Price | Sales | Sales | ||
Calif. Single-family home | $839,460 | $833,910 | $827,940 | 0.7 % | 1.4 % | 6.1 % | -24.4 % | ||
Calif. Condo/Townhome | $625,000 | $645,000 | $600,000 | -3.1 % | 4.2 % | 9.6 % | -28.6 % | ||
Los Angeles Metro Area | $765,000 | $780,000 | $731,000 | -1.9 % | 4.7 % | 5.7 % | -29.1 % | ||
Central Coast | $950,000 | $950,000 | $905,000 | 0.0 % | 5.0 % | 15.9 % | -30.6 % | ||
Central Valley | $460,000 | $480,000 | $450,000 | -4.2 % | 2.2 % | 9.9 % | -22.1 % | ||
Far North | $380,000 | $405,000 | $387,000 | -6.2 % | -1.8 % | -1.3 % | -10.5 % | ||
Inland Empire | $565,500 | $575,000 | $520,000 | -1.7 % | 8.7 % | 7.2 % | -29.4 % | ||
San Francisco Bay Area | $1,250,000 | $1,300,000 | $1,265,000 | -3.8 % | -1.2 % | 9.9 % | -29.1 % | ||
Southern California | $795,000 | $808,000 | $760,000 | -1.6 % | 4.6 % | 7.8 % | -28.8 % | ||
San Francisco Bay Area | |||||||||
Alameda | $1,230,000 | $1,340,000 | $1,300,000 | -8.2 % | -5.4 % | 10.4 % | -29.9 % | ||
Contra Costa | $870,000 | $902,500 | $889,500 | -3.6 % | -2.2 % | 4.7 % | -27.4 % | ||
Marin | $1,626,000 | $1,720,000 | $1,560,000 | -5.5 % | 4.2 % | 30.5 % | -6.2 % | ||
Napa | $1,162,500 | $1,107,500 | $900,000 | 5.0 % | 29.2 % | 32.4 % | -23.1 % | ||
San Francisco | $1,635,000 | $1,700,000 | $1,850,000 | -3.8 % | -11.6 % | 3.4 % | -23.9 % | ||
San Mateo | $1,950,000 | $1,965,000 | $1,925,000 | -0.8 % | 1.3 % | -0.7 % | -30.3 % | ||
Santa Clara | $1,650,000 | $1,740,000 | $1,655,000 | -5.2 % | -0.3 % | 22.7 % | -28.4 % | ||
Solano | $610,000 | $598,000 | $590,000 | 2.0 % | 3.4 % | 7.1 % | -32.1 % | ||
Sonoma | $840,000 | $817,500 | $770,000 | 2.8 % | 9.1 % | -1.5 % | -40.3 % | ||
Southern California | |||||||||
Los Angeles | $854,960 | $846,320 | $830,070 | 1.0 % | 3.0 % | 1.2 % | -29.1 % | ||
Orange | $1,200,000 | $1,231,000 | $1,100,000 | -2.5 % | 9.1 % | 10.1 % | -30.2 % | ||
Riverside | $620,000 | $625,000 | $570,000 | -0.8 % | 8.8 % | 5.5 % | -27.4 % | ||
San Bernardino | $472,750 | $490,000 | $435,000 | -3.5 % | 8.7 % | 10.3 % | -32.6 % | ||
San Diego | $885,000 | $930,000 | $835,000 | -4.8 % | 6.0 % | 16.3 % | -27.7 % | ||
Ventura | $884,000 | $920,000 | $853,000 | -3.9 % | 3.6 % | 13.3 % | -24.0 % | ||
Central Coast | |||||||||
Monterey | $842,500 | $924,000 | $827,500 | -8.8 % | 1.8 % | 2.9 % | -35.8 % | ||
San Luis Obispo | $868,500 | $895,500 | $770,000 | -3.0 % | 12.8 % | 7.3 % | -29.1 % | ||
Santa Barbara | $1,112,500 | $902,500 | $1,111,960 | 23.3 % | 0.0 % | 39.2 % | -24.5 % | ||
Santa Cruz | $1,300,000 | $1,250,000 | $1,255,000 | 4.0 % | 3.6 % | 21.4 % | -34.0 % | ||
Central Valley | |||||||||
Fresno | $405,000 | $407,000 | $375,000 | -0.5 % | 8.0 % | 9.2 % | -20.7 % | ||
Glenn | $327,500 | $360,000 | $302,500 | -9.0 % | 8.3 % | 0.0 % | -7.1 % | ||
Kern | $373,250 | $362,900 | $326,000 | 2.9 % | 14.5 % | 18.7 % | -12.8 % | ||
Kings | $321,750 | $350,000 | $310,000 | -8.1 % | 3.8 % | 8.4 % | -12.6 % | ||
Madera | $400,000 | $433,000 | $377,500 | -7.6 % | 6.0 % | -6.8 % | -4.9 % | ||
Merced | $385,000 | $410,000 | $369,250 | -6.1 % | 4.3 % | -4.3 % | -30.2 % | ||
Placer | $650,000 | $712,450 | $643,750 | -8.8 % | 1.0 % | 9.5 % | -28.3 % | ||
Sacramento | $535,000 | $550,000 | $515,000 | -2.7 % | 3.9 % | 6.6 % | -26.4 % | ||
San Benito | $755,000 | $825,000 | $774,510 | -8.5 % | -2.5 % | -46.2 % | -68.2 % | ||
San Joaquin | $530,000 | $510,000 | $514,480 | 3.9 % | 3.0 % | 30.5 % | -17.5 % | ||
Stanislaus | $460,000 | $469,000 | $435,000 | -1.9 % | 5.7 % | 17.7 % | -28.6 % | ||
Tulare | $350,000 | $370,000 | $317,500 | -5.4 % | 10.2 % | -1.0 % | -6.2 % | ||
Far North | |||||||||
Butte | $441,000 | $450,000 | $435,000 | -2.0 % | 1.4 % | -14.5 % | -16.3 % | ||
Lassen | $199,000 | $260,000 | $204,500 | -23.5 % | -2.7 % | -28.9 % | -6.9 % | ||
Plumas | $380,000 | $462,500 | $397,500 | -17.8 % | -4.4 % | -10.4 % | 43.3 % | ||
Shasta | $370,000 | $389,000 | $389,900 | -4.9 % | -5.1 % | 11.7 % | -15.6 % | ||
Siskiyou | $360,000 | $339,000 | $327,500 | 6.2 % | 9.9 % | 4.4 % | 11.9 % | ||
Tehama | $301,000 | $325,000 | $349,000 | -7.4 % | -13.8 % | 3.4 % | -18.9 % | ||
Other Calif. Counties | |||||||||
Amador | $447,450 | $395,000 | $425,000 | 13.3 % | 5.3 % | 33.3 % | -6.7 % | ||
Calaveras | $464,950 | $459,900 | $485,000 | 1.1 % | -4.1 % | 22.7 % | -21.4 % | ||
Del Norte | $378,960 | $376,000 | $357,500 | 0.8 % | 6.0 % | 0.0 % | 9.1 % | ||
El Dorado | $631,000 | $650,000 | $680,890 | -2.9 % | -7.3 % | 13.8 % | -23.2 % | ||
Humboldt | $465,000 | $480,000 | $408,500 | -3.1 % | 13.8 % | 22.4 % | -11.8 % | ||
Lake | $330,000 | $356,000 | $335,000 | -7.3 % | -1.5 % | -15.3 % | -34.4 % | ||
Mariposa | $450,000 | $601,000 | $475,000 | -25.1 % | -5.3 % | 46.2 % | -9.5 % | ||
Mendocino | $502,500 | $619,500 | $533,000 | -18.9 % | -5.7 % | 33.3 % | -13.3 % | ||
Mono | $797,500 | $815,000 | $819,500 | -2.1 % | -2.7 % | 7.7 % | -30.0 % | ||
Nevada | $580,000 | $595,000 | $570,950 | -2.5 % | 1.6 % | 7.6 % | 2.2 % | ||
Sutter | $459,000 | $437,100 | $400,000 | 5.0 % | 14.8 % | 23.7 % | -15.1 % | ||
Tuolumne | $407,500 | $435,000 | $389,000 | -6.3 % | 4.8 % | -9.3 % | -32.8 % | ||
Yolo | $639,000 | $600,000 | $595,000 | 6.5 % | 7.4 % | 29.7 % | -10.9 % | ||
Yuba | $422,500 | $440,000 | $410,000 | -4.0 % | 3.0 % | -8.6 % | -35.7 % | ||
r = revised
August 2022 County Unsold Inventory and Days on Market
(Regional and condo sales data not seasonally adjusted)
August 2022 | Unsold Inventory Index | Median Time on Market | ||||||||
State/Region/County | Aug. 2022 | July 2022 | Aug. 2021 | Aug. 2022 | July 2022 | Aug. 2021 | ||||
Calif. Single-family home | 2.9 | 3.2 | 1.9 | 19.0 | 14.0 | 9.0 | ||||
Calif. Condo/Townhome | 2.4 | 2.7 | 1.7 | 17.0 | 13.0 | 10.0 | ||||
Los Angeles Metro Area | 3.1 | 3.3 | 2.0 | 19.0 | 14.0 | 9.0 | ||||
Central Coast | 2.7 | 3.2 | 1.8 | 16.0 | 13.0 | 9.0 | ||||
Central Valley | 2.8 | 3.1 | 1.8 | 16.0 | 12.0 | 7.0 | ||||
Far North | 3.8 | 3.7 | 3.0 | 30.0 | 24.0 | 11.0 | ||||
Inland Empire | 3.4 | 3.6 | 2.2 | 21.0 | 15.0 | 10.0 | ||||
San Francisco Bay Area | 2.2 | 2.5 | 1.5 | 20.0 | 15.0 | 11.0 | ||||
Southern California | 3.0 | 3.3 | 1.9 | 18.0 | 13.0 | 9.0 | ||||
San Francisco Bay Area | ||||||||||
Alameda | 2.1 | 2.4 | 1.3 | 16.0 | 13.0 | 9.0 | ||||
Contra Costa | 2.3 | 2.5 | 1.4 | 18.0 | 13.0 | 8.0 | ||||
Marin | 1.8 | 2.1 | 1.6 | 26.0 | 16.0 | 14.0 | ||||
Napa | 3.4 | 4.3 | 2.7 | 36.0 | 34.5 | 33.0 | ||||
San Francisco | 2.2 | 2.2 | 1.7 | 18.0 | 15.0 | 13.0 | ||||
San Mateo | 2.3 | 2.2 | 1.5 | 14.0 | 12.0 | 9.0 | ||||
Santa Clara | 2.0 | 2.6 | 1.4 | 16.0 | 14.0 | 8.0 | ||||
Solano | 2.8 | 2.9 | 1.3 | 34.0 | 27.0 | 23.0 | ||||
Sonoma | 2.6 | 2.6 | 1.8 | 31.0 | 31.5 | 34.0 | ||||
Southern California | ||||||||||
Los Angeles | 3.1 | 3.3 | 2.0 | 16.0 | 13.0 | 9.0 | ||||
Orange | 2.5 | 3.0 | 1.6 | 17.5 | 13.0 | 8.0 | ||||
Riverside | 3.2 | 3.4 | 2.0 | 22.0 | 17.0 | 10.0 | ||||
San Bernardino | 3.7 | 4.0 | 2.4 | 19.0 | 13.0 | 10.0 | ||||
San Diego | 2.5 | 3.1 | 1.7 | 15.0 | 10.0 | 8.0 | ||||
Ventura | 2.3 | 2.8 | 1.9 | 28.0 | 23.0 | 20.0 | ||||
Central Coast | ||||||||||
Monterey | 3.1 | 3.2 | 2.1 | 20.0 | 14.0 | 9.0 | ||||
San Luis Obispo | 2.5 | 2.8 | 1.7 | 12.5 | 9.0 | 8.0 | ||||
Santa Barbara | 2.6 | 3.7 | 1.8 | 14.0 | 14.5 | 9.0 | ||||
Santa Cruz | 2.5 | 3.1 | 1.6 | 18.0 | 14.0 | 12.0 | ||||
Central Valley | ||||||||||
Fresno | 2.9 | 3.1 | 1.8 | 13.0 | 8.0 | 7.0 | ||||
Glenn | 4.2 | 4.4 | 3.1 | 52.0 | 7.0 | 7.5 | ||||
Kern | 2.4 | 2.9 | 1.8 | 18.0 | 12.0 | 8.0 | ||||
Kings | 2.3 | 2.5 | 1.8 | 12.5 | 13.0 | 6.0 | ||||
Madera | 3.7 | 3.4 | 3.2 | 17.0 | 14.5 | 11.0 | ||||
Merced | 3.5 | 3.4 | 2.0 | 16.5 | 15.0 | 10.0 | ||||
Placer | 3.0 | 3.3 | 1.5 | 21.0 | 14.0 | 7.0 | ||||
Sacramento | 2.6 | 2.7 | 1.7 | 16.0 | 11.0 | 7.0 | ||||
San Benito | 7.7 | 4.1 | 2.0 | 30.0 | 22.0 | 11.0 | ||||
San Joaquin | 2.9 | 3.8 | 2.2 | 19.0 | 14.0 | 8.0 | ||||
Stanislaus | 2.9 | 3.3 | 1.8 | 16.0 | 12.0 | 7.0 | ||||
Tulare | 2.7 | 2.6 | 2.1 | 12.0 | 12.0 | 7.0 | ||||
Far North | ||||||||||
Butte | 3.4 | 3.0 | 2.2 | 19.0 | 12.5 | 8.0 | ||||
Lassen | 4.6 | 2.9 | 4.3 | 70.0 | 70.5 | 102.0 | ||||
Plumas | 4.1 | 3.7 | 6.4 | 64.0 | 58.5 | 59.0 | ||||
Shasta | 3.3 | 3.8 | 2.4 | 21.5 | 14.0 | 8.0 | ||||
Siskiyou | 4.5 | 5.0 | 4.8 | 51.0 | 31.0 | 13.0 | ||||
Tehama | 6.4 | 6.4 | 4.1 | 53.5 | 59.0 | 40.0 | ||||
Other Calif. Counties | ||||||||||
Amador | 4.8 | 6.0 | 2.9 | 28.5 | 18.0 | 10.5 | ||||
Calaveras | 3.3 | 4.1 | 2.6 | 57.5 | 53.5 | 52.0 | ||||
Del Norte | 3.2 | 3.8 | 4.7 | 58.0 | 83.0 | 68.5 | ||||
El Dorado | 3.3 | 3.9 | 2.0 | 32.0 | 25.5 | 12.0 | ||||
Humboldt | 3.6 | 4.7 | 2.4 | 18.5 | 11.0 | 11.0 | ||||
Lake | 6.7 | 5.4 | 3.9 | 39.0 | 15.0 | 13.0 | ||||
Mariposa | 3.8 | 5.7 | 3.4 | 13.0 | 10.0 | 27.0 | ||||
Mendocino | 6.4 | 7.6 | 3.7 | 74.5 | 69.0 | 50.0 | ||||
Mono | 4.6 | 6.2 | 2.7 | 55.0 | 62.0 | 71.0 | ||||
Nevada | 3.4 | 3.7 | 2.6 | 35.0 | 23.0 | 12.0 | ||||
Sutter | 2.6 | 3.4 | 1.7 | 23.0 | 10.0 | 8.0 | ||||
Tuolumne | 4.3 | 3.9 | 2.7 | 69.5 | 55.0 | 10.5 | ||||
Yolo | 2.3 | 3.2 | 1.8 | 16.0 | 10.0 | 9.0 | ||||
Yuba | 4.1 | 3.6 | 1.6 | 26.0 | 18.0 | 7.0 | ||||
r = revised
")
View original content to download multimedia:https://www.prnewswire.com/news-releases/august-home-sales-and-price-notch-higher-amid-temporary-rate-reprieve-car-reports-301626266.html
SOURCE CALIFORNIA ASSOCIATION OF REALTORS® (C.A.R.)
Uncategorized
February Employment Situation
By Paul Gomme and Peter Rupert The establishment data from the BLS showed a 275,000 increase in payroll employment for February, outpacing the 230,000…
Share this:


By Paul Gomme and Peter Rupert
The establishment data from the BLS showed a 275,000 increase in payroll employment for February, outpacing the 230,000 average over the previous 12 months. The payroll data for January and December were revised down by a total of 167,000. The private sector added 223,000 new jobs, the largest gain since May of last year.

Temporary help services employment continues a steep decline after a sharp post-pandemic rise.


Average hours of work increased from 34.2 to 34.3. The increase, along with the 223,000 private employment increase led to a hefty increase in total hours of 5.6% at an annualized rate, also the largest increase since May of last year.

The establishment report, once again, beat “expectations;” the WSJ survey of economists was 198,000. Other than the downward revisions, mentioned above, another bit of negative news was a smallish increase in wage growth, from $34.52 to $34.57.

The household survey shows that the labor force increased 150,000, a drop in employment of 184,000 and an increase in the number of unemployed persons of 334,000. The labor force participation rate held steady at 62.5, the employment to population ratio decreased from 60.2 to 60.1 and the unemployment rate increased from 3.66 to 3.86. Remember that the unemployment rate is the number of unemployed relative to the labor force (the number employed plus the number unemployed). Consequently, the unemployment rate can go up if the number of unemployed rises holding fixed the labor force, or if the labor force shrinks holding the number unemployed unchanged. An increase in the unemployment rate is not necessarily a bad thing: it may reflect a strong labor market drawing “marginally attached” individuals from outside the labor force. Indeed, there was a 96,000 decline in those workers.


Earlier in the week, the BLS announced JOLTS (Job Openings and Labor Turnover Survey) data for January. There isn’t much to report here as the job openings changed little at 8.9 million, the number of hires and total separations were little changed at 5.7 million and 5.3 million, respectively.

As has been the case for the last couple of years, the number of job openings remains higher than the number of unemployed persons.

Also earlier in the week the BLS announced that productivity increased 3.2% in the 4th quarter with output rising 3.5% and hours of work rising 0.3%.

The bottom line is that the labor market continues its surprisingly (to some) strong performance, once again proving stronger than many had expected. This strength makes it difficult to justify any interest rate cuts soon, particularly given the recent inflation spike.
unemployment pandemic unemploymentSpread & Containment
Another beloved brewery files Chapter 11 bankruptcy
The beer industry has been devastated by covid, changing tastes, and maybe fallout from the Bud Light scandal.
Share this:


Before the covid pandemic, craft beer was having a moment. Most cities had multiple breweries and taprooms with some having so many that people put together the brewery version of a pub crawl.
It was a period where beer snobbery ruled the day and it was not uncommon to hear bar patrons discuss the makeup of the beer the beer they were drinking. This boom period always seemed destined for failure, or at least a retraction as many markets seemed to have more craft breweries than they could support.
Related: Fast-food chain closes more stores after Chapter 11 bankruptcy
The pandemic, however, hastened that downfall. Many of these local and regional craft breweries counted on in-person sales to drive their business.
And while many had local and regional distribution, selling through a third party comes with much lower margins. Direct sales drove their business and the pandemic forced many breweries to shut down their taprooms during the period where social distancing rules were in effect.
During those months the breweries still had rent and employees to pay while little money was coming in. That led to a number of popular beermakers including San Francisco's nationally-known Anchor Brewing as well as many regional favorites including Chicago’s Metropolitan Brewing, New Jersey’s Flying Fish, Denver’s Joyride Brewing, Tampa’s Zydeco Brew Werks, and Cleveland’s Terrestrial Brewing filing bankruptcy.
Some of these brands hope to survive, but others, including Anchor Brewing, fell into Chapter 7 liquidation. Now, another domino has fallen as a popular regional brewery has filed for Chapter 11 bankruptcy protection.
Image source: Shutterstock
Covid is not the only reason for brewery bankruptcies
While covid deserves some of the blame for brewery failures, it's not the only reason why so many have filed for bankruptcy protection. Overall beer sales have fallen driven by younger people embracing non-alcoholic cocktails, and the rise in popularity of non-beer alcoholic offerings,
Beer sales have fallen to their lowest levels since 1999 and some industry analysts
"Sales declined by more than 5% in the first nine months of the year, dragged down not only by the backlash and boycotts against Anheuser-Busch-owned Bud Light but the changing habits of younger drinkers," according to data from Beer Marketer’s Insights published by the New York Post.
Bud Light parent Anheuser Busch InBev (BUD) faced massive boycotts after it partnered with transgender social media influencer Dylan Mulvaney. It was a very small partnership but it led to a right-wing backlash spurred on by Kid Rock, who posted a video on social media where he chastised the company before shooting up cases of Bud Light with an automatic weapon.
Another brewery files Chapter 11 bankruptcy
Gizmo Brew Works, which does business under the name Roth Brewing Company LLC, filed for Chapter 11 bankruptcy protection on March 8. In its filing, the company checked the box that indicates that its debts are less than $7.5 million and it chooses to proceed under Subchapter V of Chapter 11.
"Both small business and subchapter V cases are treated differently than a traditional chapter 11 case primarily due to accelerated deadlines and the speed with which the plan is confirmed," USCourts.gov explained.
Roth Brewing/Gizmo Brew Works shared that it has 50-99 creditors and assets $100,000 and $500,000. The filing noted that the company does expect to have funds available for unsecured creditors.
The popular brewery operates three taprooms and sells its beer to go at those locations.
"Join us at Gizmo Brew Works Craft Brewery and Taprooms located in Raleigh, Durham, and Chapel Hill, North Carolina. Find us for entertainment, live music, food trucks, beer specials, and most importantly, great-tasting craft beer by Gizmo Brew Works," the company shared on its website.
The company estimates that it has between $1 and $10 million in liabilities (a broad range as the bankruptcy form does not provide a space to be more specific).
Gizmo Brew Works/Roth Brewing did not share a reorganization or funding plan in its bankruptcy filing. An email request for comment sent through the company's contact page was not immediately returned.
bankruptcy pandemic social distancing
Government
Walmart joins Costco in sharing key pricing news
The massive retailers have both shared information that some retailers keep very close to the vest.
Share this:

As we head toward a presidential election, the presumed candidates for both parties will look for issues that rally undecided voters.
The economy will be a key issue, with Democrats pointing to job creation and lowering prices while Republicans will cite the layoffs at Big Tech companies, high housing prices, and of course, sticky inflation.
The covid pandemic created a perfect storm for inflation and higher prices. It became harder to get many items because people getting sick slowed down, or even stopped, production at some factories.
Related: Popular mall retailer shuts down abruptly after bankruptcy filing
It was also a period where demand increased while shipping, trucking and delivery systems were all strained or thrown out of whack. The combination led to product shortages and higher prices.
You might have gone to the grocery store and not been able to buy your favorite paper towel brand or find toilet paper at all. That happened partly because of the supply chain and partly due to increased demand, but at the end of the day, it led to higher prices, which some consumers blamed on President Joe Biden's administration.
Biden, of course, was blamed for the price increases, but as inflation has dropped and grocery prices have fallen, few companies have been up front about it. That's probably not a political choice in most cases. Instead, some companies have chosen to lower prices more slowly than they raised them.
However, two major retailers, Walmart (WMT) and Costco, have been very honest about inflation. Walmart Chief Executive Doug McMillon's most recent comments validate what Biden's administration has been saying about the state of the economy. And they contrast with the economic picture being painted by Republicans who support their presumptive nominee, Donald Trump.
Image source: Joe Raedle/Getty Images
Walmart sees lower prices
McMillon does not talk about lower prices to make a political statement. He's communicating with customers and potential customers through the analysts who cover the company's quarterly-earnings calls.
During Walmart's fiscal-fourth-quarter-earnings call, McMillon was clear that prices are going down.
"I'm excited about the omnichannel net promoter score trends the team is driving. Across countries, we continue to see a customer that's resilient but looking for value. As always, we're working hard to deliver that for them, including through our rollbacks on food pricing in Walmart U.S. Those were up significantly in Q4 versus last year, following a big increase in Q3," he said.
He was specific about where the chain has seen prices go down.
"Our general merchandise prices are lower than a year ago and even two years ago in some categories, which means our customers are finding value in areas like apparel and hard lines," he said. "In food, prices are lower than a year ago in places like eggs, apples, and deli snacks, but higher in other places like asparagus and blackberries."
McMillon said that in other areas prices were still up but have been falling.
"Dry grocery and consumables categories like paper goods and cleaning supplies are up mid-single digits versus last year and high teens versus two years ago. Private-brand penetration is up in many of the countries where we operate, including the United States," he said.
Costco sees almost no inflation impact
McMillon avoided the word inflation in his comments. Costco (COST) Chief Financial Officer Richard Galanti, who steps down on March 15, has been very transparent on the topic.
The CFO commented on inflation during his company's fiscal-first-quarter-earnings call.
"Most recently, in the last fourth-quarter discussion, we had estimated that year-over-year inflation was in the 1% to 2% range. Our estimate for the quarter just ended, that inflation was in the 0% to 1% range," he said.
Galanti made clear that inflation (and even deflation) varied by category.
"A bigger deflation in some big and bulky items like furniture sets due to lower freight costs year over year, as well as on things like domestics, bulky lower-priced items, again, where the freight cost is significant. Some deflationary items were as much as 20% to 30% and, again, mostly freight-related," he added.
bankruptcy pandemic trump

Walmart launches clever answer to Target’s new membership program


EyePoint poaches medical chief from Apellis; Sandoz CFO, longtime BioNTech exec to retire


Wendy’s has a new deal for daylight savings time haters


Watch Live: President Biden Reminds Americans Just How Good They’ve Got It Thanks To Him


Catastrophic Risk: Investing and Business Implications


Racial and Ethnic Wealth Inequality in the Post‑Pandemic Era


Redefining Poverty: Towards a Transpartisan Approach


The Digest #187


When Military Rule Supplants Democracy


Dropping Like a Stone: ON RRP Take‑up in the Second Half of 2023
-

 Uncategorized2 weeks ago
All Of The Elements Are In Place For An Economic Crisis Of Staggering Proportions
-

 Uncategorized1 month ago
Cathie Wood sells a major tech stock (again)
-

 Uncategorized3 weeks ago
California Counties Could Be Forced To Pay $300 Million To Cover COVID-Era Program
-

 Uncategorized2 weeks ago
Apparel Retailer Express Moving Toward Bankruptcy
-

 Uncategorized3 weeks ago
Industrial Production Decreased 0.1% in January
-
International1 day ago
Walmart launches clever answer to Target’s new membership program
-

 Uncategorized3 weeks ago
RFK Jr: The Wuhan Cover-Up & The Rise Of The Biowarfare-Industrial Complex
-

 Uncategorized3 weeks ago
GOP Efforts To Shore Up Election Security In Swing States Face Challenges