Astrology charts beat technical analysis: Maren Altman is a star
Are future prices written in the stars? Meet Maren Altman, presciently named for cryptocurrency, who combines astrology and day trading crypto into a winning blend.In 1973, Princeton University professor Burton Malkiel published his book A Random Walk…
Share this:


Are future prices written in the stars? Meet Maren Altman, presciently named for cryptocurrency, who combines astrology and day trading crypto into a winning blend.
In 1973, Princeton University professor Burton Malkiel published his book A Random Walk Down Wall Street, in which he famously states that a blindfolded monkey throwing darts at a newspapers financial pages could select a portfolio that would do just as well as one carefully selected by experts.
Fast forward to 2013, and Rob Arnott, CEO of Research Affiliates, conducted research mimicking monkeys using AI and actually discovered the monkeys had done a much better job than both the experts and the stock market. Closer examination proved the success was a result of the random selection of companies by the monkey approach, optimizing their success. However, it is a sobering thought that not only machines but possibly primates can outperform humans in stock picking.
Its a small step, perhaps, to look at the potential of astrology to determine the future price of Bitcoin. Unlike a stock, whose performance is dictated by both the business performance of a company and the sector in which it operates, technical analysts predictions for Bitcoin price movements depend on reviewing charts and patterns similar to that performed by astrologists.
In the gutter, looking at the stars
So, how do you predict the price of Bitcoin with astrology? Enter Maren Altman, who calls herself your personal poet to the stars, especially on TikTok, and has made a name for herself over the last two years by using astrology to predict price but not without attracting some controversy.
I was always the weird girl who asked people about their star signs. In college, I used to earn pocket money by doing peoples charts at parties. I have always been fascinated by astrology.
It was a natural fit for Altman to run Bitcoin through the charts, using the genesis block as the birth date after all, anything with a birth date can be plugged into the astrology charts. Altman bought some Bitcoin back in 2017 but had largely forgotten about it until she became interested again in March 2020 when she was studying philosophy at NYU, along with the rest of the student population nothing like a good pandemic and soaring price to grab interest.
I grew up with astrology where patterns and cycles are tracked. I was also familiar with financial astrology, so it just made sense to apply it to cryptocurrency, says Altman.
Thats a big call
One of her first notable calls was in January 2021, where she observed that the new moon in Capricorn, on Jan. 13, looked big for Bitcoin. She went on to predict a dip followed by a bull run. Her call was prescient, with Bitcoin continuing to double in price before April. To counter that, she predicted all-time highs in May, with largely unremarkable success, and Bitcoin floundering instead in its first notable dip of 2021.
Becoming a day trader proved profitable for Altman, but it was not without its stresses.
It was not enough to call the price; I had to be able to execute, she says. And, some days, I made mistakes and lost money, but it was not the fault of the charts but my errors.
She sees astrology as a giant mirror where certain signifiers of planetary alignments represent themes such as world growth, or even world aggression or peace. By reading those patterns and overplaying them on what has already happened, she can trace future movements or, in the case of cryptocurrency, prices.

Altman acknowledges that it can be hard to read the charts there is a system of patterns but also multiple cycles that can result in misreading. Having said that, she is still ahead of the game.
Either way, I am 100% transparent with my trades. I share everything, she says.
She began trading and posting on social media in earnest in the summer of 2020, and today, she has more than a million followers on TikTok and more than 2 million combined on all her socials.
It just blew up over the summer of 2020, Altman explains.
When asked why she gained such traction, Altman shrugs her shoulders.
I am a bit of a character. Im young, Im a woman and I wear mostly red. But, I am also serious, I dont dumb myself down and I make my living though crypto. I guess it just blew up in a perfect storm of weirdness.
Did she predict Jan. 6, or did she just read the newspapers?
It might also be down to her humor and calling both the Biden presidential win and the Jan. 6, 2021 uprising, although political majors might have achieved similar success through reading the papers.
She also picked up a number of high-profile features in tier-one publications such as The Washington Post, Reuters and The New Yorker not magazines that frequently publicize highly improbable predictions.
Scrolling through her popular TikToks at one point when talking about flipping NFTs, she explains that she put a down payment on an apartment in Dubai by flipping one NFT. Its pretty inspirational.
Mostly, though, her income is through her trading, and she is reluctant to do much monetization of her socials.

Ive been hesitant to partner with paid sponsors because everyone in crypto hates people that monetize their socials. Its just not done, she explains.
She has written several articles for crypto traders and for market analyst Mati Greenspan on his Quantum Economics platform, but she is not directly employed by him.
In other interviews, she points to her Astrology Academy, where she offers astrology training to paying clients. There are about 150 paying clients. She says that she has 1,000 people in her membership community paying between $7 and $50 a month for her teachings.
The best of blockchain, every Tuesday
Subscribe for thoughtful explorations and leisurely reads from Magazine.
By subscribing you agree to our Terms of Service and Privacy Policy
Charting a course through the storm
At this point, I ask if she has had much pushback. Yes, she has, to the point of having to flee the country because of death threats.
New York was no longer safe for me, and so I went to friends in Dubai, she says.
Altman is back in New York when we speak, but she references the trolling campaign spearheaded by a 2021 article in Rolling Stone where she was called a white supremacist, a racist, homophobic and transphobic, among other things. Worryingly, given her following, it accused her of plagiarism.

There is a lot to unpack in the series of tweets and articles written around this time. BIPOC astrologers in the same field, such as AstroDim, said that Altman had, at first, dissed their commentary that President Biden would die in office but then reposted similar predictions later on.
In other social media flareups, Altman, a vegan, has used inflammatory images and texts in support of her dietary choices. Again, it has caused some backlash.
the more importance you have to say, the more others will misrepresent you & take you out of context.
the key is to remember that what you have to say is more important than shutting up.
— MAREN (@marenaltman) January 7, 2022
The BIPOC astrologers in the same article also maintained that there is a general bias against BIPOC people across social media platforms, targeting TikTok in particular.
The biggest complaint made against Altman by the BIPOC astrologers in that 2021 Rolling Stone article is that when Altman talks about the same topics as they do, she gets more views. That might say more about America than astrology.
Altman apologized in a number of videos about her comments and videos on gender fluidity, trans people and animal/meat eaters before going offline during the Mercury retrograde when she went to Dubai.
According to Altman, she was not trolled by crypto heads but rather spiritual crazies who invented a lot of their claims.
She certainly does attract a lot of attention good and bad and there is even a Twitter account presenting an archive of her more standout tweets where she claims, among other things, that artificial insemination for dairy cows is a form of sexual assault.
Promoting disordered eating as well as an ongoing moral superiority complex pic.twitter.com/BImU7tO5Lf
— maren altman tweets (@marenaltmantwe1) February 9, 2021
Altman says she went to the police when the threats escalated and now has security.
A thread: #astrotwitter 2 nights ago I was shocked to see Maren Altman tweet she has a legal team handling the recent incident involing her and the rest of the astro community, it wasn't a good look…
— Jalin (@C_Jalin) February 12, 2021
What we know for certain if you believe in the charts, however, is that she is assured of more success in her future.
Not famous, as that is a very loaded word, but I always knew I would be successful. Funnily enough, my own astrology charts are entirely focused on finance, and it never made sense to me until now.
In time, Ill move away from day trading and into angel investing, but I need to build my capital first.
cryptocurrency bitcoin blockchain crypto pandemic crypto
Uncategorized
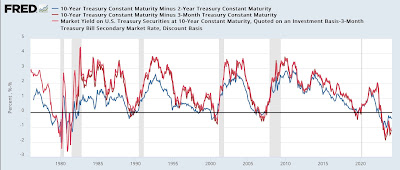
Manufacturing and construction vs. the still-inverted yield curve
– by New Deal democratProf. Menzie Chinn at Econbrowser makes the point that the yield curve is still inverted, and has not yet eclipsed the longest…
Share this:

- by New Deal democrat
Prof. Menzie Chinn at Econbrowser makes the point that the yield curve is still inverted, and has not yet eclipsed the longest previous time between onset of such an inversion and a recession. So he believes the threat of recession is still on the table.


Uncategorized
Half Of Downtown Pittsburgh Office Space Could Be Empty In 4 Years
Half Of Downtown Pittsburgh Office Space Could Be Empty In 4 Years
Authored by Mike Shedlock via MishTalk.com,
The CRE implosion is picking…
Share this:


Authored by Mike Shedlock via MishTalk.com,
The CRE implosion is picking up steam.
Check out the grim stats on Pittsburgh.
Unions are also a problem in Pittsburgh as they are in Illinois and California.
Downtown Pittsburgh Implosion
The Post Gazette reports nearly half of Downtown Pittsburgh office space could be empty in 4 years.
Confidential real estate information obtained by the Pittsburgh Post-Gazette estimates that 17 buildings are in “significant distress” and another nine are in “pending distress,” meaning they are either approaching foreclosure or at risk of foreclosure. Those properties represent 63% of the Downtown office stock and account for $30.5 million in real estate taxes, according to the data.
It also calculates the current office vacancy rate at 27% when subleases are factored in — one of the highest in the country.
And with an additional three million square feet of unoccupied leased space becoming available over the next five years, the vacancy rate could soar to 46% by 2028, based on the data.
Property assessments on 10 buildings, including U.S. Steel Tower, PPG Place, and the Tower at PNC Plaza, have been slashed by $364.4 million for the 2023 tax year, as high vacancies drive down their income.
Another factor has been the steep drop — to 63.5% from 87.5% — in the common level ratio, the number used to compute taxable value in county assessment appeal hearings.
The assessment cuts have the potential to cost the city, the county, and the Pittsburgh schools nearly $8.4 million in tax refunds for that year alone. Downtown represents nearly 25% of the city’s overall tax base.
In response Pittsburgh City Councilman Bobby Wilson wants to remove a $250,000 limit on the amount of tax relief available to a building owner or developer as long as a project creates at least 50 full-time equivalent jobs.
It’s unclear if the proposal will be enough. Annual interest costs to borrow $1 million have soared from $32,500 at the start of the pandemic in 2020 to $85,000 on March 1. Local construction costs have increased by about 30% since 2019.
But the city is doomed if it does nothing. Aaron Stauber, president of Rugby Realty said it will probably empty out Gulf Tower and mothball it once all existing leases expire.
“It’s cheaper to just shut the lights off,” he said. “At some point, we would move on to greener pastures.”
Where’s There’s Smoke There’s Unions
In addition to the commercial real estate woes, the city is also wrestling with union contracts.
Please consider Sounding the alarm: Pittsburgh Controller’s letter should kick off fiscal soul-searching
It’s only March, and Pittsburgh’s 2024 house-of-cards operating budget is already falling down. That’s the clear implication of a letter sent by new City Controller Rachael Heisler to Mayor Ed Gainey and members of City Council on Wednesday afternoon.
The letter is a rare and welcome expression of urgency in a city government that has fallen in complacency — and is close to falling into fiscal disaster.
The approaching crisis was thrown into sharp relief this week, when City Council approved amendments to the operating budget accounting for a pricey new contract with the firefighters union. The Post-Gazette Editorial Board had predicted that this contract — plus two others yet to be announced and approved — would demonstrate the dishonesty of Mayor Ed Gainey’s budget, and that’s exactly what’s happening: The new contract is adding $11 million to the administration’s artificially low 5-year spending projections, bringing expected 2028 reserves to just barely the legal limit.
But there’s still two big contracts to go, with the EMS union and the Pittsburgh Joint Collective Bargaining Committee, which covers Public Works workers. Worse, there are tens — possibly hundreds — of millions in unrealistic revenues still on the books. On this, Ms. Heisler’s letter only scratched the surface.
Similarly, as we have observed, the budget’s real estate tax revenue projections are radically inconsistent with reality. Due to high vacancies and a sharp reduction in the common level ratio, a significant drop in revenues was predictable — but not reflected in the budget. Ms. Heisler’s estimate of a 20% drop in revenues from Downtown property, or $5.3 million a year, may even be optimistic: Other estimates peg the loss at twice that, or more.
Left unmentioned in the letter are massive property tax refunds the city will owe, as well as fanciful projections of interest income that are inconsistent with the dwindling reserves, and drawing-down of federal COVID relief funds, predicted in the budget itself. That’s another unrealistic $80 million over five years.
Pittsburgh exited Act 47 state oversight after nearly 15 years on Feb. 12, 2018, with a clean bill of fiscal health.
It has already ruined that bill of health.
Act 47 in Pittsburgh
Flashback February 21, 2018: Act 47 in Pittsburgh: What Was Accomplished?
Pittsburgh’s tax structure was a much-complained-about topic leading up to the Act 47 declaration. The year following Pittsburgh’s designation as financially distressed under Act 47 it levied taxes on real estate, real estate transfers, parking, earned income, business gross receipts (business privilege and mercantile), occupational privilege and amusements. The General Assembly enacted tax reforms in 2004 giving the city authority to levy a payroll preparation tax in exchange for the immediate elimination of the mercantile tax and the phase out of the business privilege tax. The tax reforms increased the amount of the occupational privilege tax from $10 to $52 (this is today known as the local services tax and all municipalities outside of Philadelphia levy it and could raise it thanks to the change for Pittsburgh).
The coordinators recommended an increase in the deed transfer tax, which occurred in late 2004 (it was just increased again by City Council) and in the real estate tax, which increased in 2015.
Legacy costs, principally debt and underfunded pensions, were the primary focus of the 2009 amended recovery plan. The city’s pension funded ratio has increased significantly from where it stood a decade ago, rising from the mid-30 percent range to over 60 percent at last measurement.
The obvious question? Will the city stick to the steps taken to improve financially and avoid slipping back into distressed status? If Pittsburgh once stood “on the precipice of full-blown crisis,” as described in the first recovery plan, hopefully it won’t return to that position.
The Obvious Question
I could have answered the 2018 obvious question with the obvious answer. Hell no.
No matter how much you raise taxes, it will never be enough because public unions will suck every penny and want more.
On top of union graft, and insanely woke policies in California, we have an additional huge problem.
Hybrid Work Leaves Offices Empty and Building Owners Reeling
Hybrid work has put office building owners in a bind and could pose a risk to banks. Landlords are now confronting the fact that some of their office buildings have become obsolete, if not worthless.
Meanwhile, in Illinois …
Chicago Teachers’ Union Seeks $50 Billion Despite $700 Million City Deficit
Please note the Chicago Teachers’ Union Seeks $50 Billion Despite $700 Million City Deficit
The CTU wants to raise taxes across the board, especially targeting real estate.
My suggestion, get the hell out...
International
A popular vacation destination is about to get much more expensive
The entry fee to this destination known for its fauna has been unchanged since 1998.
Share this:


When visiting certain islands and other remote parts of the world, travelers need to be prepared to pay more than just the plane ticket and accommodation costs.
Particularly for smaller places grappling with overtourism, local governments will often introduce "tourist taxes" to go toward things like reversing ecological degradation and keeping popular attractions clean and safe.
Related: A popular European city is introducing the highest 'tourist tax' yet
Located 900 kilometers off the coast of Ecuador and often associated with the many species of giant turtles who call it home, the Galápagos Islands are not easy to get to (visitors from the U.S. often pass through Quito and then get on a charter flight to the islands) but are often a dream destination for those interested in seeing rare animal species in an unspoiled environment.
Shutterstock
This is how much you'll have to pay to visit the Galápagos Islands
While local authorities have been charging a $100 USD entry fee for all visitors to the islands since 1998, Ecuador's Ministry of Tourism announced that this number would rise to $200 for adults starting from August 1, 2024.
More Travel:
- A new travel term is taking over the internet (and reaching airlines and hotels)
- The 10 best airline stocks to buy now
- Airlines see a new kind of traveler at the front of the plane
According to the local tourism board, the increase has been prompted by the fact that record numbers of visitors since the pandemic have started taking a toll on the local environment. The islands are home to just 30,000 people but have been seeing nearly 300,000 visitors each year.
"It is our collective responsibility to protect and preserve this unparalleled ecosystem for future generations," Ecuador's Minister of Tourism Niels Olsen said in a statement. "The adjustment in the entry fee, the first in 26 years, is a necessary measure to ensure that tourism in the Galápagos remains sustainable and mutually beneficial to both the environment and our local communities."
These are the other countries which are raising (or adding) their tourist taxes
While the $200 applies to most international adult arrivals, there are some exceptions that can make one eligible for a lower rate. Adult citizens of the countries that make up the South American treaty bloc Mercosur will pay a $100 fee while children from any country will also get a discounted rate that is currently set at $50. Children under the age of two will continue to get free access.
In recent years, multiple countries and destinations have either raised or introduced new taxes for visitors. Thailand recently started charging all international visitors between 150 and 300 baht (up to $9 USD) that are put toward a sustainability budget while the Italian city of Venice is running a test in which it charges those coming into the city during the most popular summer weekends five euros.
Places such as Bali, the Maldives and New Zealand have been charging international arrivals a fee for years while Iceland's Prime Minister Katrín Jakobsdóttir hinted at plans to introduce something similar at the United Nations Climate Ambition Summit in 2023.
"Tourism has really grown exponentially in Iceland in the last decade and that obviously is not just creating effects on the climate," Jakobsdóttir told a Bloomberg reporter. "Most of our guests visit our unspoiled nature and obviously that creates a pressure."
stocks pandemic european

Mistakes Were Made


Home buyers must now navigate higher mortgage rates and prices


Supreme Court Rules Public Officials May Block Their Constituents On Social Media


“Extreme Events”: US Cancer Deaths Spiked In 2021 And 2022 In “Large Excess Over Trend”


Harvard Medical School Professor Was Fired Over Not Getting COVID Vaccine


Germany Is Running Out Of Money And Debt Levels Are Exploding, Finance Minister Warns


You can strike gold and silver investment opportunities at Costco


TikTok Ban Obscures Chinese Stock Gold Rush


Default: San Francisco Four Seasons Hotel Investors $3 Million Late On Loan As Foreclosure Looms


Correcting the Washington Post’s 11 Charts That Are Supposed to Tell Us How the Economy Changed Since Covid
-

 Uncategorized4 weeks ago
All Of The Elements Are In Place For An Economic Crisis Of Staggering Proportions
-

 Spread & Containment5 days ago
IFM’s Hat Trick and Reflections On Option-To-Buy M&A
-

 International1 week ago
EyePoint poaches medical chief from Apellis; Sandoz CFO, longtime BioNTech exec to retire
-

 Uncategorized1 month ago
California Counties Could Be Forced To Pay $300 Million To Cover COVID-Era Program
-

 Uncategorized3 weeks ago
Apparel Retailer Express Moving Toward Bankruptcy
-

 Uncategorized1 month ago
Industrial Production Decreased 0.1% in January
-

 International1 week ago
Walmart launches clever answer to Target’s new membership program
-

 Uncategorized1 month ago
RFK Jr: The Wuhan Cover-Up & The Rise Of The Biowarfare-Industrial Complex