Connect with us

Uncategorized

Argonne lays the groundwork for its next-generation supercomputer

Paving the way to a brand-new class of computers that will drive unprecedented innovation and scientific breakthroughs. Credit: (Image by Argonne National…

Published

on

Paving the way to a brand-new class of computers that will drive unprecedented innovation and scientific breakthroughs.

Credit: (Image by Argonne National Laboratory.)

Paving the way to a brand-new class of computers that will drive unprecedented innovation and scientific breakthroughs.

Occupying the space of two professional basketball courts and weighing 600 tons, the massive Aurora exascale supercomputer is taking shape at the U.S. Department of Energy’s (DOE) Argonne National Laboratory.

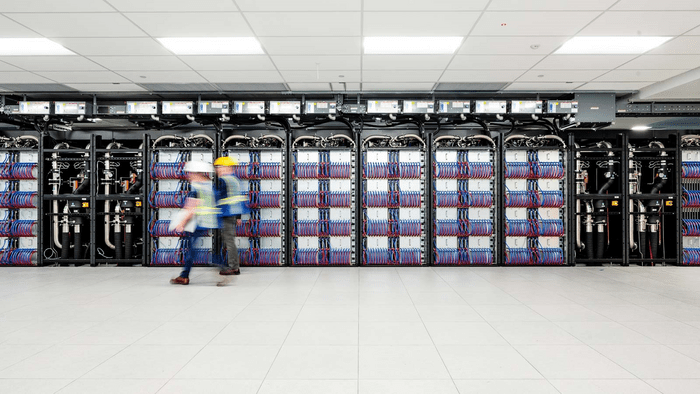
Long rows of 8-foot-tall black cabinets loom large inside a new wing of the white-walled data center that houses Argonne’s other supercomputers. Aurora’s computing racks are interspersed with cabinets containing a special water-cooling system. Countless red and blue cables curl in and out of each cabinet, piping water from beneath the data center floor to cool the system. Electrical wiring supplies power from the mechanical room above, and more than 300 miles of networking cables connect the system together.

“It is going to be a game-changing tool for the scientific community.” — ALCF Director Michael Papka

Work has been underway for several years to get the infrastructure in place to operate the world-class system. Built by Intel and Hewlett Packard Enterprise, Aurora will be theoretically capable of delivering more than two exaflops of computing power. That means it should be able to do more than 2 billion billion calculations per second, making Aurora one of the fastest supercomputers in the world.

When Aurora is completed next year, its high computing speed and artificial intelligence capabilities will enable science that is impossible today.

Researchers from across the world use the supercomputers at the Argonne Leadership Computing Facility (ALCF) to tackle a wide range of scientific problems. Examples include designing more efficient airplanes, investigating the mysteries of the cosmos, modeling the impacts of climate change and accelerating the discovery of new materials. The ALCF is a DOE Office of Science user facility.

“With Aurora, we’re building a machine that will be able to do artificial intelligence, big data analysis and high-fidelity simulations at a scale we haven’t seen before,” said ALCF Director Michael Papka. ​“It is going to be a game-changing tool for the scientific community.”

The process of deploying a new supercomputer begins with the major facility upgrades necessary to operate the system, including utility-scale electrical and mechanical work.

“Preparing for a new supercomputer requires years of planning, coordination and collaboration,” said Susan Coghlan, ALCF project director for Aurora. ​“Aurora is our largest and most powerful supercomputer yet, so we’ve had to do some substantial facility upgrades to get ready for the system. We’ve transformed our building with the addition of new data center space, mechanical rooms and equipment that significantly increased our power and cooling capacity.”

Because Aurora is a liquid-cooled system, Argonne had to upgrade its cooling capacity to pump 44,000 gallons of water through a complex loop of pipes that connects to cooling towers, chillers, heat exchangers, a filtration system and other components. With pipes ranging from 4 inches to 30 inches in diameter, the cooling system ensures the water is at the perfect temperature, pressure and purity levels as it passes through the Aurora hardware.

The electrical room, which is located on the floor above the data center, is reinforced to support the weight of an airplane. It contains 14 substations that provide 60 megawatts of electricity to power not only Aurora but future Argonne computing systems and the entire building’s day-to-day electricity needs. The electrical room is outfitted with a large ceiling hatch so the substations can be lowered in (and out if needed) by construction cranes. 

“When we’re doing utility-scale work to upgrade power and cooling capacity, we aim to create an infrastructure that can support future systems as well,” Coghlan said.

Once the major facility upgrades were in place, the team moved on to improvements like making sure power is delivered to the right locations at the right voltage, installing heavy-duty floor tiles to support the massive supercomputer, and putting in pipes to link the water system to Aurora.

The installation continues this fall with the phased delivery of Aurora’s computing engine: Intel’s state-of-the-art GPUs (graphics processing units) and CPUs (central processing units). Six GPUs and two CPUs are encapsulated in a sleek, thin compute blade, which holds the hardware components that make up a machine. Blades will be inserted vertically into each of Aurora’s cabinets. The final phase will upgrade the system with high-bandwidth memory.

While there are always challenges associated with construction work at this scale, many Aurora facility upgrades were carried out during the COVID-19 pandemic, creating some unforeseen issues related to contractor access and supply chain disruptions. The Aurora team has been building the supercomputer piece by piece as components have become available.

“We’ve basically assembled and built the entire system on the data center floor,” Coghlan said. ​“Instead of waiting for every part to be ready at once, we decided to take whatever parts and pieces we could get. We’ve had to be agile, adapting and modifying the plan on the fly to look at what we can build and what we have to push off to a later date.”

Having much of the physical system and supporting infrastructure in place has allowed Argonne, Intel and Hewlett Packard Enterprise to test and fine-tune various components, such as the storage system and the cooling loop, ahead of the supercomputer’s deployment so that it’s ready for science on day one.

“It’s been amazing to see our building go from a construction zone to a new state-of-the-art data center,” Papka said. ​“We can’t wait to power on Aurora, open it up to the research community, and work with them to take their science to new levels.”

The Argonne Leadership Computing Facility provides supercomputing capabilities to the scientific and engineering community to advance fundamental discovery and understanding in a broad range of disciplines. Supported by the U.S. Department of Energy’s (DOE’s) Office of Science, Advanced Scientific Computing Research (ASCR) program, the ALCF is one of two DOE Leadership Computing Facilities in the nation dedicated to open science.

Argonne National Laboratory seeks solutions to pressing national problems in science and technology. The nation’s first national laboratory, Argonne conducts leading-edge basic and applied scientific research in virtually every scientific discipline. Argonne researchers work closely with researchers from hundreds of companies, universities, and federal, state and municipal agencies to help them solve their specific problems, advance America’s scientific leadership and prepare the nation for a better future. With employees from more than 60 nations, Argonne is managed by UChicago Argonne, LLC for the U.S. Department of Energy’s Office of Science.

The U.S. Department of Energy’s Office of Science is the single largest supporter of basic research in the physical sciences in the United States and is working to address some of the most pressing challenges of our time. For more information, visit https://​ener​gy​.gov/​s​c​ience.


Read More

Continue Reading

Uncategorized

February Employment Situation

By Paul Gomme and Peter Rupert The establishment data from the BLS showed a 275,000 increase in payroll employment for February, outpacing the 230,000…

Published

on

By Paul Gomme and Peter Rupert

The establishment data from the BLS showed a 275,000 increase in payroll employment for February, outpacing the 230,000 average over the previous 12 months. The payroll data for January and December were revised down by a total of 167,000. The private sector added 223,000 new jobs, the largest gain since May of last year.

Temporary help services employment continues a steep decline after a sharp post-pandemic rise.

Average hours of work increased from 34.2 to 34.3. The increase, along with the 223,000 private employment increase led to a hefty increase in total hours of 5.6% at an annualized rate, also the largest increase since May of last year.

The establishment report, once again, beat “expectations;” the WSJ survey of economists was 198,000. Other than the downward revisions, mentioned above, another bit of negative news was a smallish increase in wage growth, from $34.52 to $34.57.

The household survey shows that the labor force increased 150,000, a drop in employment of 184,000 and an increase in the number of unemployed persons of 334,000. The labor force participation rate held steady at 62.5, the employment to population ratio decreased from 60.2 to 60.1 and the unemployment rate increased from 3.66 to 3.86. Remember that the unemployment rate is the number of unemployed relative to the labor force (the number employed plus the number unemployed). Consequently, the unemployment rate can go up if the number of unemployed rises holding fixed the labor force, or if the labor force shrinks holding the number unemployed unchanged. An increase in the unemployment rate is not necessarily a bad thing: it may reflect a strong labor market drawing “marginally attached” individuals from outside the labor force. Indeed, there was a 96,000 decline in those workers.

Earlier in the week, the BLS announced JOLTS (Job Openings and Labor Turnover Survey) data for January. There isn’t much to report here as the job openings changed little at 8.9 million, the number of hires and total separations were little changed at 5.7 million and 5.3 million, respectively.

As has been the case for the last couple of years, the number of job openings remains higher than the number of unemployed persons.

Also earlier in the week the BLS announced that productivity increased 3.2% in the 4th quarter with output rising 3.5% and hours of work rising 0.3%.

The bottom line is that the labor market continues its surprisingly (to some) strong performance, once again proving stronger than many had expected. This strength makes it difficult to justify any interest rate cuts soon, particularly given the recent inflation spike.

Read More

Continue Reading

Uncategorized

Mortgage rates fall as labor market normalizes

Jobless claims show an expanding economy. We will only be in a recession once jobless claims exceed 323,000 on a four-week moving average.

Published

on

Everyone was waiting to see if this week’s jobs report would send mortgage rates higher, which is what happened last month. Instead, the 10-year yield had a muted response after the headline number beat estimates, but we have negative job revisions from previous months. The Federal Reserve’s fear of wage growth spiraling out of control hasn’t materialized for over two years now and the unemployment rate ticked up to 3.9%. For now, we can say the labor market isn’t tight anymore, but it’s also not breaking.

The key labor data line in this expansion is the weekly jobless claims report. Jobless claims show an expanding economy that has not lost jobs yet. We will only be in a recession once jobless claims exceed 323,000 on a four-week moving average.

From the Fed: In the week ended March 2, initial claims for unemployment insurance benefits were flat, at 217,000. The four-week moving average declined slightly by 750, to 212,250


Below is an explanation of how we got here with the labor market, which all started during COVID-19.

1. I wrote the COVID-19 recovery model on April 7, 2020, and retired it on Dec. 9, 2020. By that time, the upfront recovery phase was done, and I needed to model out when we would get the jobs lost back.

2. Early in the labor market recovery, when we saw weaker job reports, I doubled and tripled down on my assertion that job openings would get to 10 million in this recovery. Job openings rose as high as to 12 million and are currently over 9 million. Even with the massive miss on a job report in May 2021, I didn’t waver.

Currently, the jobs openings, quit percentage and hires data are below pre-COVID-19 levels, which means the labor market isn’t as tight as it once was, and this is why the employment cost index has been slowing data to move along the quits percentage.  

2-US_Job_Quits_Rate-1-2

3. I wrote that we should get back all the jobs lost to COVID-19 by September of 2022. At the time this would be a speedy labor market recovery, and it happened on schedule, too

Total employment data

4. This is the key one for right now: If COVID-19 hadn’t happened, we would have between 157 million and 159 million jobs today, which would have been in line with the job growth rate in February 2020. Today, we are at 157,808,000. This is important because job growth should be cooling down now. We are more in line with where the labor market should be when averaging 140K-165K monthly. So for now, the fact that we aren’t trending between 140K-165K means we still have a bit more recovery kick left before we get down to those levels. 


From BLS: Total nonfarm payroll employment rose by 275,000 in February, and the unemployment rate increased to 3.9 percent, the U.S. Bureau of Labor Statistics reported today. Job gains occurred in health care, in government, in food services and drinking places, in social assistance, and in transportation and warehousing.

Here are the jobs that were created and lost in the previous month:

IMG_5092

In this jobs report, the unemployment rate for education levels looks like this:

  • Less than a high school diploma: 6.1%
  • High school graduate and no college: 4.2%
  • Some college or associate degree: 3.1%
  • Bachelor’s degree or higher: 2.2%
IMG_5093_320f22

Today’s report has continued the trend of the labor data beating my expectations, only because I am looking for the jobs data to slow down to a level of 140K-165K, which hasn’t happened yet. I wouldn’t categorize the labor market as being tight anymore because of the quits ratio and the hires data in the job openings report. This also shows itself in the employment cost index as well. These are key data lines for the Fed and the reason we are going to see three rate cuts this year.

Read More

Continue Reading

Uncategorized

Inside The Most Ridiculous Jobs Report In History: Record 1.2 Million Immigrant Jobs Added In One Month

Inside The Most Ridiculous Jobs Report In History: Record 1.2 Million Immigrant Jobs Added In One Month

Last month we though that the January…

Published

on

Inside The Most Ridiculous Jobs Report In History: Record 1.2 Million Immigrant Jobs Added In One Month

Last month we though that the January jobs report was the "most ridiculous in recent history" but, boy, were we wrong because this morning the Biden department of goalseeked propaganda (aka BLS) published the February jobs report, and holy crap was that something else. Even Goebbels would blush. 

What happened? Let's take a closer look.

On the surface, it was (almost) another blockbuster jobs report, certainly one which nobody expected, or rather just one bank out of 76 expected. Starting at the top, the BLS reported that in February the US unexpectedly added 275K jobs, with just one research analyst (from Dai-Ichi Research) expecting a higher number.

Some context: after last month's record 4-sigma beat, today's print was "only" 3 sigma higher than estimates. Needless to say, two multiple sigma beats in a row used to only happen in the USSR... and now in the US, apparently.

Before we go any further, a quick note on what last month we said was "the most ridiculous jobs report in recent history": it appears the BLS read our comments and decided to stop beclowing itself. It did that by slashing last month's ridiculous print by over a third, and revising what was originally reported as a massive 353K beat to just 229K,  a 124K revision, which was the biggest one-month negative revision in two years!

Of course, that does not mean that this month's jobs print won't be revised lower: it will be, and not just that month but every other month until the November election because that's the only tool left in the Biden admin's box: pretend the economic and jobs are strong, then revise them sharply lower the next month, something we pointed out first last summer and which has not failed to disappoint once.

To be fair, not every aspect of the jobs report was stellar (after all, the BLS had to give it some vague credibility). Take the unemployment rate, after flatlining between 3.4% and 3.8% for two years - and thus denying expectations from Sahm's Rule that a recession may have already started - in February the unemployment rate unexpectedly jumped to 3.9%, the highest since February 2022 (with Black unemployment spiking by 0.3% to 5.6%, an indicator which the Biden admin will quickly slam as widespread economic racism or something).

And then there were average hourly earnings, which after surging 0.6% MoM in January (since revised to 0.5%) and spooking markets that wage growth is so hot, the Fed will have no choice but to delay cuts, in February the number tumbled to just 0.1%, the lowest in two years...

... for one simple reason: last month's average wage surge had nothing to do with actual wages, and everything to do with the BLS estimate of hours worked (which is the denominator in the average wage calculation) which last month tumbled to just 34.1 (we were led to believe) the lowest since the covid pandemic...

... but has since been revised higher while the February print rose even more, to 34.3, hence why the latest average wage data was once again a product not of wages going up, but of how long Americans worked in any weekly period, in this case higher from 34.1 to 34.3, an increase which has a major impact on the average calculation.

While the above data points were examples of some latent weakness in the latest report, perhaps meant to give it a sheen of veracity, it was everything else in the report that was a problem starting with the BLS's latest choice of seasonal adjustments (after last month's wholesale revision), which have gone from merely laughable to full clownshow, as the following comparison between the monthly change in BLS and ADP payrolls shows. The trend is clear: the Biden admin numbers are now clearly rising even as the impartial ADP (which directly logs employment numbers at the company level and is far more accurate), shows an accelerating slowdown.

But it's more than just the Biden admin hanging its "success" on seasonal adjustments: when one digs deeper inside the jobs report, all sorts of ugly things emerge... such as the growing unprecedented divergence between the Establishment (payrolls) survey and much more accurate Household (actual employment) survey. To wit, while in January the BLS claims 275K payrolls were added, the Household survey found that the number of actually employed workers dropped for the third straight month (and 4 in the past 5), this time by 184K (from 161.152K to 160.968K).

This means that while the Payrolls series hits new all time highs every month since December 2020 (when according to the BLS the US had its last month of payrolls losses), the level of Employment has not budged in the past year. Worse, as shown in the chart below, such a gaping divergence has opened between the two series in the past 4 years, that the number of Employed workers would need to soar by 9 million (!) to catch up to what Payrolls claims is the employment situation.

There's more: shifting from a quantitative to a qualitative assessment, reveals just how ugly the composition of "new jobs" has been. Consider this: the BLS reports that in February 2024, the US had 132.9 million full-time jobs and 27.9 million part-time jobs. Well, that's great... until you look back one year and find that in February 2023 the US had 133.2 million full-time jobs, or more than it does one year later! And yes, all the job growth since then has been in part-time jobs, which have increased by 921K since February 2023 (from 27.020 million to 27.941 million).

Here is a summary of the labor composition in the past year: all the new jobs have been part-time jobs!

But wait there's even more, because now that the primary season is over and we enter the heart of election season and political talking points will be thrown around left and right, especially in the context of the immigration crisis created intentionally by the Biden administration which is hoping to import millions of new Democratic voters (maybe the US can hold the presidential election in Honduras or Guatemala, after all it is their citizens that will be illegally casting the key votes in November), what we find is that in February, the number of native-born workers tumbled again, sliding by a massive 560K to just 129.807 million. Add to this the December data, and we get a near-record 2.4 million plunge in native-born workers in just the past 3 months (only the covid crash was worse)!

The offset? A record 1.2 million foreign-born (read immigrants, both legal and illegal but mostly illegal) workers added in February!

Said otherwise, not only has all job creation in the past 6 years has been exclusively for foreign-born workers...

Source: St Louis Fed FRED Native Born and Foreign Born

... but there has been zero job-creation for native born workers since June 2018!

This is a huge issue - especially at a time of an illegal alien flood at the southwest border...

... and is about to become a huge political scandal, because once the inevitable recession finally hits, there will be millions of furious unemployed Americans demanding a more accurate explanation for what happened - i.e., the illegal immigration floodgates that were opened by the Biden admin.

Which is also why Biden's handlers will do everything in their power to insure there is no official recession before November... and why after the election is over, all economic hell will finally break loose. Until then, however, expect the jobs numbers to get even more ridiculous.

Tyler Durden Fri, 03/08/2024 - 13:30

Read More

Continue Reading

Trending