Uncategorized
Amazon Erases 12% Gain, Turns Red After Revealing Sharp Slowdown In April AWS Growth
Amazon Erases 12% Gain, Turns Red After Revealing Sharp Slowdown In April AWS Growth
Update (6:00pm): Everything was going ok, with AMZN stock…
Share this:

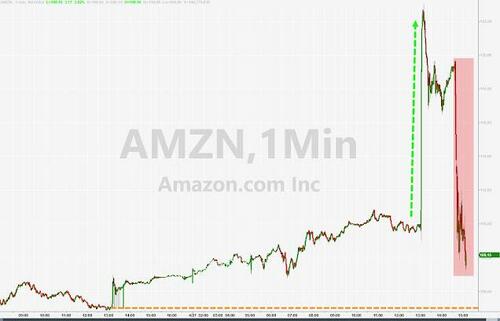
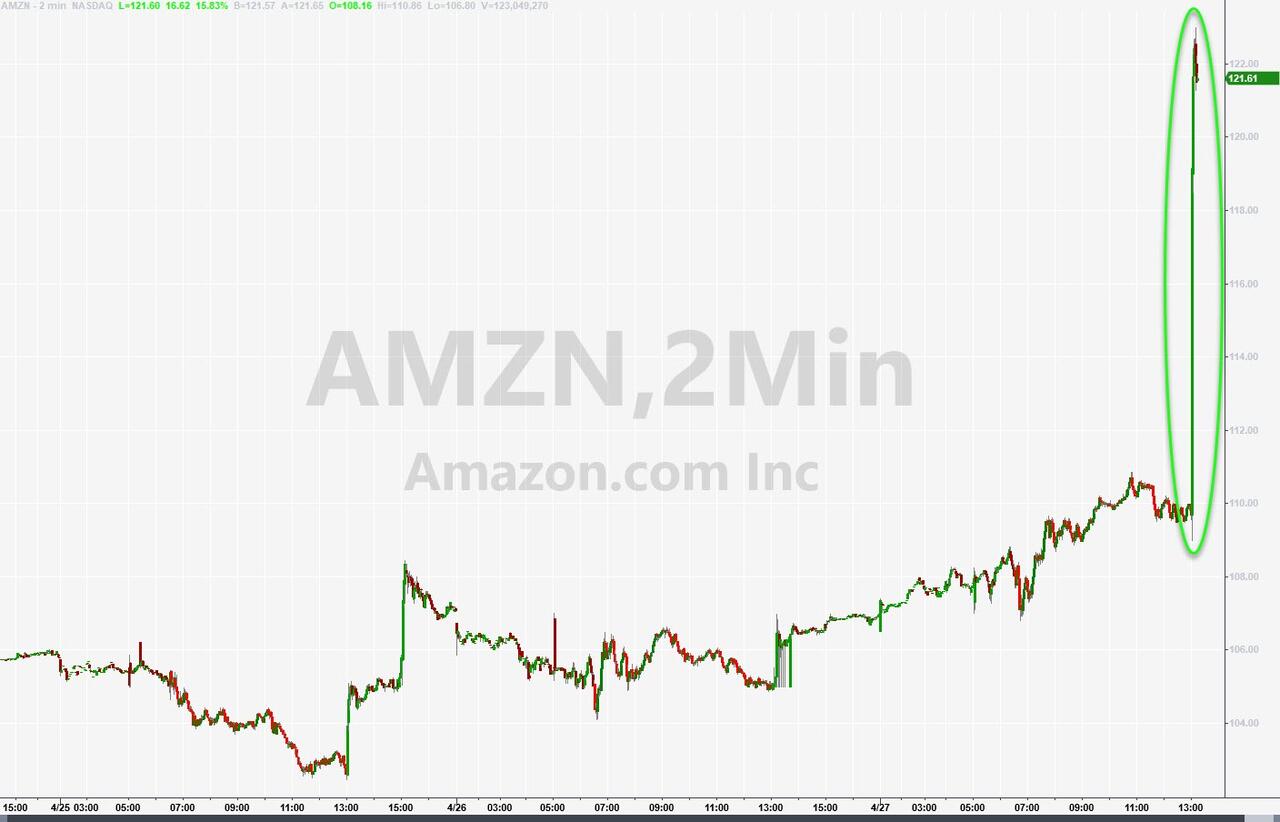
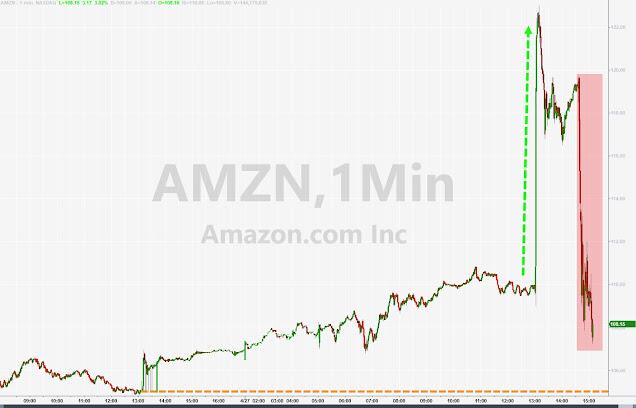
Update (6:00pm): Everything was going ok, with AMZN stock soaring as much as 12% and then suddenly AMZN stock erased all gains and turned red during the company's analyst earnings call (the media call held an hour earlier went by ok).
There was initially some confusion what sparked the plunge, but it eventually was revealed that during the call, Amazon said that “Customers continue to evaluate ways to optimize their cloud spending in response to these tough economic conditions in Q1 and we are seeing these optimizations continue into Q2 with April revenue growth rates about 500bps lower than what we saw in Q1."
As noted earlier (see below), AWS did a little better than analysts had expected in 1Q, but that might not be worth much if growth continues to drift toward single digits.
The company tried to provide some favorable spin with the CEO saying that he is "pretty optimistic that we have a chance not just to recover to where we were pre-pandemic in terms of operating margin, but I think there is additional upside with some of the opportunities we've identified" but by now it was too little too late, and the stock had erased all of its earlier gains and was on the verge of turning red for the day.
* * *
With three out of five FAAMG stocks - which of course is now known as GAMMA ever since Facebook's ignominious rebranding to Meta (at least until the company quietly changes its name to MetAI) - having already reported solid results helping push the market back into the green for the week, investors are keenly looking to Amazon earnings after the close today to (almost) round out the picture for the resurgent market generals while could set the tone for the rest of 2023... or at least until the Fed meeting next week.
As previewed earlier, Amazon is expected to post sales of $125 billion, up 7.1% from a year earlier. According to Bloomberg, analysts and investors will be watching for insights into consumer spending patterns, both in terms of confidence in the overall economy and with regard to how much they are spending online vs. in stores. Investors will also be watching to see how Amazon’s cloud computing business and advertising business are holding up.
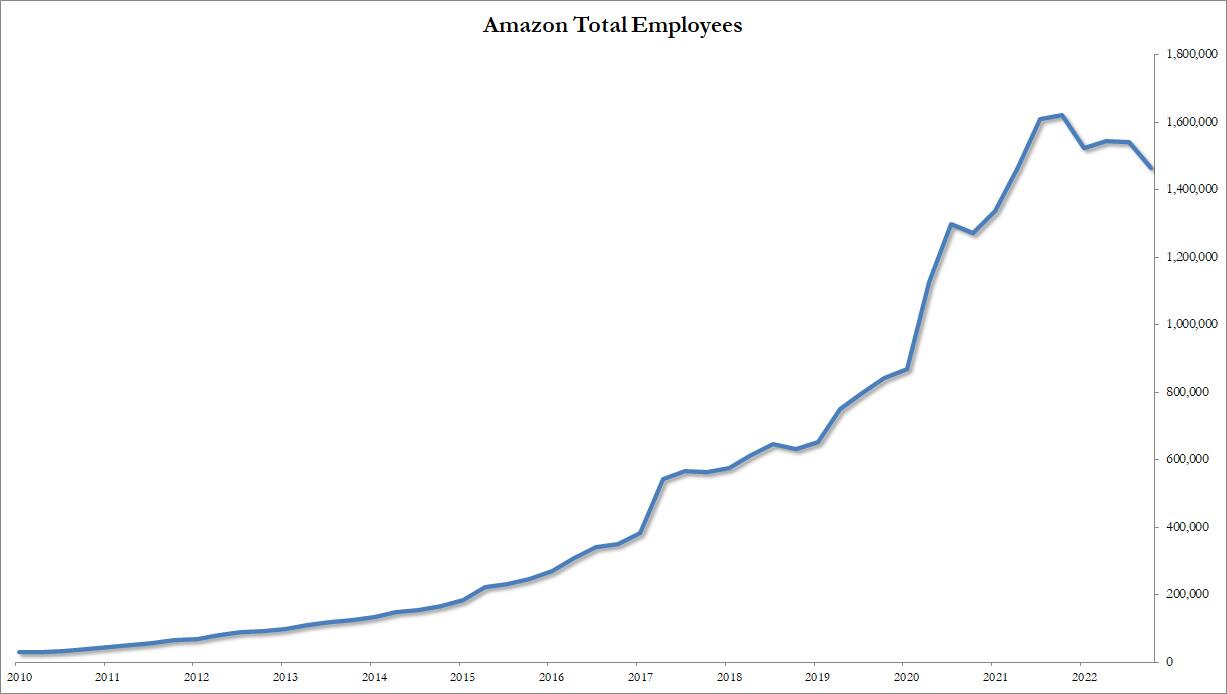
Investors will also want to see signs that CEO Andy Jassy’s cost-cutting measures - which included cutting 27,000 corporate employees - are helping to slash expenses and boost profits. Amazon had 1.5 million employees at the end of 2022, mostly blue-collar workers in its warehouses. In addition to the corporate cuts, Amazon tends to trim its warehouse workforce after the holiday shopping season.
But by far the most important variable will be Amazon Web Services, which is expected to post sales growth of 14%, the slowest since Amazon began breaking out the cloud-computing division’s performance with data going back to 2014. AWS almost always accounts for more operating income than the rest of Amazon’s businesses combined. But the unit has been hit hard as businesses pare their technology spending. Among the biggest questions for Amazon during this year of cost cutting and layoffs is how low AWS’s growth might sink.
What about Artificial Intelligence, which has been the core theme of Microsoft, Google and Meta’s earnings calls so far this week. How will Amazon play it? The company’s shown its hand, to an extent, on how generative AI will boost their business. But the focus is on AWS and targeting cloud customers (rather than Amazon’s consumer-facing arms).
Finally, while Amazon stock has badly underperformed the rest of the GAMMA names, heading into today's earnings the stock gained and was on track to notch its biggest two-day jump since February. So far this year, the shares are up about 31%.
So with all that in mind, here is what Amazon just reported for its just concluded quarter
- Q1 EPS 31c,up from a 38c loss YoY, and beating the estimate of $0.21
- Q1 Net sales $127.358 billion, +9.4% y/y, beating the estimate of $124.7 billion
- Online stores net sales $51.10 billion vs. $51.13 billion y/y, beating estimate $50.57 billion
- Physical Stores net sales $4.90 billion, +6.6% y/y, beating estimate $4.77 billion
- Third- Party Seller Services net sales $29.82 billion, +18% y/y, beating estimate $28.7 billion
- Subscription Services net sales $9.66 billion, +15% y/y, estimate $9.29 billion
- North America net sales $76.88 billion, +11% y/y, beating estimate $75.54 billion
- International net sales $29.12 billion, +1.3% y/y, beating estimate $27.65 billion
- Third-party seller services net sales excluding F/X +20% vs. +9% y/y, beating estimate +13.9%
- Subscription services net sales excluding F/X +17% vs. +13% y/y, beating estimate +11.8%
- And the most important one: AWS net sales $21.35 billion, +16% y/y, beating estimate $21.03 billion
- Amazon Web Services net sales excluding F/X +16% vs. +37% y/y, estimate +13.8%
- Operating income $4.77 billion, +30% y/y, beating the estimate $3 billion
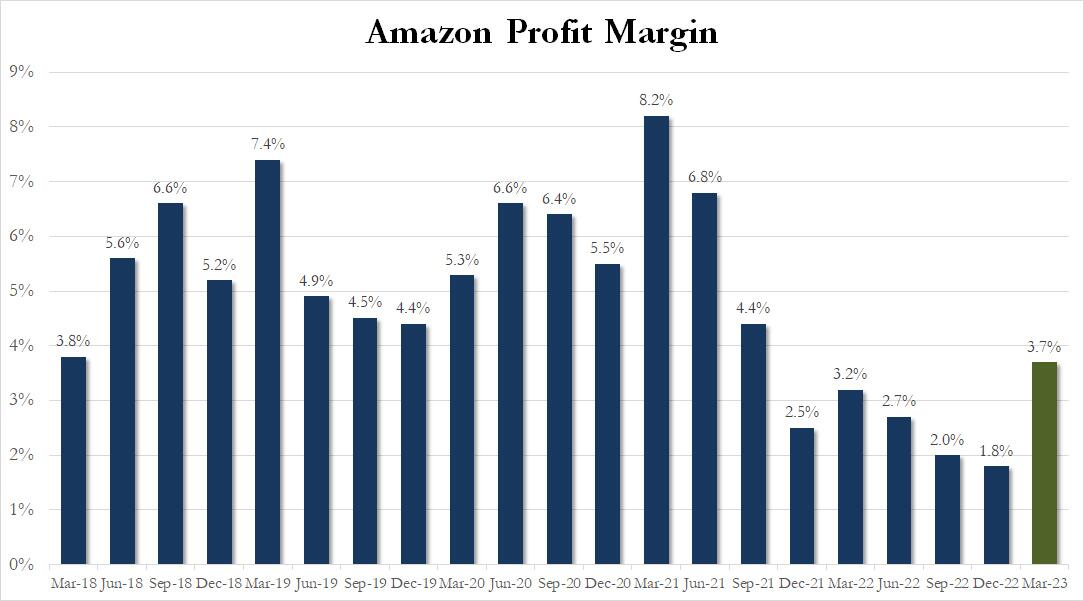
- Operating margin 3.7% vs. 3.2% y/y, beating the estimate 2.38%
- North America operating margin +1.2% vs. -2.3% y/y, beating the estimate +0.34%
- International operating margin -4.3% vs. -4.5% y/y, beating estimate -8.49%
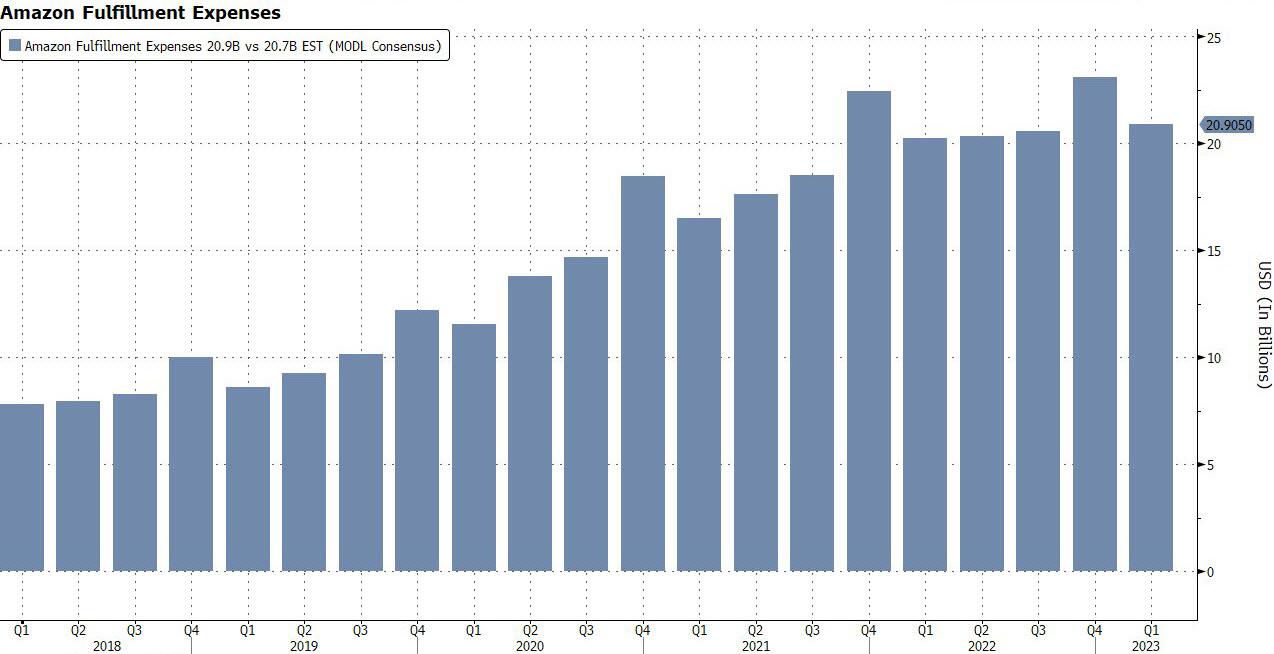
- Fulfillment expense $20.91 billion, +3.1% y/y, beating estimate $20.72 billion
- Seller unit mix 59% vs. 55% y/y, estimate 56.8%
Of note, FX headwinds were a factor in the quarter with AMZN booking $2.4 billion unfavorable impact from year-over-year changes in foreign exchange rates throughout the quarter. Excluding that impact, net sales increased 11% in 1Q compared with first quarter of 2022.
It's also notable that a big positive for Amazon was its continued revenue mix shift to providing services and advertising to independent merchants as opposed to selling goods directly to shoppers as a retailer. This is a more profitable business model for Amazon with less risk on inventory. Advertising revenue grew by more than 21% and seller services by 18%. Meanwhile, fulfillment expenses grew by just 3% and shipping costs by just 2%. Amazon is making more money off of its e-commerce and logistics operation while keeping expenses in check.
Bottom line here, Amazon beats expectations for Q1 across the board, and most importantly AWS came in well above expectations on both revenue growth and profit margin basis, which is why AMZN stock is seeing a buying frenzy after hours pushing it more than 10% higher.
There is another reason for the surge: the company's Q2 guidance was stellar:
- Sees net sales $127.0 billion to $133.0 billion, in line with the sellside estimate $130.1 billion; this represents growth between 5% and 10% compared with Q2 2022 and "anticipates an unfavorable impact of approximately 30 basis points from foreign exchange rates.”
- Sees operating income $2 to $5.5 billion, estimate $4.74 billion
The Q2 outlook, with sales of up to $133 billion and operating income of up to $5.5 billion, indicates it expects the positive momentum to continue.
In short, solid earnings beating expectations across the board, while guidance came generally in line with Wall Street expectations.
Commenting on the quarter, CEO Andy Jassy said that "we like the fundamentals we’re seeing in AWS, and believe there’s much growth ahead." He added that "our Advertising business continues to deliver robust growth, largely due to our ongoing machine learning investments that help customers see relevant information when they engage with us, which in turn delivers unusually strong results for brands."
Digging into the numbers we find that operating margins soared, more than doubling form 1.8% last quarter which was the lowest in at least five years, to 3.7%, smashing the consensus est of 2.38%.
While the market was clearly happy with the overall profit margin, it also appeared happy with the profit margin breakdown where the AWS profit margin dipped to the lowest since 2017. At the same time, international operating margin remained negative, with US online sales still just barely turned green, generating a 1.2% profit margin.
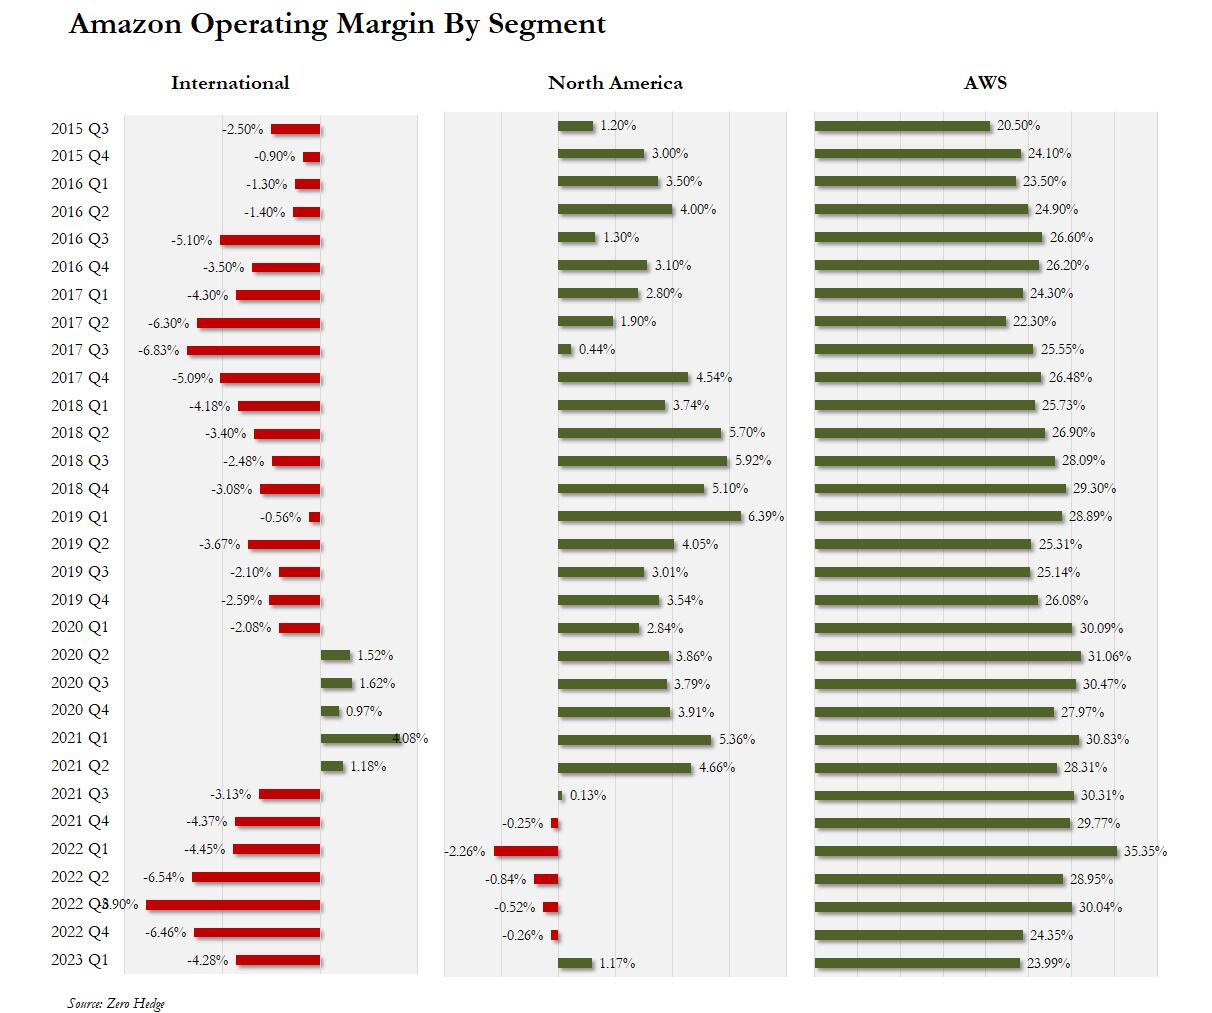
Maybe the AWS profit margin could have been better (which would be difficult when competitors are now aggressively cutting prices to capture market share), the silver lining was that revenue growth of 16% Y/Y to $21.354 billion, was better than the expected $21.03 billion.
Jassy had said in his annual shareholder letter a couple of weeks ago that AWS was facing some short-term headwinds. That idea is carried through into the earnings statement, where he says:
“While our AWS business navigates companies spending more cautiously in this macro environment, we continue to prioritize building long-term customer relationships both by helping customers save money and enabling them to more easily leverage technologies like Large Language Models and Generative AI with our uniquely cost-effective machine learning chips (‘Trainium’ and ‘Inferentia’), managed Large Language Models (‘Bedrock’), and AI code companion CodeWhisperer. We like the fundamentals we’re seeing in AWS, and believe there’s much growth ahead.”
And while AWS sales growth came in strong, the sales growth for Advertising Services came in even stronger at 23% YoY, a 35.5% beat relative to consensus.
On the expense side, we already know that AMZN has joined other companies in laying workers off, but a bigger question is whether its employees have plateaued and whether it will start replacing them with robots. Well, in Q1, employment dropped 10% to 1.47 million, well beyond the 27,000 corporate layoffs; furthermore Amazon is shedding blue collar warehouse workers as well, which is typical in the first quarter.
Elsewhere, fulfillment expenses, the cost of packing and shipping goods, were also close to expectations, indicating spending is under control.
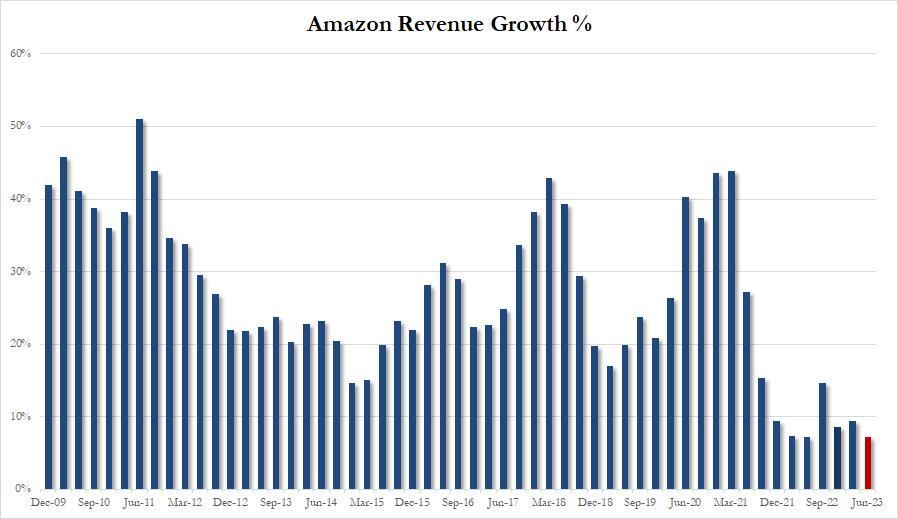
The market was also focused the company's revenue growth forecast which is in a range of $127-$133BN (midline at $130BN), which was on top of the $130.1BN expected. The problem is that at just 7.2%, this would be tied for the lowest annual growth in company history (just Q2 2022 would be comparable).
Finally for those asking, Amazon has clearly also jumped on the AI bandwagon, mentioning the phrase "AI" 6 times in the earnings release, and the full phrase “artificial intelligence” twice.
Responding to the results, Bloomberg Intelligence analyst Poonam Goyal said that “Amazon did much better than expected, especially in the face of inflation and thoughts from other company leaders who have said consumer spending has slowed recently. It’s quite promising that Amazon is still able to deliver. We don’t think it is promotions. We think it is demand, and consumers are flocking to Amazon for day-to-day needs.”
The market agreed, and its reaction was euphoric at least initially, with the stock spiking as much as 12% higher in kneejerk before dipping modestly, but still solidly in the green on the day.
Uncategorized
February Employment Situation
By Paul Gomme and Peter Rupert The establishment data from the BLS showed a 275,000 increase in payroll employment for February, outpacing the 230,000…
Share this:


By Paul Gomme and Peter Rupert
The establishment data from the BLS showed a 275,000 increase in payroll employment for February, outpacing the 230,000 average over the previous 12 months. The payroll data for January and December were revised down by a total of 167,000. The private sector added 223,000 new jobs, the largest gain since May of last year.

Temporary help services employment continues a steep decline after a sharp post-pandemic rise.


Average hours of work increased from 34.2 to 34.3. The increase, along with the 223,000 private employment increase led to a hefty increase in total hours of 5.6% at an annualized rate, also the largest increase since May of last year.

The establishment report, once again, beat “expectations;” the WSJ survey of economists was 198,000. Other than the downward revisions, mentioned above, another bit of negative news was a smallish increase in wage growth, from $34.52 to $34.57.

The household survey shows that the labor force increased 150,000, a drop in employment of 184,000 and an increase in the number of unemployed persons of 334,000. The labor force participation rate held steady at 62.5, the employment to population ratio decreased from 60.2 to 60.1 and the unemployment rate increased from 3.66 to 3.86. Remember that the unemployment rate is the number of unemployed relative to the labor force (the number employed plus the number unemployed). Consequently, the unemployment rate can go up if the number of unemployed rises holding fixed the labor force, or if the labor force shrinks holding the number unemployed unchanged. An increase in the unemployment rate is not necessarily a bad thing: it may reflect a strong labor market drawing “marginally attached” individuals from outside the labor force. Indeed, there was a 96,000 decline in those workers.


Earlier in the week, the BLS announced JOLTS (Job Openings and Labor Turnover Survey) data for January. There isn’t much to report here as the job openings changed little at 8.9 million, the number of hires and total separations were little changed at 5.7 million and 5.3 million, respectively.

As has been the case for the last couple of years, the number of job openings remains higher than the number of unemployed persons.

Also earlier in the week the BLS announced that productivity increased 3.2% in the 4th quarter with output rising 3.5% and hours of work rising 0.3%.

The bottom line is that the labor market continues its surprisingly (to some) strong performance, once again proving stronger than many had expected. This strength makes it difficult to justify any interest rate cuts soon, particularly given the recent inflation spike.
unemployment pandemic unemploymentUncategorized
Mortgage rates fall as labor market normalizes
Jobless claims show an expanding economy. We will only be in a recession once jobless claims exceed 323,000 on a four-week moving average.
Share this:


Everyone was waiting to see if this week’s jobs report would send mortgage rates higher, which is what happened last month. Instead, the 10-year yield had a muted response after the headline number beat estimates, but we have negative job revisions from previous months. The Federal Reserve’s fear of wage growth spiraling out of control hasn’t materialized for over two years now and the unemployment rate ticked up to 3.9%. For now, we can say the labor market isn’t tight anymore, but it’s also not breaking.
The key labor data line in this expansion is the weekly jobless claims report. Jobless claims show an expanding economy that has not lost jobs yet. We will only be in a recession once jobless claims exceed 323,000 on a four-week moving average.
From the Fed: In the week ended March 2, initial claims for unemployment insurance benefits were flat, at 217,000. The four-week moving average declined slightly by 750, to 212,250
Below is an explanation of how we got here with the labor market, which all started during COVID-19.
1. I wrote the COVID-19 recovery model on April 7, 2020, and retired it on Dec. 9, 2020. By that time, the upfront recovery phase was done, and I needed to model out when we would get the jobs lost back.
2. Early in the labor market recovery, when we saw weaker job reports, I doubled and tripled down on my assertion that job openings would get to 10 million in this recovery. Job openings rose as high as to 12 million and are currently over 9 million. Even with the massive miss on a job report in May 2021, I didn’t waver.
Currently, the jobs openings, quit percentage and hires data are below pre-COVID-19 levels, which means the labor market isn’t as tight as it once was, and this is why the employment cost index has been slowing data to move along the quits percentage.

3. I wrote that we should get back all the jobs lost to COVID-19 by September of 2022. At the time this would be a speedy labor market recovery, and it happened on schedule, too
Total employment data
4. This is the key one for right now: If COVID-19 hadn’t happened, we would have between 157 million and 159 million jobs today, which would have been in line with the job growth rate in February 2020. Today, we are at 157,808,000. This is important because job growth should be cooling down now. We are more in line with where the labor market should be when averaging 140K-165K monthly. So for now, the fact that we aren’t trending between 140K-165K means we still have a bit more recovery kick left before we get down to those levels.

From BLS: Total nonfarm payroll employment rose by 275,000 in February, and the unemployment rate increased to 3.9 percent, the U.S. Bureau of Labor Statistics reported today. Job gains occurred in health care, in government, in food services and drinking places, in social assistance, and in transportation and warehousing.
Here are the jobs that were created and lost in the previous month:

In this jobs report, the unemployment rate for education levels looks like this:
- Less than a high school diploma: 6.1%
- High school graduate and no college: 4.2%
- Some college or associate degree: 3.1%
- Bachelor’s degree or higher: 2.2%

Today’s report has continued the trend of the labor data beating my expectations, only because I am looking for the jobs data to slow down to a level of 140K-165K, which hasn’t happened yet. I wouldn’t categorize the labor market as being tight anymore because of the quits ratio and the hires data in the job openings report. This also shows itself in the employment cost index as well. These are key data lines for the Fed and the reason we are going to see three rate cuts this year.
recession unemployment covid-19 fed federal reserve mortgage rates recession recovery unemploymentUncategorized
Inside The Most Ridiculous Jobs Report In History: Record 1.2 Million Immigrant Jobs Added In One Month
Inside The Most Ridiculous Jobs Report In History: Record 1.2 Million Immigrant Jobs Added In One Month
Last month we though that the January…
Share this:


Last month we though that the January jobs report was the "most ridiculous in recent history" but, boy, were we wrong because this morning the Biden department of goalseeked propaganda (aka BLS) published the February jobs report, and holy crap was that something else. Even Goebbels would blush.
What happened? Let's take a closer look.
On the surface, it was (almost) another blockbuster jobs report, certainly one which nobody expected, or rather just one bank out of 76 expected. Starting at the top, the BLS reported that in February the US unexpectedly added 275K jobs, with just one research analyst (from Dai-Ichi Research) expecting a higher number.
Some context: after last month's record 4-sigma beat, today's print was "only" 3 sigma higher than estimates. Needless to say, two multiple sigma beats in a row used to only happen in the USSR... and now in the US, apparently.

Before we go any further, a quick note on what last month we said was "the most ridiculous jobs report in recent history": it appears the BLS read our comments and decided to stop beclowing itself. It did that by slashing last month's ridiculous print by over a third, and revising what was originally reported as a massive 353K beat to just 229K, a 124K revision, which was the biggest one-month negative revision in two years!

Of course, that does not mean that this month's jobs print won't be revised lower: it will be, and not just that month but every other month until the November election because that's the only tool left in the Biden admin's box: pretend the economic and jobs are strong, then revise them sharply lower the next month, something we pointed out first last summer and which has not failed to disappoint once.
In the past month the Biden department of goalseeking stuff higher before revising it lower, has revised the following data sharply lower:
— zerohedge (@zerohedge) August 30, 2023
- Jobs
- JOLTS
- New Home sales
- Housing Starts and Permits
- Industrial Production
- PCE and core PCE
To be fair, not every aspect of the jobs report was stellar (after all, the BLS had to give it some vague credibility). Take the unemployment rate, after flatlining between 3.4% and 3.8% for two years - and thus denying expectations from Sahm's Rule that a recession may have already started - in February the unemployment rate unexpectedly jumped to 3.9%, the highest since February 2022 (with Black unemployment spiking by 0.3% to 5.6%, an indicator which the Biden admin will quickly slam as widespread economic racism or something).

And then there were average hourly earnings, which after surging 0.6% MoM in January (since revised to 0.5%) and spooking markets that wage growth is so hot, the Fed will have no choice but to delay cuts, in February the number tumbled to just 0.1%, the lowest in two years...

... for one simple reason: last month's average wage surge had nothing to do with actual wages, and everything to do with the BLS estimate of hours worked (which is the denominator in the average wage calculation) which last month tumbled to just 34.1 (we were led to believe) the lowest since the covid pandemic...

... but has since been revised higher while the February print rose even more, to 34.3, hence why the latest average wage data was once again a product not of wages going up, but of how long Americans worked in any weekly period, in this case higher from 34.1 to 34.3, an increase which has a major impact on the average calculation.

While the above data points were examples of some latent weakness in the latest report, perhaps meant to give it a sheen of veracity, it was everything else in the report that was a problem starting with the BLS's latest choice of seasonal adjustments (after last month's wholesale revision), which have gone from merely laughable to full clownshow, as the following comparison between the monthly change in BLS and ADP payrolls shows. The trend is clear: the Biden admin numbers are now clearly rising even as the impartial ADP (which directly logs employment numbers at the company level and is far more accurate), shows an accelerating slowdown.

But it's more than just the Biden admin hanging its "success" on seasonal adjustments: when one digs deeper inside the jobs report, all sorts of ugly things emerge... such as the growing unprecedented divergence between the Establishment (payrolls) survey and much more accurate Household (actual employment) survey. To wit, while in January the BLS claims 275K payrolls were added, the Household survey found that the number of actually employed workers dropped for the third straight month (and 4 in the past 5), this time by 184K (from 161.152K to 160.968K).

This means that while the Payrolls series hits new all time highs every month since December 2020 (when according to the BLS the US had its last month of payrolls losses), the level of Employment has not budged in the past year. Worse, as shown in the chart below, such a gaping divergence has opened between the two series in the past 4 years, that the number of Employed workers would need to soar by 9 million (!) to catch up to what Payrolls claims is the employment situation.

There's more: shifting from a quantitative to a qualitative assessment, reveals just how ugly the composition of "new jobs" has been. Consider this: the BLS reports that in February 2024, the US had 132.9 million full-time jobs and 27.9 million part-time jobs. Well, that's great... until you look back one year and find that in February 2023 the US had 133.2 million full-time jobs, or more than it does one year later! And yes, all the job growth since then has been in part-time jobs, which have increased by 921K since February 2023 (from 27.020 million to 27.941 million).

Here is a summary of the labor composition in the past year: all the new jobs have been part-time jobs!

But wait there's even more, because now that the primary season is over and we enter the heart of election season and political talking points will be thrown around left and right, especially in the context of the immigration crisis created intentionally by the Biden administration which is hoping to import millions of new Democratic voters (maybe the US can hold the presidential election in Honduras or Guatemala, after all it is their citizens that will be illegally casting the key votes in November), what we find is that in February, the number of native-born workers tumbled again, sliding by a massive 560K to just 129.807 million. Add to this the December data, and we get a near-record 2.4 million plunge in native-born workers in just the past 3 months (only the covid crash was worse)!

The offset? A record 1.2 million foreign-born (read immigrants, both legal and illegal but mostly illegal) workers added in February!

Said otherwise, not only has all job creation in the past 6 years has been exclusively for foreign-born workers...

... but there has been zero job-creation for native born workers since June 2018!

This is a huge issue - especially at a time of an illegal alien flood at the southwest border...

... and is about to become a huge political scandal, because once the inevitable recession finally hits, there will be millions of furious unemployed Americans demanding a more accurate explanation for what happened - i.e., the illegal immigration floodgates that were opened by the Biden admin.
Which is also why Biden's handlers will do everything in their power to insure there is no official recession before November... and why after the election is over, all economic hell will finally break loose. Until then, however, expect the jobs numbers to get even more ridiculous.


Wendy’s has a new deal for daylight savings time haters


Mortgage rates fall as labor market normalizes


Shipping company files surprise Chapter 7 bankruptcy, liquidation


Economic Earthquake Ahead? The Cracks Are Spreading Fast


February Employment Situation
Wendy’s teases new $3 offer for upcoming holiday


Inside The Most Ridiculous Jobs Report In Recent History: Record 1.2 Million Immigrant Jobs Added In One Month
Inside The Most Ridiculous Jobs Report In History: Record 1.2 Million Immigrant Jobs Added In One Month
-

 Uncategorized2 weeks ago
All Of The Elements Are In Place For An Economic Crisis Of Staggering Proportions
-

 Uncategorized1 month ago
Cathie Wood sells a major tech stock (again)
-

 Uncategorized3 weeks ago
California Counties Could Be Forced To Pay $300 Million To Cover COVID-Era Program
-

 Uncategorized2 weeks ago
Apparel Retailer Express Moving Toward Bankruptcy
-

 Uncategorized3 weeks ago
Industrial Production Decreased 0.1% in January
-

 International2 days ago
Walmart launches clever answer to Target’s new membership program
-

 International2 days ago
EyePoint poaches medical chief from Apellis; Sandoz CFO, longtime BioNTech exec to retire
-

 Uncategorized3 weeks ago
RFK Jr: The Wuhan Cover-Up & The Rise Of The Biowarfare-Industrial Complex